| Param | Original file | Final file |
|---|---|---|
| Filename | modeM0/AS1C04_007T02_9000002432cztM0_level2.fits | modeM0/AS1C04_007T02_9000002432cztM0_level2_quad_clean.evt |
| Size (bytes) | 98,720,640 | 94,432,320 |
| Size | 94.1 MB | 90.1 MB |
| Events in quadrant A | 595,318 | 558,202 |
| Events in quadrant B | 570,576 | 556,336 |
| Events in quadrant C | 582,198 | 528,147 |
| Events in quadrant D | 509,984 | 485,061 |
| Mode M0 | |||
|---|---|---|---|
| Quadrant | BADHDUFLAG | Total packets | Discarded packets |
| A | 0 | 23032 | 0 |
| B | 0 | 25143 | 0 |
| C | 0 | 22223 | 0 |
| D | 0 | 24041 | 0 |
| Mode SS | |||
|---|---|---|---|
| Quadrant | BADHDUFLAG | Total packets | Discarded packets |
| A | 0 | 218 | 0 |
| B | 0 | 218 | 0 |
| C | 0 | 218 | 0 |
| D | 0 | 218 | 0 |
| Mode M9 | |||
|---|---|---|---|
| Quadrant | BADHDUFLAG | Total packets | Discarded packets |
| A | 0 | 4 | 0 |
| B | 0 | 4 | 0 |
| C | 0 | 4 | 0 |
| D | 0 | 4 | 0 |
| Quadrant | Total seconds | Saturated seconds | Saturation percentage |
|---|---|---|---|
| A | 10552 | 364 | 3.449583% |
| B | 10552 | 391 | 3.705459% |
| C | 10552 | 320 | 3.032600% |
| D | 10552 | 372 | 3.525398% |
Noise dominated data is calculated using 1-second bins in cleaned event files. If a bin has >2000 counts, and if more than 50% of those come from <1% of pixels, then it is considered to be noise-dominated and hence unusable.
| Quadrant | # 1 sec bins | Bins with >0 counts | Bins with >2000 counts | High rate bins dominated by noise | Noise dominated (total time) | Noise dominated (detector-on time) | Marked lightcurve |
|---|---|---|---|---|---|---|---|
| A | 11057 | 10549 | 0 | 0 | 0.00% | 0.00% |  |
| B | 11057 | 10547 | 0 | 0 | 0.00% | 0.00% | 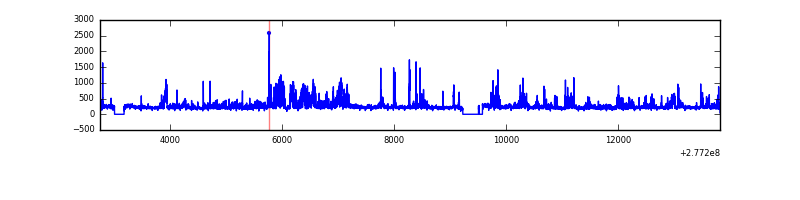 |
| C | 11057 | 10549 | 0 | 0 | 0.00% | 0.00% |  |
| D | 11057 | 10541 | 0 | 0 | 0.00% | 0.00% | 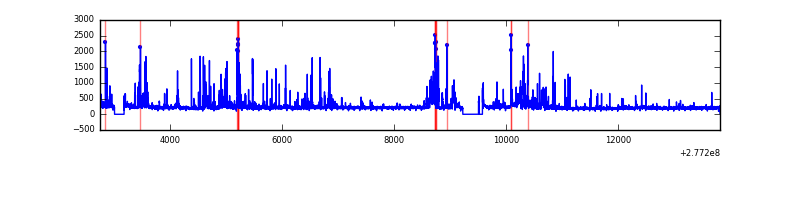 |
Top three noisy pixels from each quadrant. If the there are fewer than three noisy pixels in the level2.evt file, extra rows are filled as -1
| Pixel properties | Quadrant properties | ||||||
|---|---|---|---|---|---|---|---|
| Quadrant | DetID | PixID | Counts | Sigma | Mean | Median | Sigma |
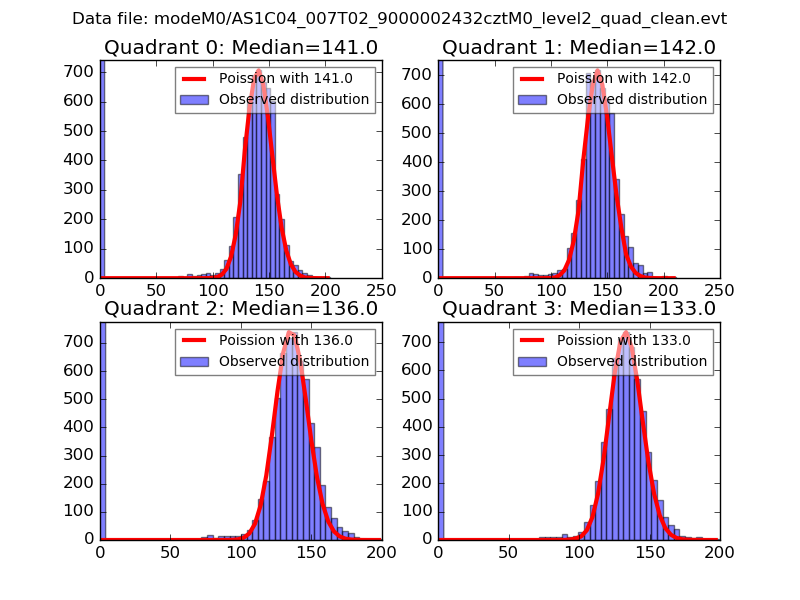
| A | 0 | 29 | 565 | 10.05 | 154 | 144 | 41.9 |
| A | 0 | 30 | 475 | 7.9 | 154 | 144 | 41.9 |
| A | 7 | 110 | 475 | 7.9 | 154 | 144 | 41.9 |
| B | 2 | 9 | 471 | 9.96 | 150 | 143 | 32.9 |
| B | 5 | 225 | 400 | 7.8 | 150 | 143 | 32.9 |
| B | 2 | 8 | 390 | 7.5 | 150 | 143 | 32.9 |
| C | 12 | 241 | 442 | 7.21 | 153 | 142 | 41.6 |
| C | 3 | 126 | 436 | 7.07 | 153 | 142 | 41.6 |
| C | 2 | 191 | 393 | 6.04 | 153 | 142 | 41.6 |
| D | 4 | 246 | 436 | 7.49 | 145 | 131 | 40.7 |
| D | 3 | 31 | 375 | 5.99 | 145 | 131 | 40.7 |
| D | 6 | 231 | 366 | 5.77 | 145 | 131 | 40.7 |
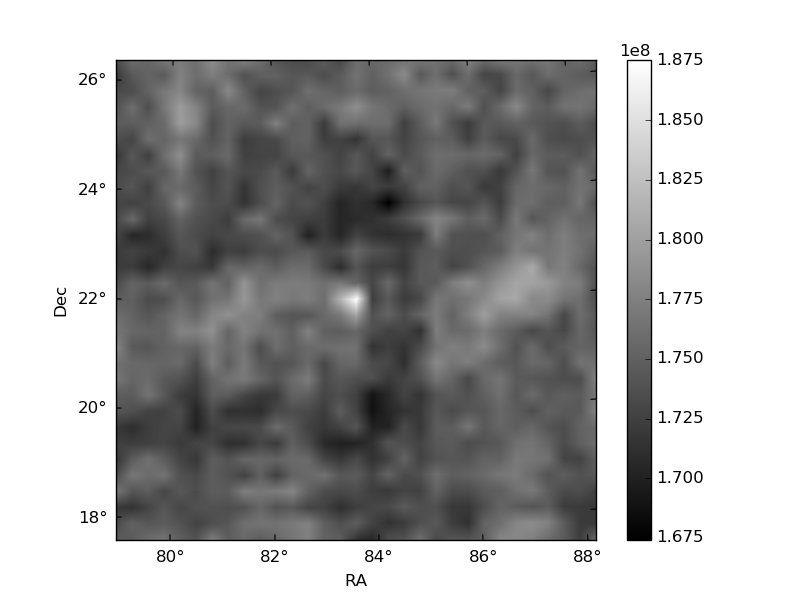
Histogram calculated using DETX and DETY for each event in the final _common_clean file
| Quadrant A | 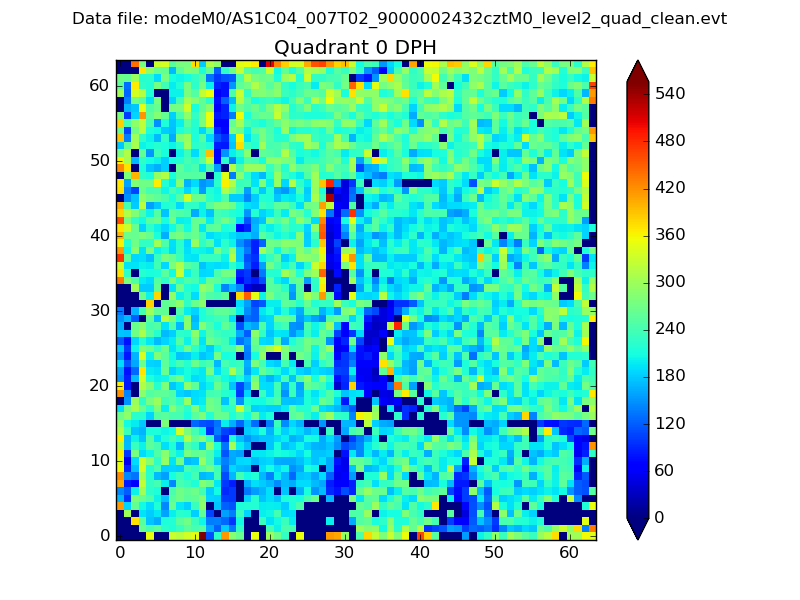 |
 |
Quadrant B |
|---|---|---|---|
| Quadrant D | 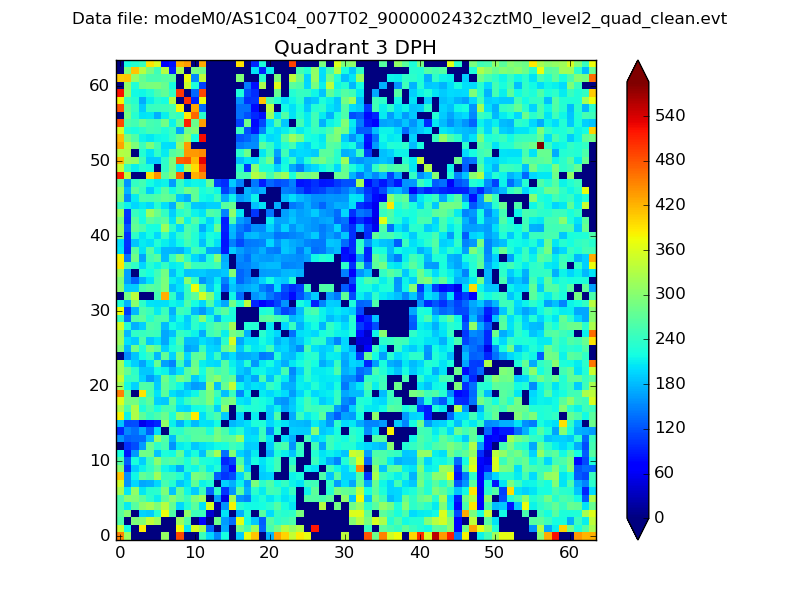 |
 |
Quadrant C |
| Plot type | Count rate plots | Images |
|---|---|---|
| Comparison with Poisson distribution Blue bars denote a histogram of data divided into 1 sec bins. Red curve is a Poisson curve with rate = median count rate of data. |
 |
 |
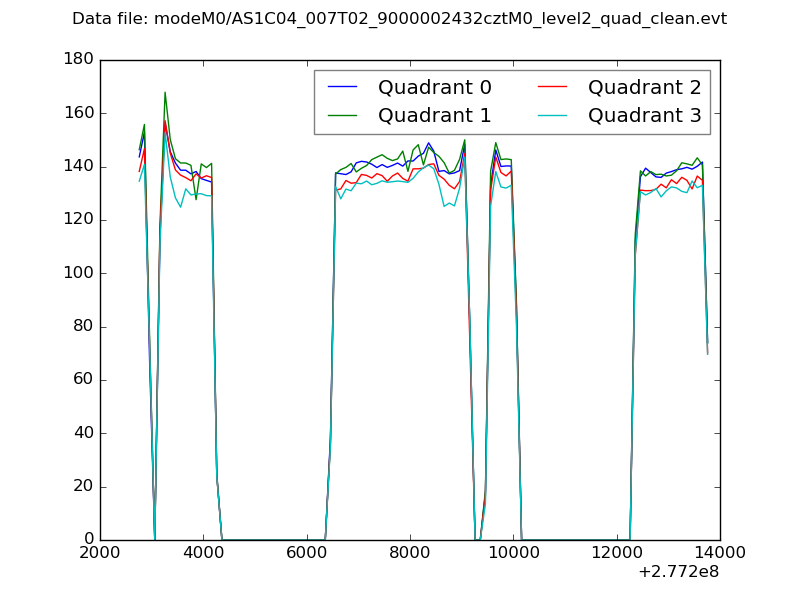
| Quadrant-wise count rates Data is divided into 100 sec bins |
 |
|
| Module-wise count rates for Quadrant A Data is divided into 100 sec bins |
 |
 |
| Module-wise count rates for Quadrant B Data is divided into 100 sec bins |
 |
 |
| Module-wise count rates for Quadrant C Data is divided into 100 sec bins |
 |
 |
| Module-wise count rates for Quadrant D Data is divided into 100 sec bins |
 |
 |
| Parameter | Plot |
|---|---|
| CZT HV Monitor |  |
| D_VDD |  |
| Temperature 1 |  |
| Veto HV Monitor | 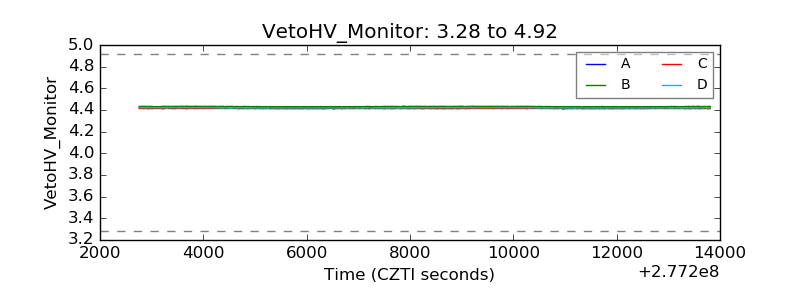 |
| Veto LLD |  |
| Alpha Counter | 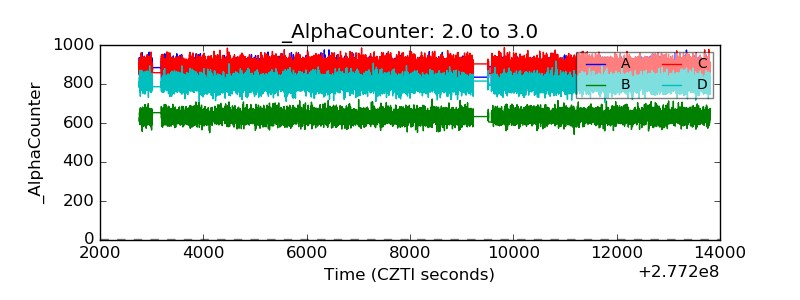 |
| _CPM_Rate |  |
| CZT Counter |  |
| +2.5 Volts monitor |  |
| +5 Volts monitor | 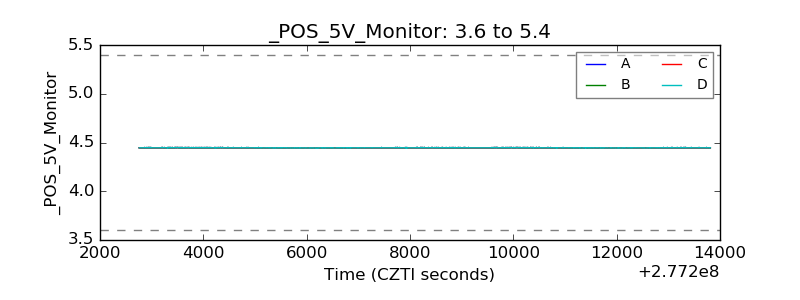 |
| _ROLL_ROT |  |
| _Roll_DEC |  |
| _Roll_RA |  |
| Veto Counter |  |