| Param | Original file | Final file |
|---|---|---|
| Filename | modeM0/AS1C04_007T02_9000002432_16462cztM0_level2.evt | modeM0/AS1C04_007T02_9000002432_16462cztM0_level2_quad_clean.evt |
| Size (bytes) | 148,357,440 | 29,396,160 |
| Size | 141.5 MB | 28.0 MB |
| Events in quadrant A | 1,230,044 | 190,690 |
| Events in quadrant B | 1,054,954 | 195,902 |
| Events in quadrant C | 966,752 | 189,240 |
| Events in quadrant D | 1,114,928 | 181,021 |
| Mode M0 | |||
|---|---|---|---|
| Quadrant | BADHDUFLAG | Total packets | Discarded packets |
| A | 0 | 4779 | 2 |
| B | 0 | 4260 | 1 |
| C | 0 | 4005 | 1 |
| D | 0 | 4526 | 1 |
| Mode SS | |||
|---|---|---|---|
| Quadrant | BADHDUFLAG | Total packets | Discarded packets |
| A | 0 | 40 | 0 |
| B | 0 | 40 | 0 |
| C | 0 | 40 | 0 |
| D | 0 | 40 | 0 |
| Mode M9 | |||
|---|---|---|---|
| Quadrant | BADHDUFLAG | Total packets | Discarded packets |
| A | 0 | 1 | 0 |
| B | 0 | 1 | 0 |
| C | 0 | 1 | 0 |
| D | 0 | 1 | 0 |
| Quadrant | Total seconds | Saturated seconds | Saturation percentage |
|---|---|---|---|
| A | 1809 | 221 | 12.216694% |
| B | 1809 | 175 | 9.673853% |
| C | 1809 | 165 | 9.121061% |
| D | 1809 | 173 | 9.563295% |
Noise dominated data is calculated using 1-second bins in cleaned event files. If a bin has >2000 counts, and if more than 50% of those come from <1% of pixels, then it is considered to be noise-dominated and hence unusable.
| Quadrant | # 1 sec bins | Bins with >0 counts | Bins with >2000 counts | High rate bins dominated by noise | Noise dominated (total time) | Noise dominated (detector-on time) | Marked lightcurve |
|---|---|---|---|---|---|---|---|
| A | 1980 | 1810 | 46 | 46 | 2.32% | 2.54% | 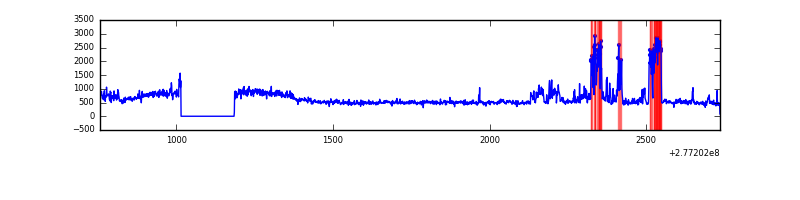 |
| B | 1980 | 1810 | 13 | 13 | 0.66% | 0.72% | 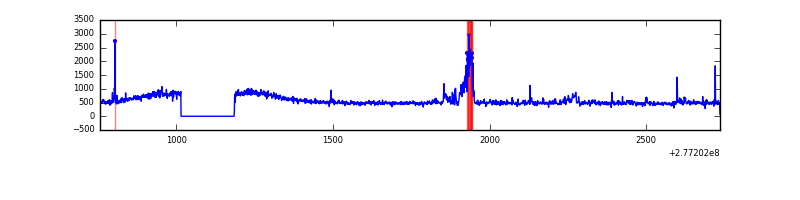 |
| C | 1980 | 1810 | 0 | 0 | 0.00% | 0.00% | 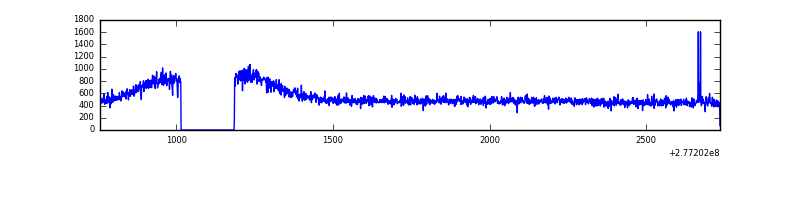 |
| D | 1980 | 1810 | 30 | 30 | 1.52% | 1.66% | 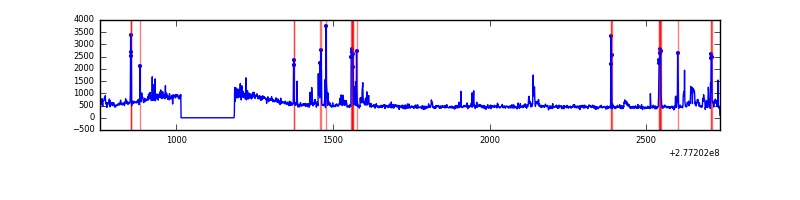 |
Top three noisy pixels from each quadrant. If the there are fewer than three noisy pixels in the level2.evt file, extra rows are filled as -1
| Pixel properties | Quadrant properties | ||||||
|---|---|---|---|---|---|---|---|
| Quadrant | DetID | PixID | Counts | Sigma | Mean | Median | Sigma |
| A | 15 | 174 | 278105 | 5293.07 | 247 | 242 | 52.5 |
| A | 0 | 226 | 2176 | 36.84 | 247 | 242 | 52.5 |
| A | 12 | 194 | 1828 | 30.21 | 247 | 242 | 52.5 |
| B | 4 | 173 | 51620 | 1006.51 | 244 | 237 | 51.1 |
| B | 15 | 35 | 19187 | 371.2 | 244 | 237 | 51.1 |
| B | 0 | 219 | 8601 | 163.84 | 244 | 237 | 51.1 |
| C | 14 | 238 | 35053 | 606.35 | 236 | 236 | 57.4 |
| C | 0 | 207 | 4167 | 68.45 | 236 | 236 | 57.4 |
| C | 8 | 128 | 3567 | 58.0 | 236 | 236 | 57.4 |
| D | 1 | 52 | 93484 | 1511.18 | 241 | 233 | 61.7 |
| D | 2 | 33 | 39042 | 628.92 | 241 | 233 | 61.7 |
| D | 12 | 218 | 35724 | 575.15 | 241 | 233 | 61.7 |
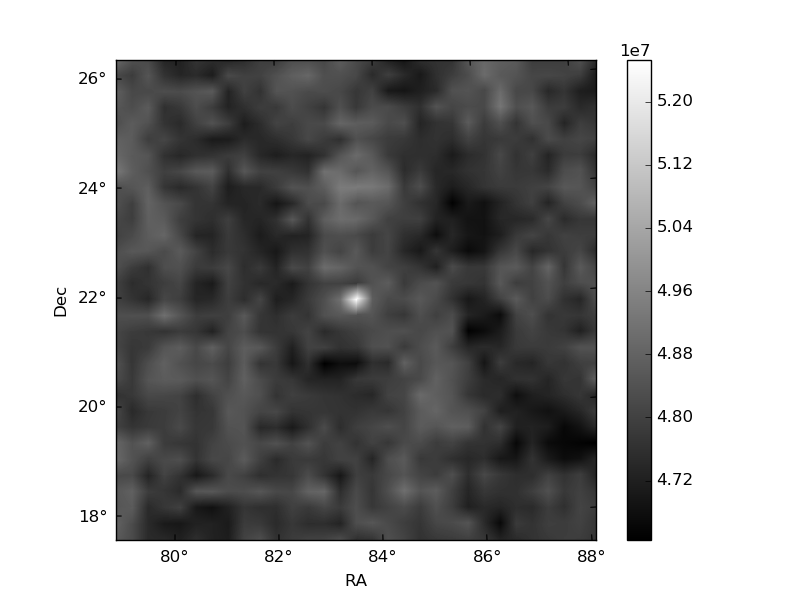
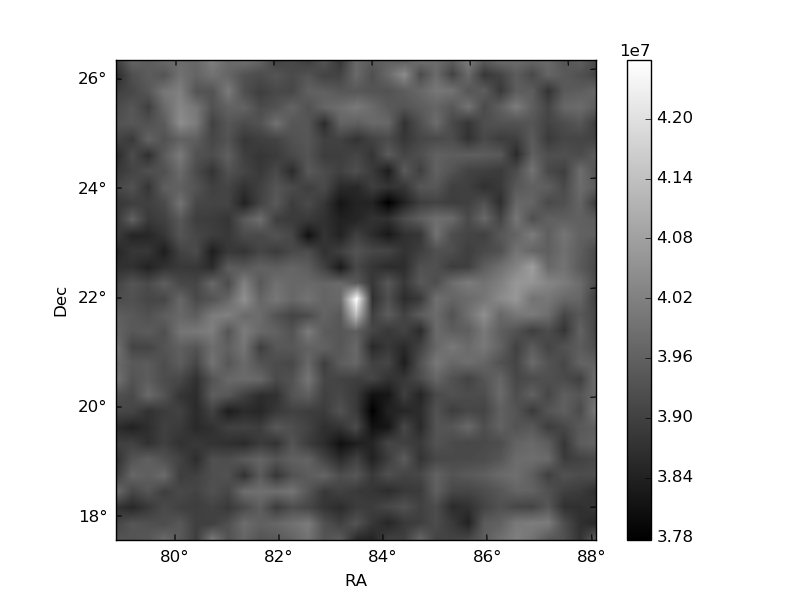
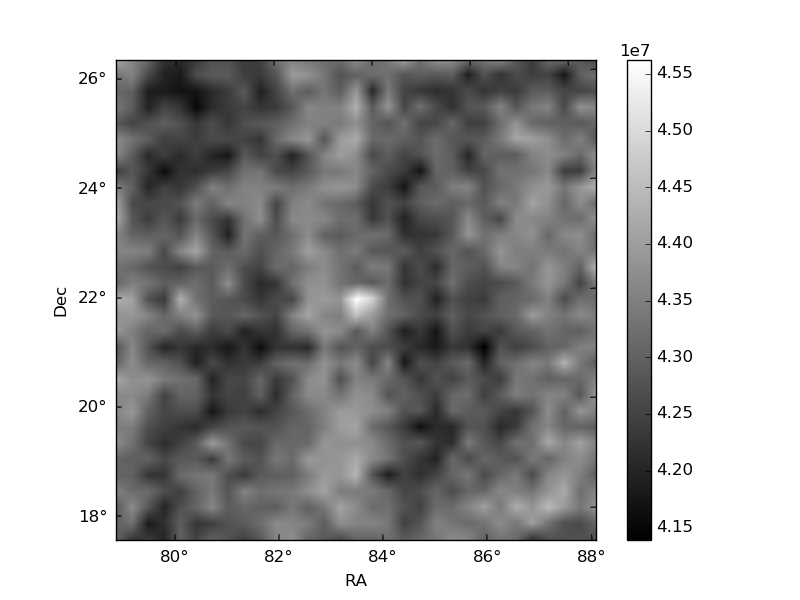
Histogram calculated using DETX and DETY for each event in the final _common_clean file
| Quadrant A | 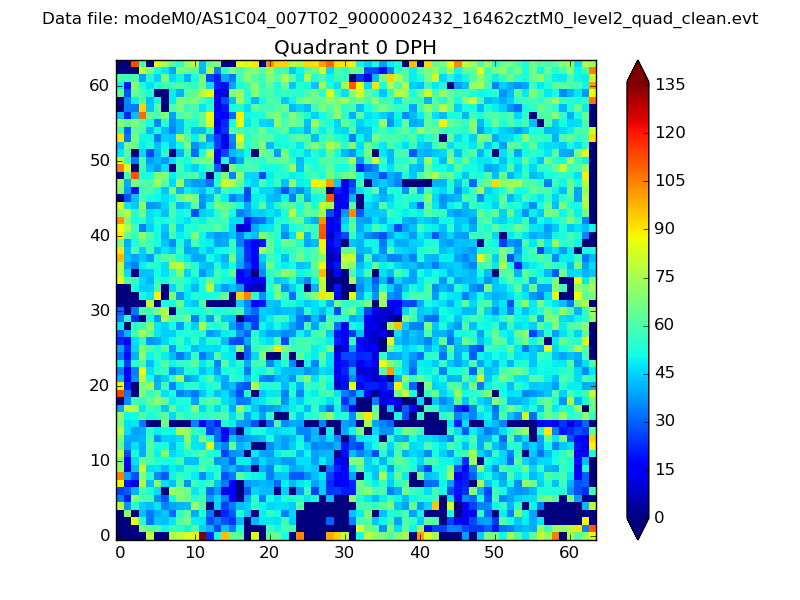 |
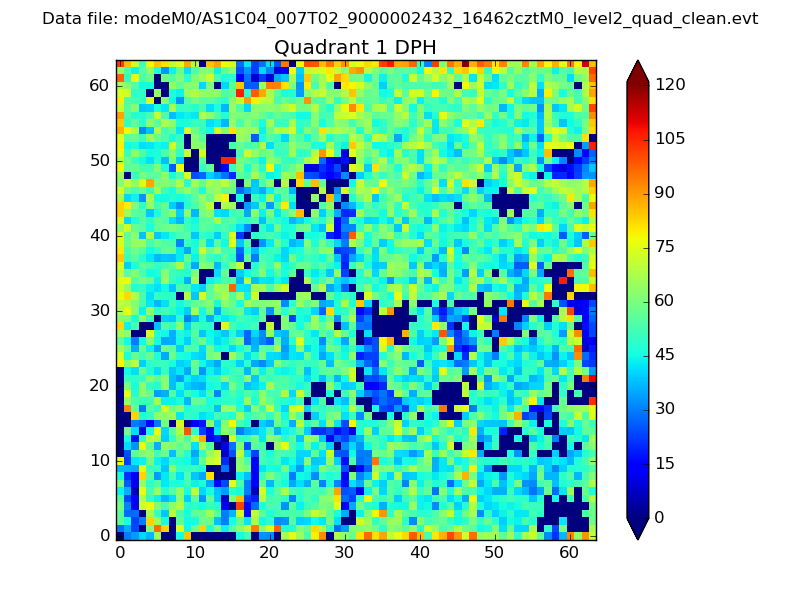 |
Quadrant B |
|---|---|---|---|
| Quadrant D | 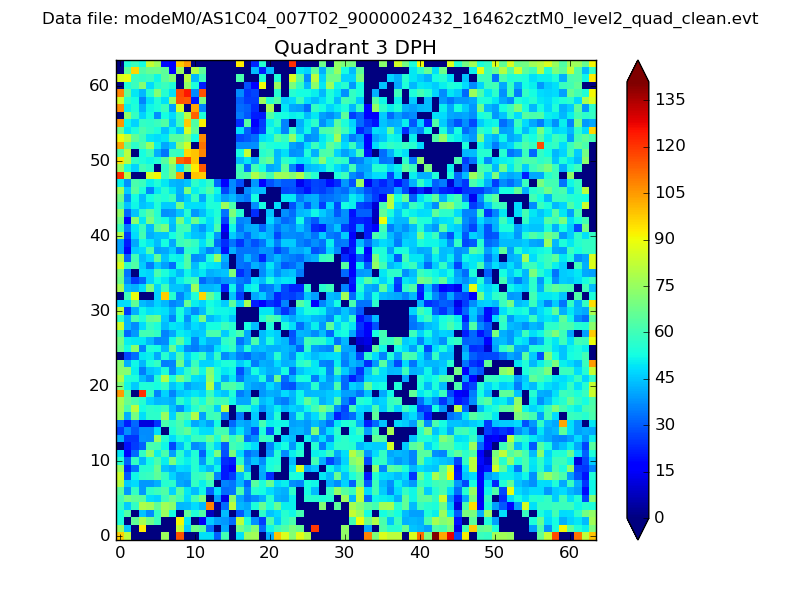 |
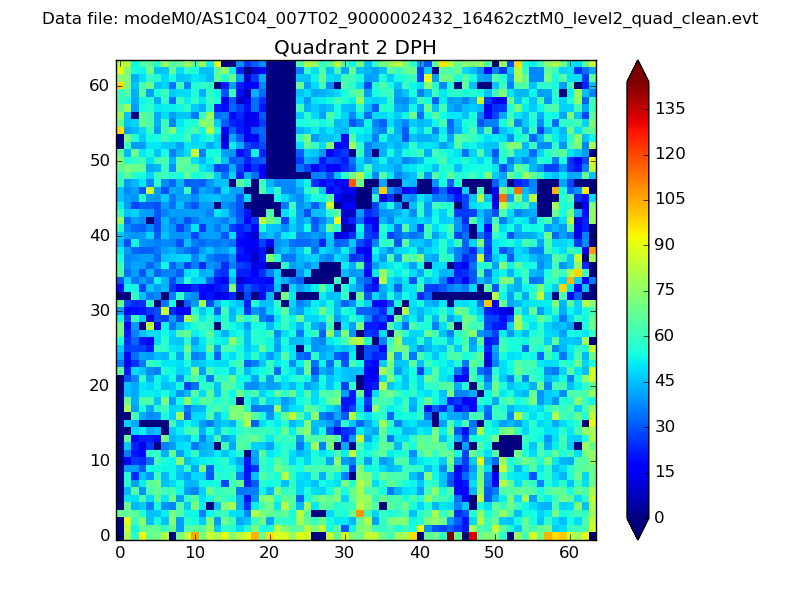 |
Quadrant C |
| Plot type | Count rate plots | Images |
|---|---|---|
| Comparison with Poisson distribution Blue bars denote a histogram of data divided into 1 sec bins. Red curve is a Poisson curve with rate = median count rate of data. |
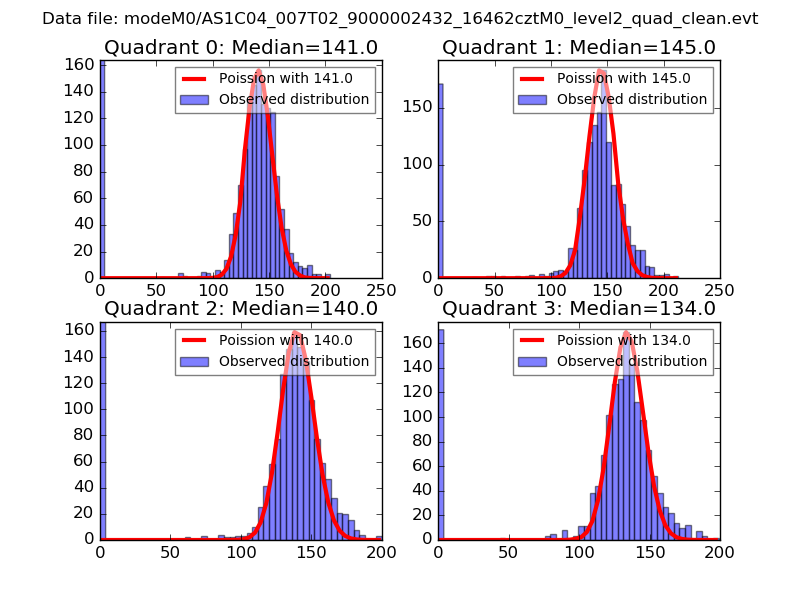 |
 |
| Quadrant-wise count rates Data is divided into 100 sec bins |
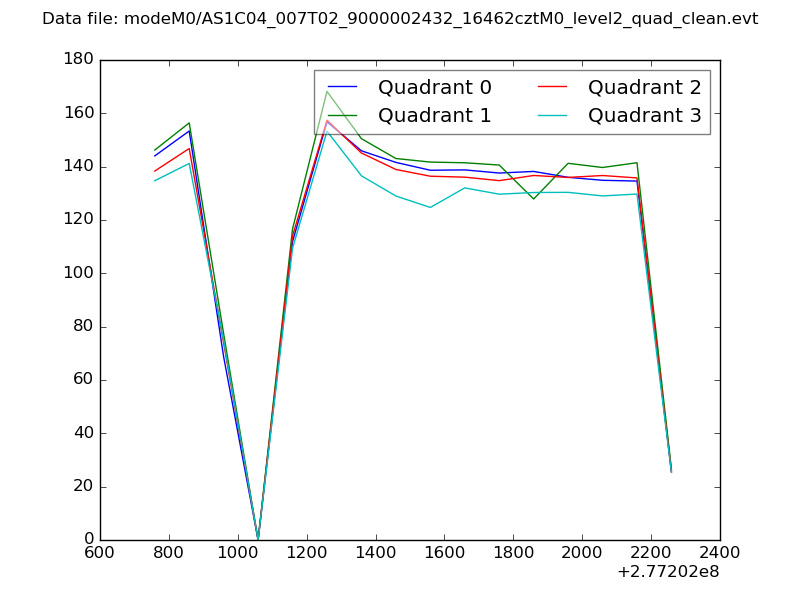 |
|
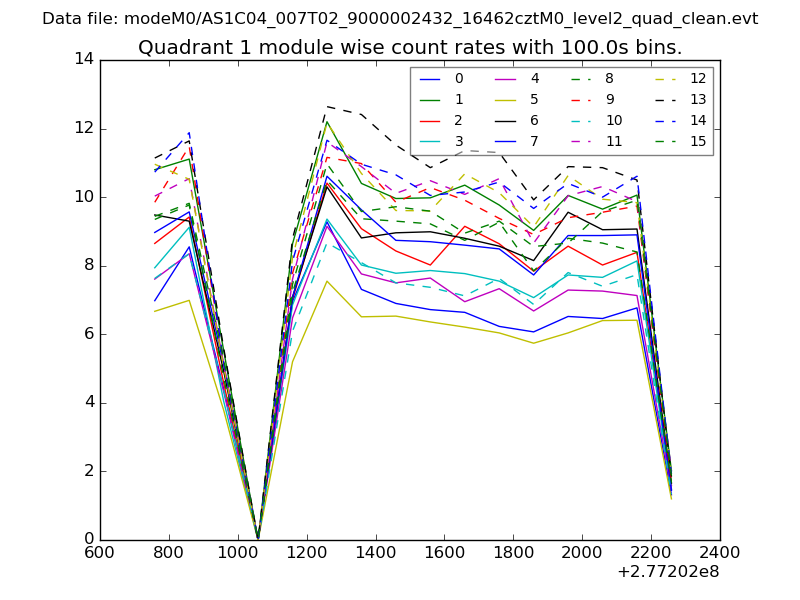
| Module-wise count rates for Quadrant A Data is divided into 100 sec bins |
 |
 |
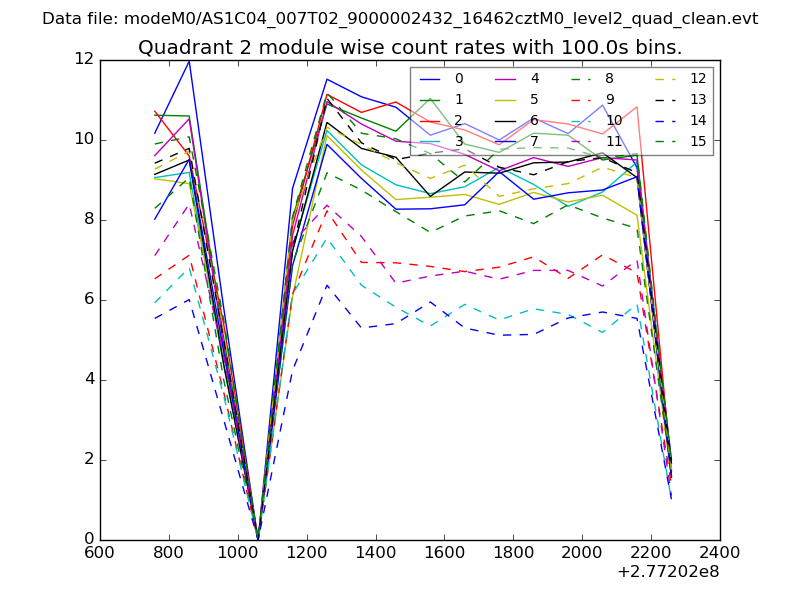
| Module-wise count rates for Quadrant B Data is divided into 100 sec bins |
 |
 |
| Module-wise count rates for Quadrant C Data is divided into 100 sec bins |
 |
 |
| Module-wise count rates for Quadrant D Data is divided into 100 sec bins |
 |
 |
| Parameter | Plot |
|---|---|
| CZT HV Monitor | 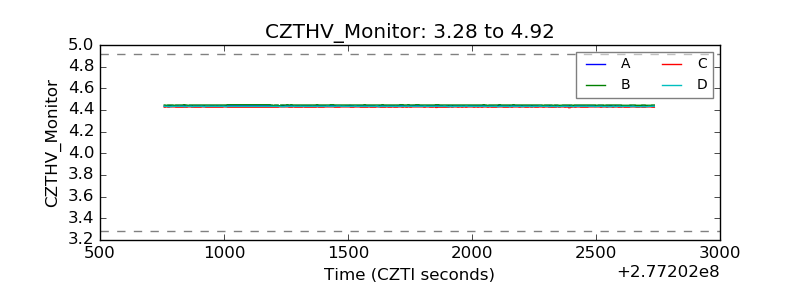 |
| D_VDD | 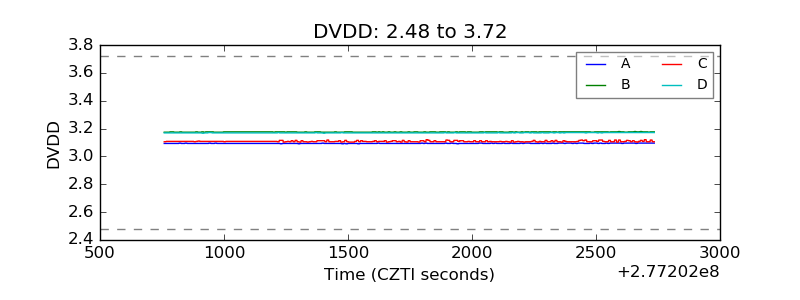 |
| Temperature 1 |  |
| Veto HV Monitor | 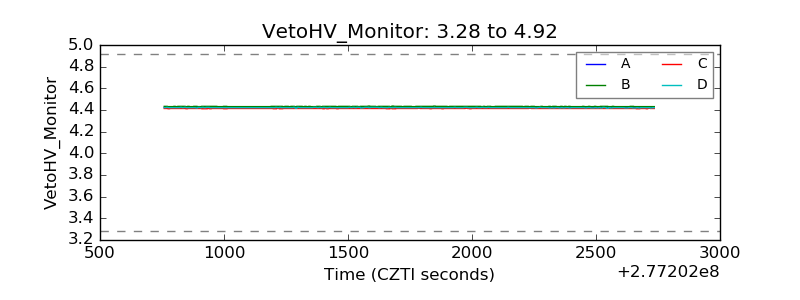 |
| Veto LLD | 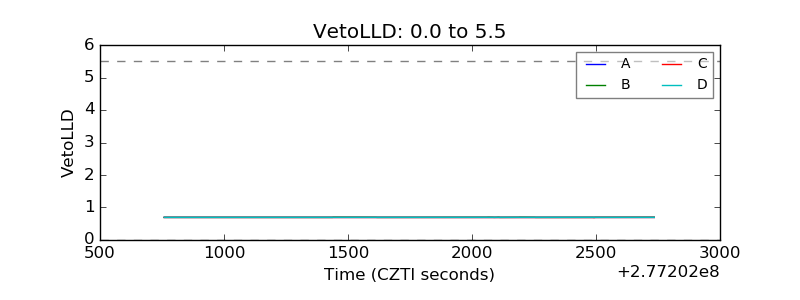 |
| Alpha Counter | 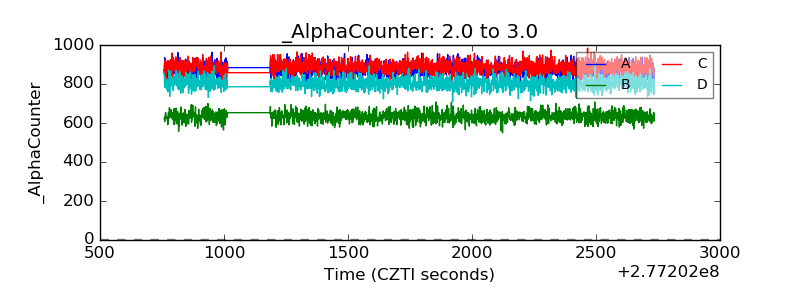 |
| _CPM_Rate | 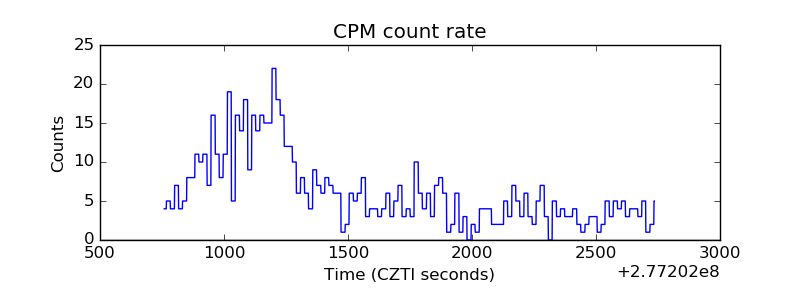 |
| CZT Counter | 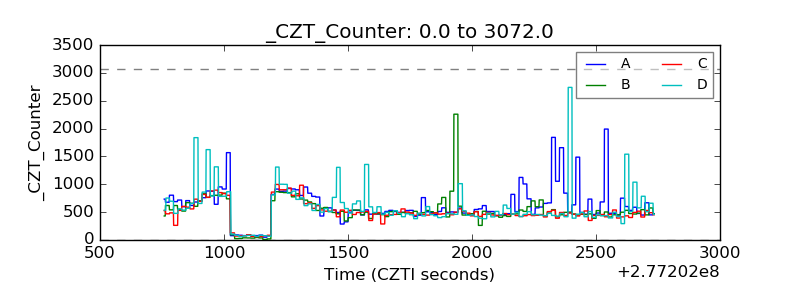 |
| +2.5 Volts monitor |  |
| +5 Volts monitor |  |
| _ROLL_ROT | 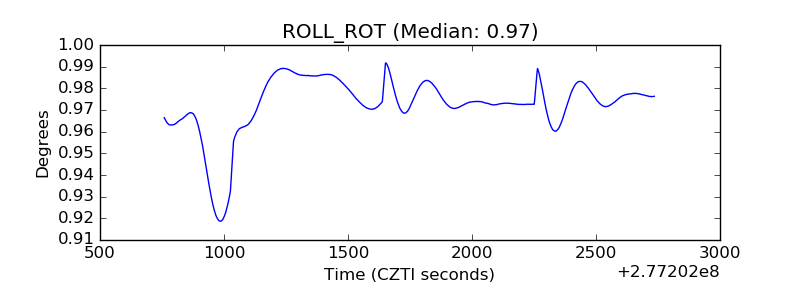 |
| _Roll_DEC | 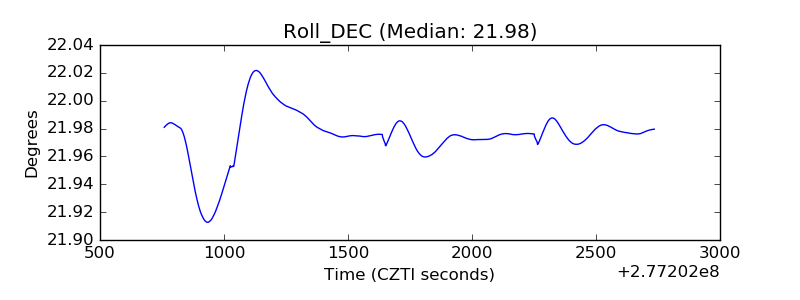 |
| _Roll_RA | 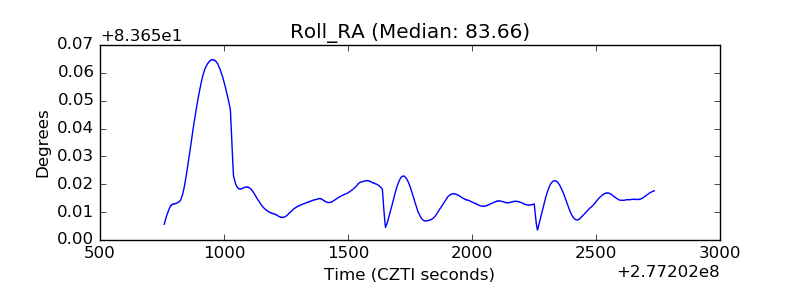 |
| Veto Counter | 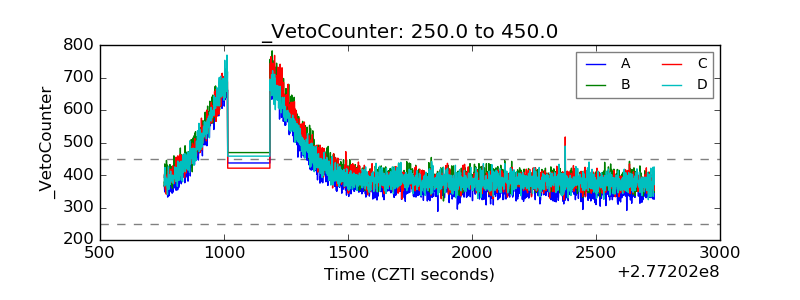 |