| Param | Original file | Final file |
|---|---|---|
| Filename | modeM0/AS1C04_007T02_9000002432_16463cztM0_level2.evt | modeM0/AS1C04_007T02_9000002432_16463cztM0_level2_quad_clean.evt |
| Size (bytes) | 543,335,040 | 89,026,560 |
| Size | 518.2 MB | 84.9 MB |
| Events in quadrant A | 3,841,114 | 556,437 |
| Events in quadrant B | 4,464,909 | 563,785 |
| Events in quadrant C | 3,603,218 | 541,696 |
| Events in quadrant D | 4,052,524 | 527,991 |
| Mode M0 | |||
|---|---|---|---|
| Quadrant | BADHDUFLAG | Total packets | Discarded packets |
| A | 0 | 15953 | 2 |
| B | 0 | 17758 | 1 |
| C | 0 | 15123 | 1 |
| D | 0 | 16836 | 1 |
| Mode SS | |||
|---|---|---|---|
| Quadrant | BADHDUFLAG | Total packets | Discarded packets |
| A | 0 | 148 | 0 |
| B | 0 | 148 | 0 |
| C | 0 | 148 | 0 |
| D | 0 | 148 | 0 |
| Mode M9 | |||
|---|---|---|---|
| Quadrant | BADHDUFLAG | Total packets | Discarded packets |
| A | 0 | 3 | 0 |
| B | 0 | 3 | 0 |
| C | 0 | 3 | 0 |
| D | 0 | 3 | 0 |
| Quadrant | Total seconds | Saturated seconds | Saturation percentage |
|---|---|---|---|
| A | 7266 | 199 | 2.738783% |
| B | 7266 | 231 | 3.179191% |
| C | 7266 | 149 | 2.050647% |
| D | 7266 | 216 | 2.972750% |
Noise dominated data is calculated using 1-second bins in cleaned event files. If a bin has >2000 counts, and if more than 50% of those come from <1% of pixels, then it is considered to be noise-dominated and hence unusable.
| Quadrant | # 1 sec bins | Bins with >0 counts | Bins with >2000 counts | High rate bins dominated by noise | Noise dominated (total time) | Noise dominated (detector-on time) | Marked lightcurve |
|---|---|---|---|---|---|---|---|
| A | 7602 | 7267 | 56 | 56 | 0.74% | 0.77% |  |
| B | 7602 | 7267 | 51 | 51 | 0.67% | 0.70% |  |
| C | 7602 | 7267 | 1 | 1 | 0.01% | 0.01% |  |
| D | 7602 | 7267 | 98 | 98 | 1.29% | 1.35% |  |
Top three noisy pixels from each quadrant. If the there are fewer than three noisy pixels in the level2.evt file, extra rows are filled as -1
| Pixel properties | Quadrant properties | ||||||
|---|---|---|---|---|---|---|---|
| Quadrant | DetID | PixID | Counts | Sigma | Mean | Median | Sigma |
| A | 15 | 174 | 394452 | 2152.23 | 895 | 880 | 182.9 |
| A | 13 | 248 | 8162 | 39.82 | 895 | 880 | 182.9 |
| A | 0 | 226 | 7701 | 37.3 | 895 | 880 | 182.9 |
| B | 15 | 35 | 648967 | 3677.56 | 892 | 869 | 176.2 |
| B | 4 | 173 | 111903 | 630.05 | 892 | 869 | 176.2 |
| B | 0 | 198 | 57757 | 322.8 | 892 | 869 | 176.2 |
| C | 14 | 238 | 130536 | 641.1 | 854 | 862 | 202.3 |
| C | 3 | 233 | 106976 | 524.62 | 854 | 862 | 202.3 |
| C | 0 | 207 | 19951 | 94.37 | 854 | 862 | 202.3 |
| D | 2 | 33 | 297501 | 1388.73 | 863 | 837 | 213.6 |
| D | 1 | 52 | 267577 | 1248.65 | 863 | 837 | 213.6 |
| D | 5 | 222 | 148559 | 691.51 | 863 | 837 | 213.6 |
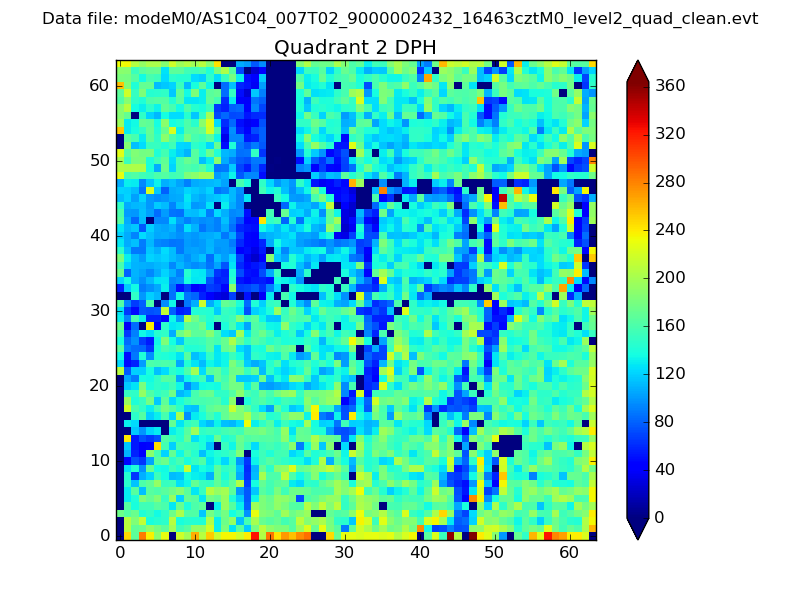
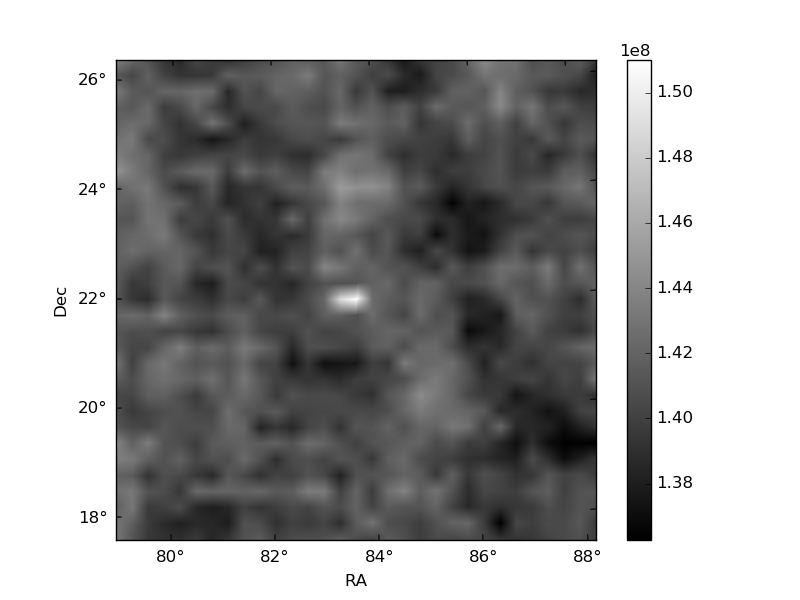
Histogram calculated using DETX and DETY for each event in the final _common_clean file
| Quadrant A | 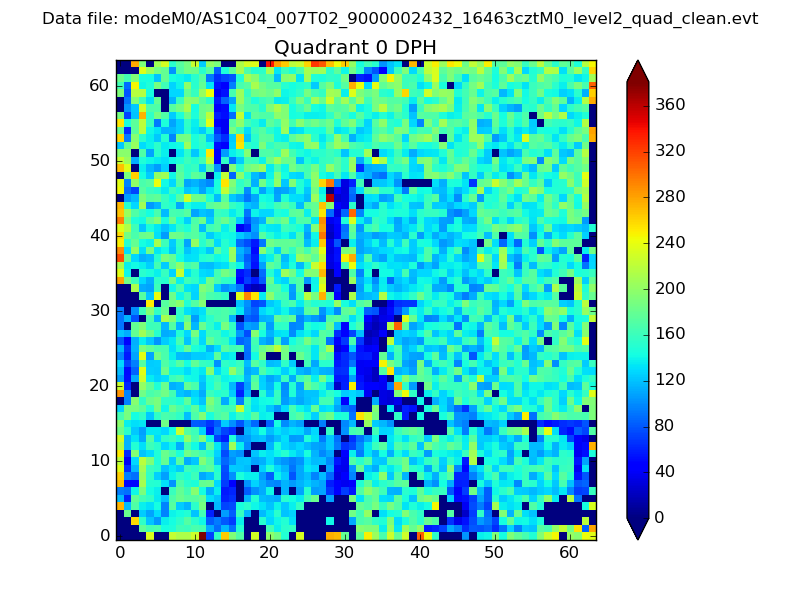 |
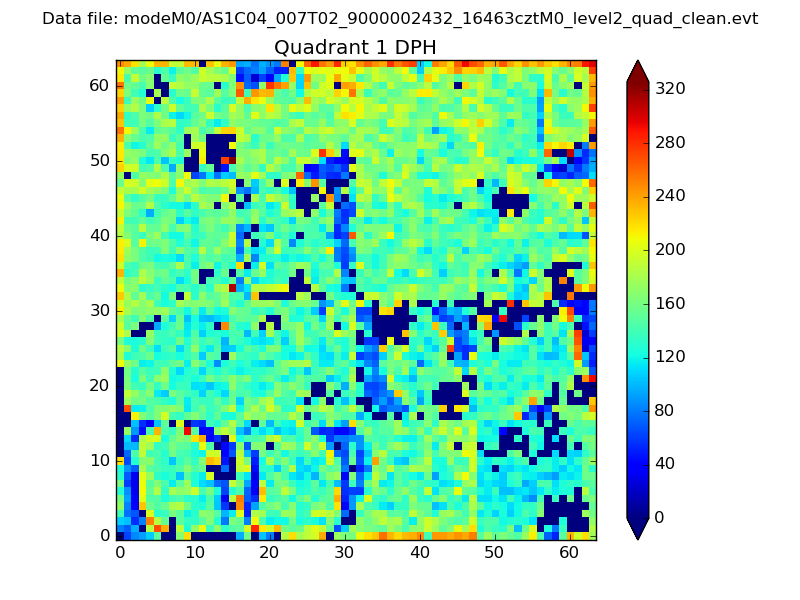 |
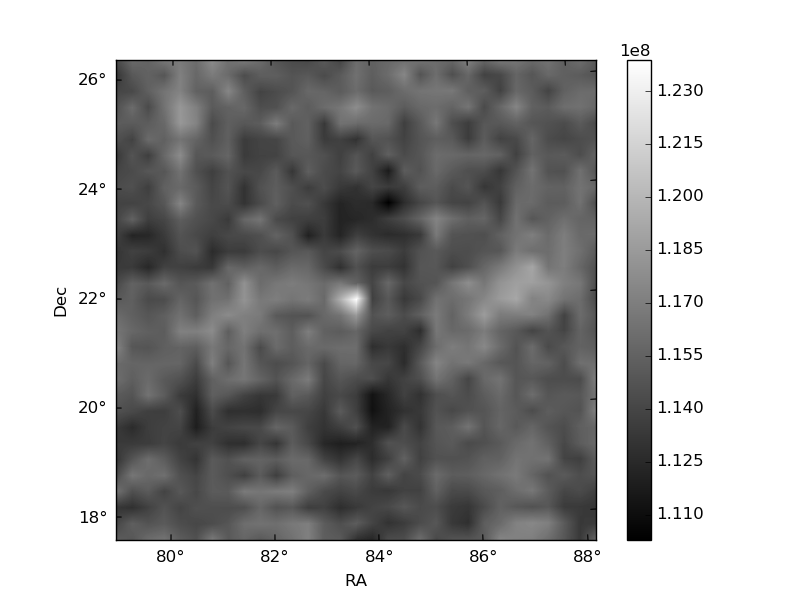
Quadrant B |
|---|---|---|---|
| Quadrant D | 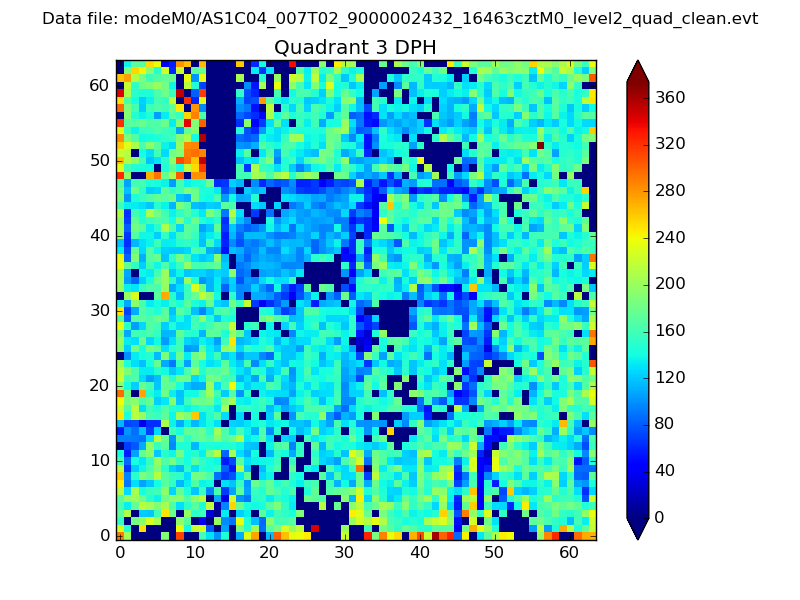 |
 |
Quadrant C |
| Plot type | Count rate plots | Images |
|---|---|---|
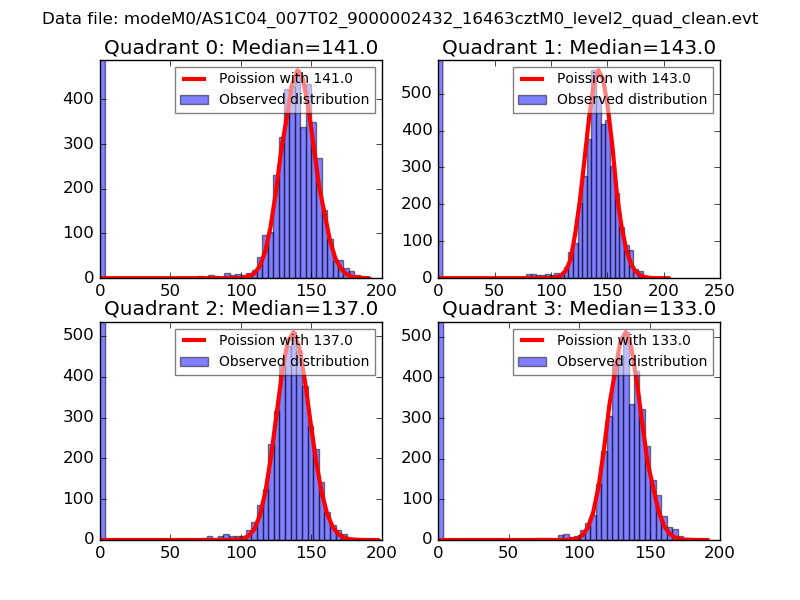
| Comparison with Poisson distribution Blue bars denote a histogram of data divided into 1 sec bins. Red curve is a Poisson curve with rate = median count rate of data. |
 |
 |
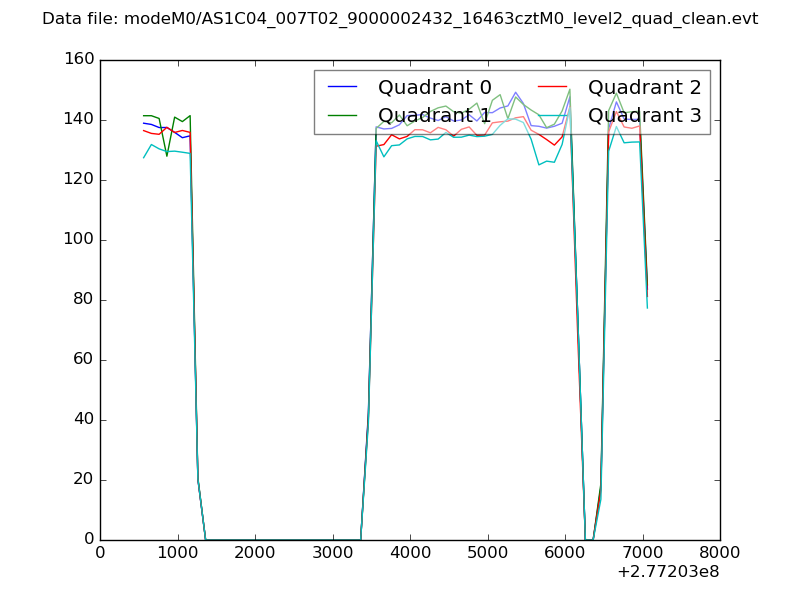
| Quadrant-wise count rates Data is divided into 100 sec bins |
 |
|
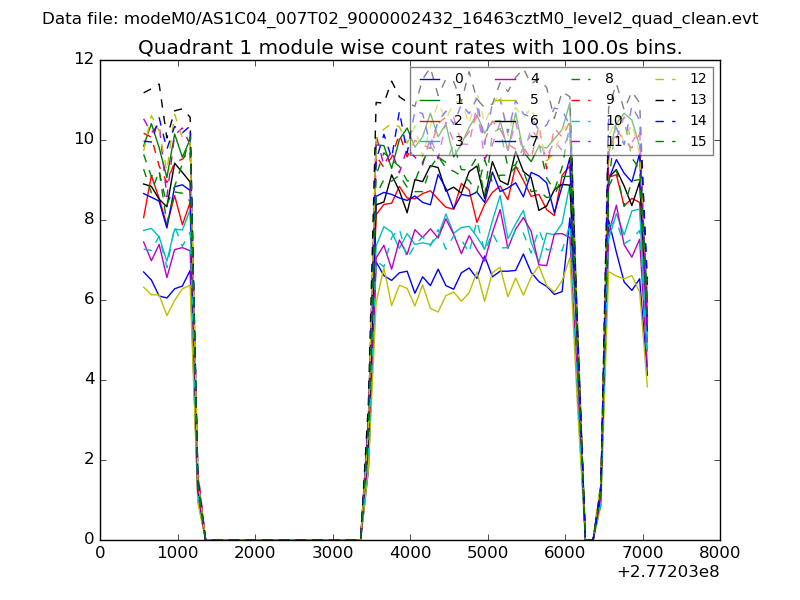
| Module-wise count rates for Quadrant A Data is divided into 100 sec bins |
 |
 |
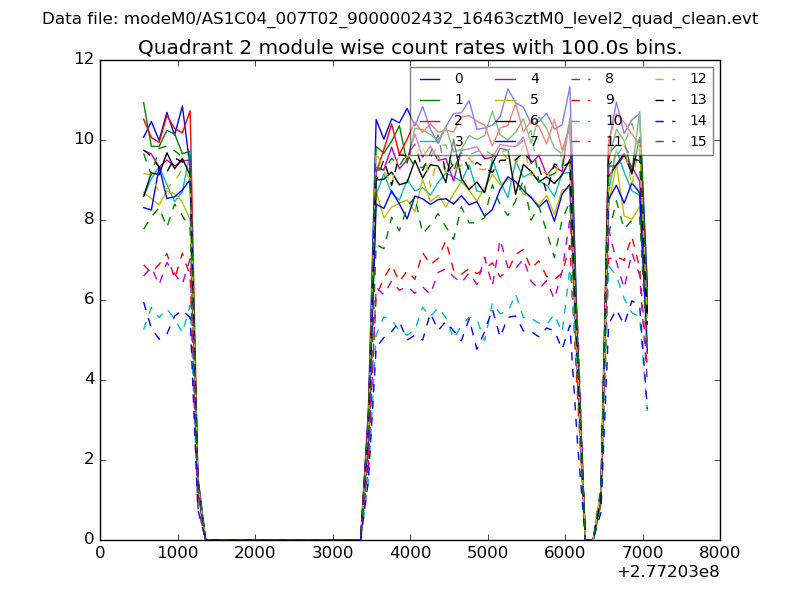
| Module-wise count rates for Quadrant B Data is divided into 100 sec bins |
 |
 |
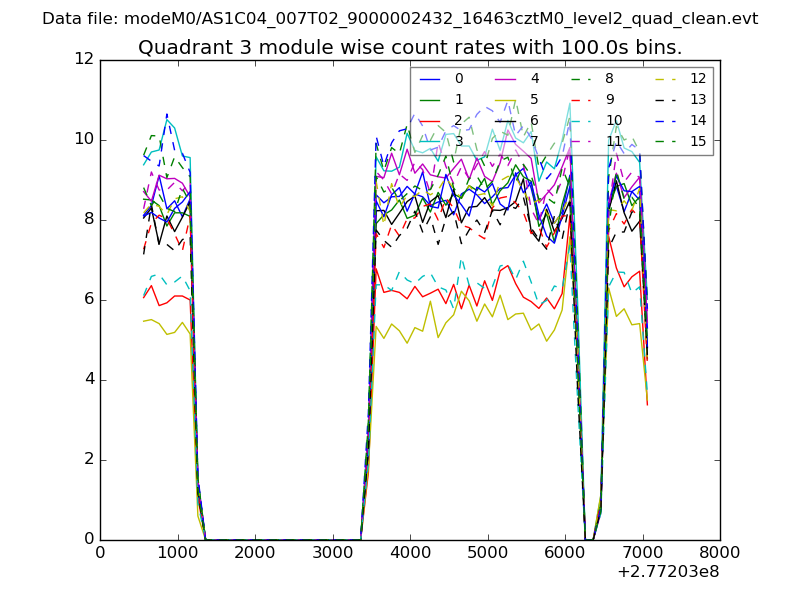
| Module-wise count rates for Quadrant C Data is divided into 100 sec bins |
 |
 |
| Module-wise count rates for Quadrant D Data is divided into 100 sec bins |
 |
 |
| Parameter | Plot |
|---|---|
| CZT HV Monitor | 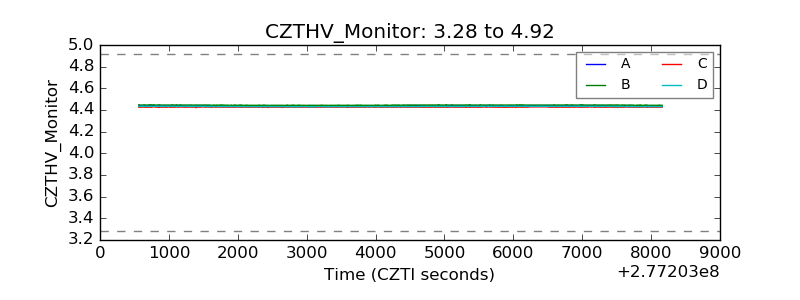 |
| D_VDD | 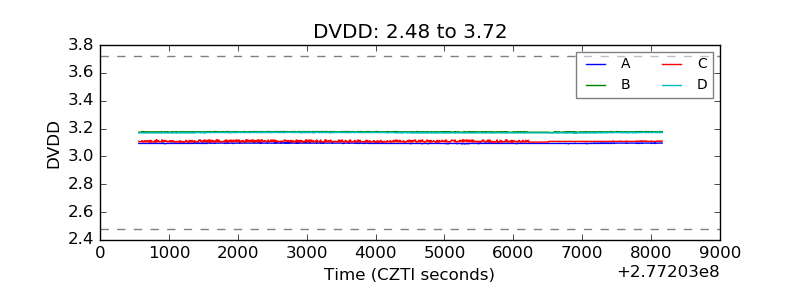 |
| Temperature 1 |  |
| Veto HV Monitor | 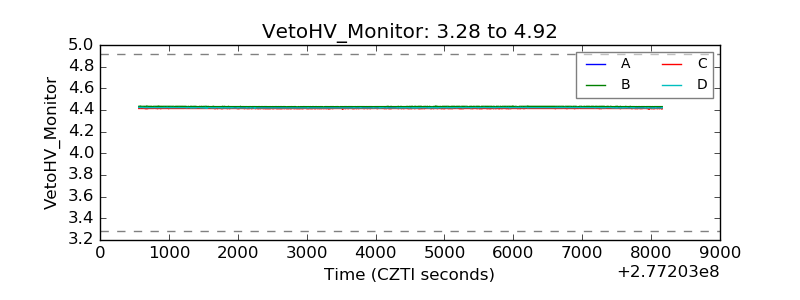 |
| Veto LLD | 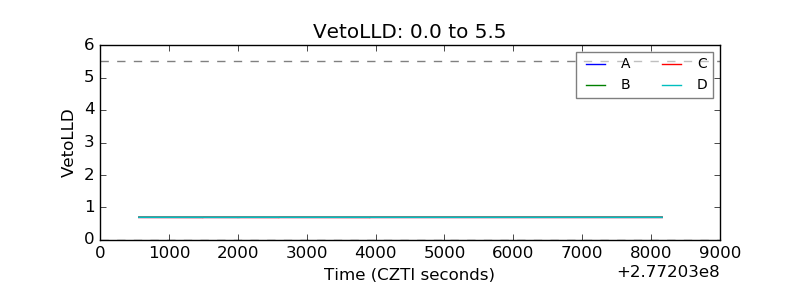 |
| Alpha Counter | 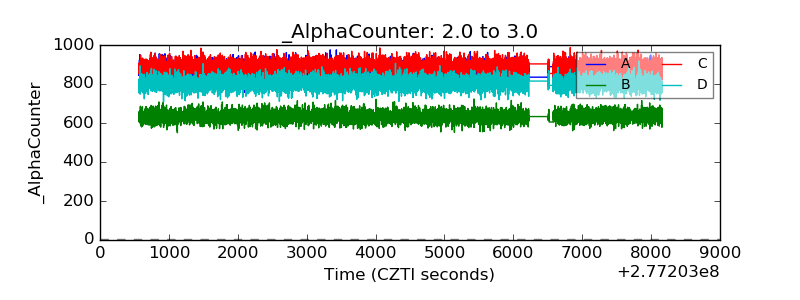 |
| _CPM_Rate | 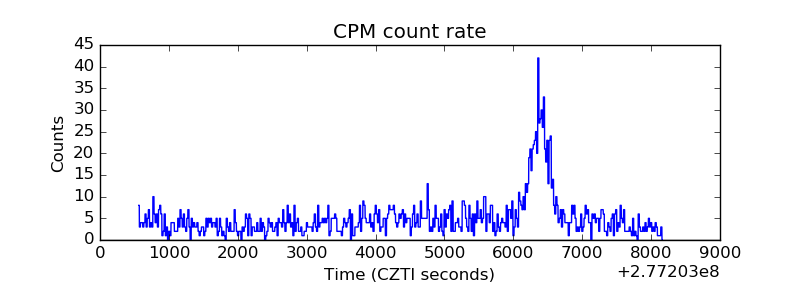 |
| CZT Counter | 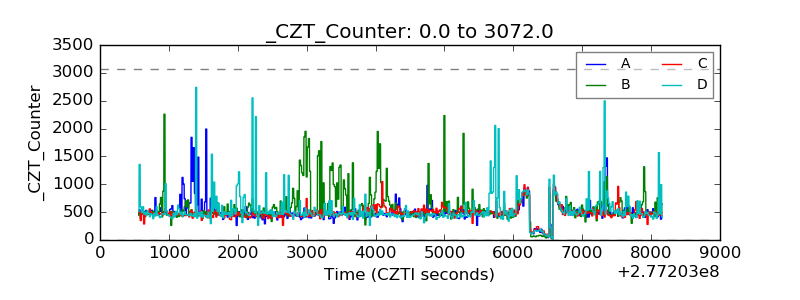 |
| +2.5 Volts monitor |  |
| +5 Volts monitor |  |
| _ROLL_ROT | 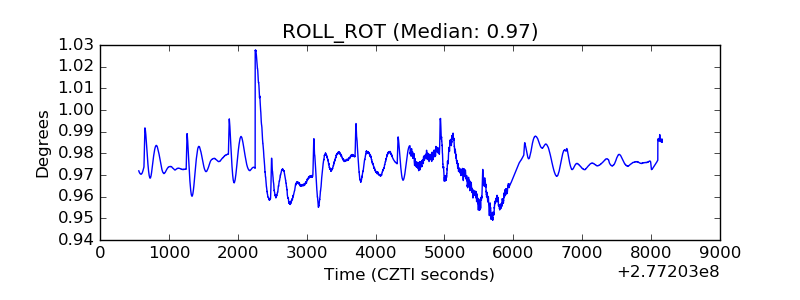 |
| _Roll_DEC | 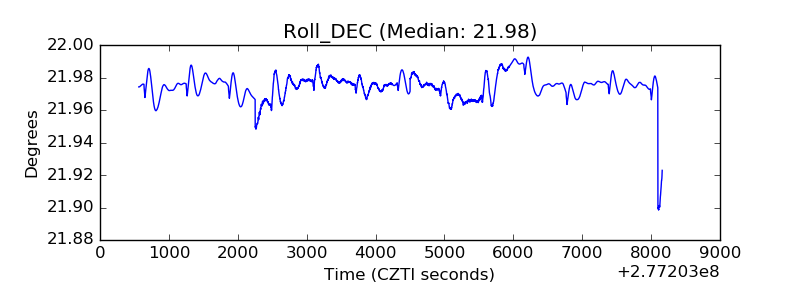 |
| _Roll_RA | 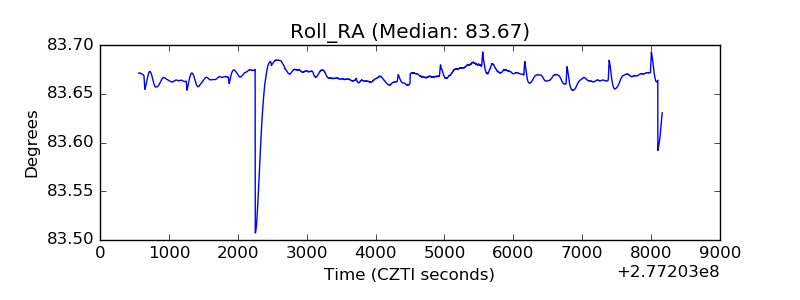 |
| Veto Counter | 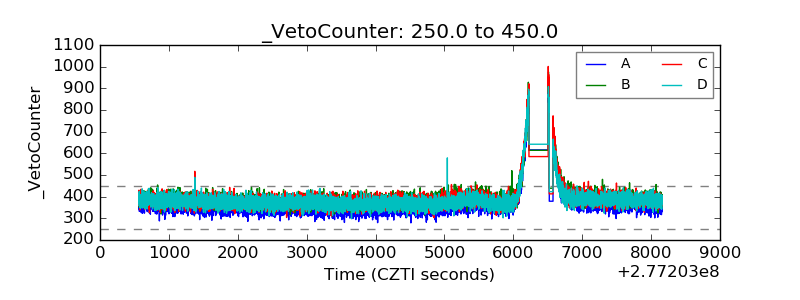 |