| Param | Original file | Final file |
|---|---|---|
| Filename | modeM0/AS1C04_007T02_9000002432_16465cztM0_level2.evt | modeM0/AS1C04_007T02_9000002432_16465cztM0_level2_quad_clean.evt |
| Size (bytes) | 235,935,360 | 33,949,440 |
| Size | 225.0 MB | 32.4 MB |
| Events in quadrant A | 1,646,729 | 198,838 |
| Events in quadrant B | 1,871,193 | 199,365 |
| Events in quadrant C | 1,721,101 | 191,119 |
| Events in quadrant D | 1,665,535 | 188,979 |
| Mode M0 | |||
|---|---|---|---|
| Quadrant | BADHDUFLAG | Total packets | Discarded packets |
| A | 0 | 7228 | 0 |
| B | 0 | 7730 | 0 |
| C | 0 | 7231 | 0 |
| D | 0 | 7424 | 0 |
| Mode SS | |||
|---|---|---|---|
| Quadrant | BADHDUFLAG | Total packets | Discarded packets |
| A | 0 | 70 | 0 |
| B | 0 | 70 | 0 |
| C | 0 | 70 | 0 |
| D | 0 | 70 | 0 |
| Quadrant | Total seconds | Saturated seconds | Saturation percentage |
|---|---|---|---|
| A | 3517 | 15 | 0.426500% |
| B | 3517 | 11 | 0.312767% |
| C | 3517 | 11 | 0.312767% |
| D | 3517 | 16 | 0.454933% |
Noise dominated data is calculated using 1-second bins in cleaned event files. If a bin has >2000 counts, and if more than 50% of those come from <1% of pixels, then it is considered to be noise-dominated and hence unusable.
| Quadrant | # 1 sec bins | Bins with >0 counts | Bins with >2000 counts | High rate bins dominated by noise | Noise dominated (total time) | Noise dominated (detector-on time) | Marked lightcurve |
|---|---|---|---|---|---|---|---|
| A | 3518 | 3518 | 3 | 3 | 0.09% | 0.09% | 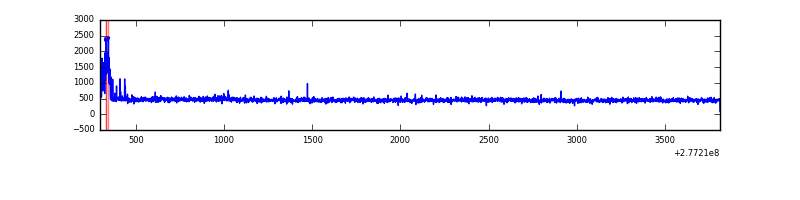 |
| B | 3518 | 3518 | 2 | 2 | 0.06% | 0.06% | 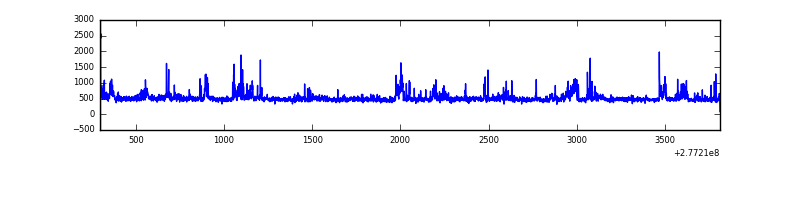 |
| C | 3518 | 3518 | 1 | 1 | 0.03% | 0.03% | 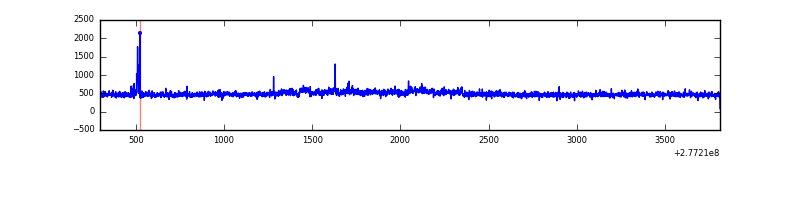 |
| D | 3518 | 3518 | 12 | 12 | 0.34% | 0.34% | 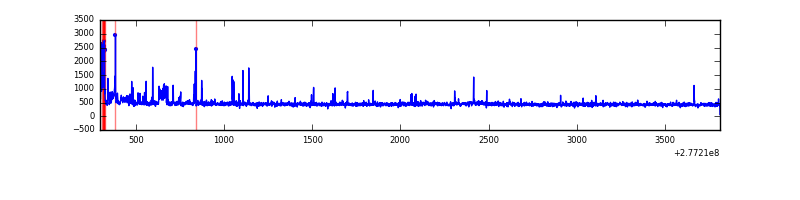 |
Top three noisy pixels from each quadrant. If the there are fewer than three noisy pixels in the level2.evt file, extra rows are filled as -1
| Pixel properties | Quadrant properties | ||||||
|---|---|---|---|---|---|---|---|
| Quadrant | DetID | PixID | Counts | Sigma | Mean | Median | Sigma |
| A | 15 | 174 | 62957 | 732.81 | 412 | 403 | 85.4 |
| A | 0 | 226 | 3633 | 37.84 | 412 | 403 | 85.4 |
| A | 12 | 194 | 3087 | 31.44 | 412 | 403 | 85.4 |
| B | 15 | 35 | 152921 | 1892.89 | 412 | 403 | 80.6 |
| B | 0 | 198 | 33036 | 405.0 | 412 | 403 | 80.6 |
| B | 4 | 48 | 28026 | 342.83 | 412 | 403 | 80.6 |
| C | 3 | 233 | 96087 | 1007.92 | 396 | 400 | 94.9 |
| C | 14 | 238 | 59809 | 625.79 | 396 | 400 | 94.9 |
| C | 0 | 207 | 17257 | 177.56 | 396 | 400 | 94.9 |
| D | 2 | 33 | 70064 | 686.77 | 402 | 389 | 101.5 |
| D | 5 | 222 | 31342 | 305.1 | 402 | 389 | 101.5 |
| D | 1 | 52 | 24383 | 236.5 | 402 | 389 | 101.5 |
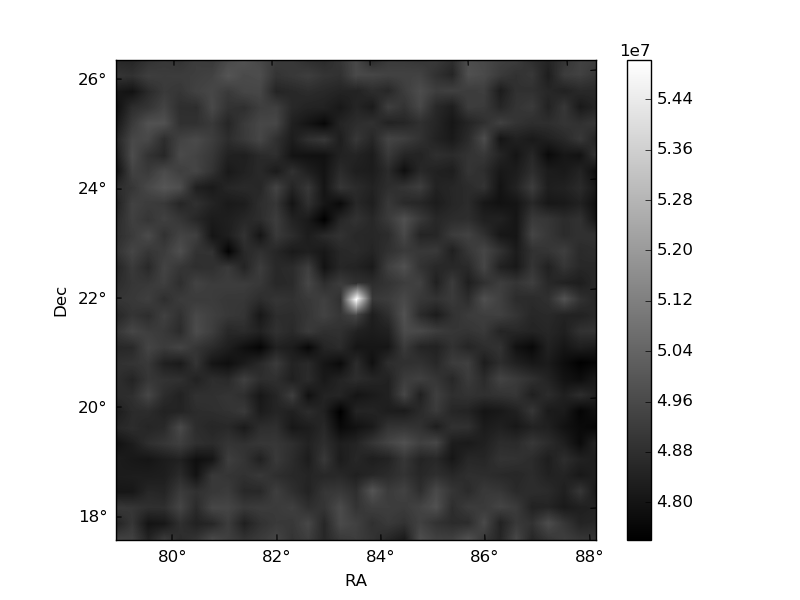
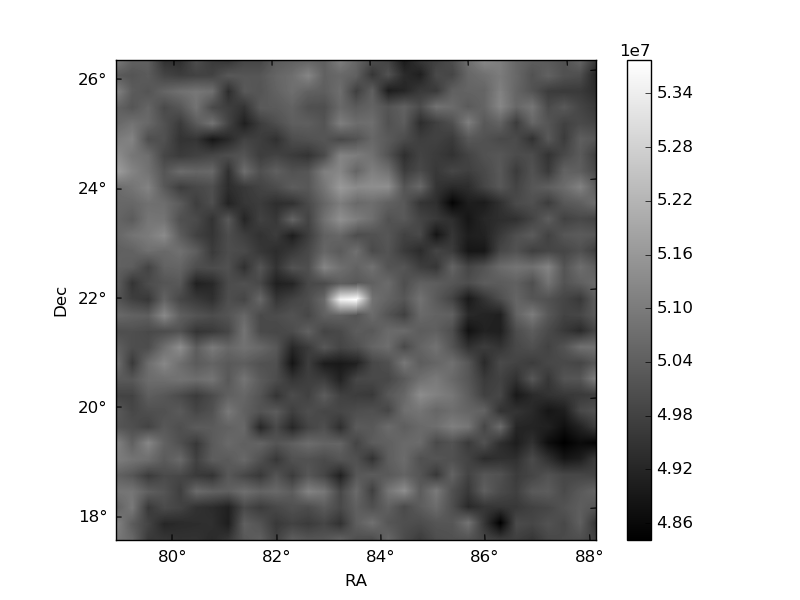
Histogram calculated using DETX and DETY for each event in the final _common_clean file
| Quadrant A |  |
 |
Quadrant B |
|---|---|---|---|
| Quadrant D |  |
 |
Quadrant C |
| Plot type | Count rate plots | Images |
|---|---|---|
| Comparison with Poisson distribution Blue bars denote a histogram of data divided into 1 sec bins. Red curve is a Poisson curve with rate = median count rate of data. |
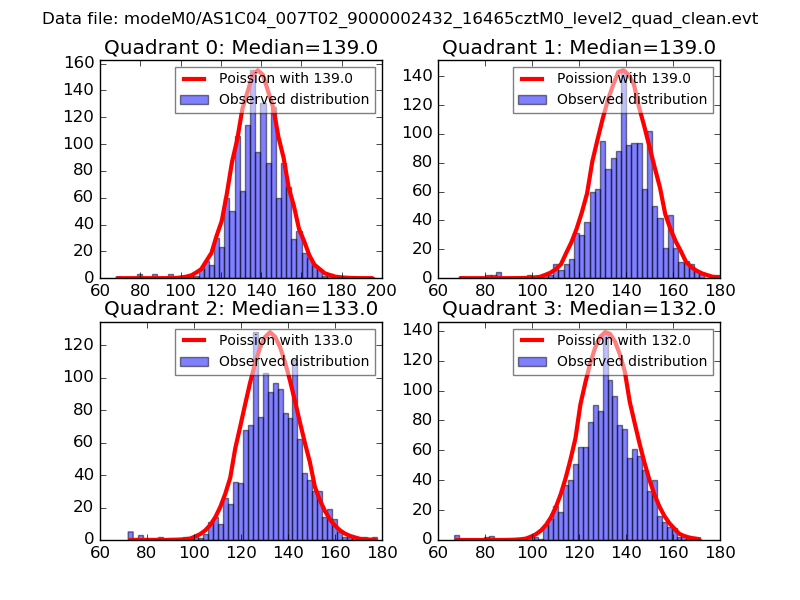 |
 |
| Quadrant-wise count rates Data is divided into 100 sec bins |
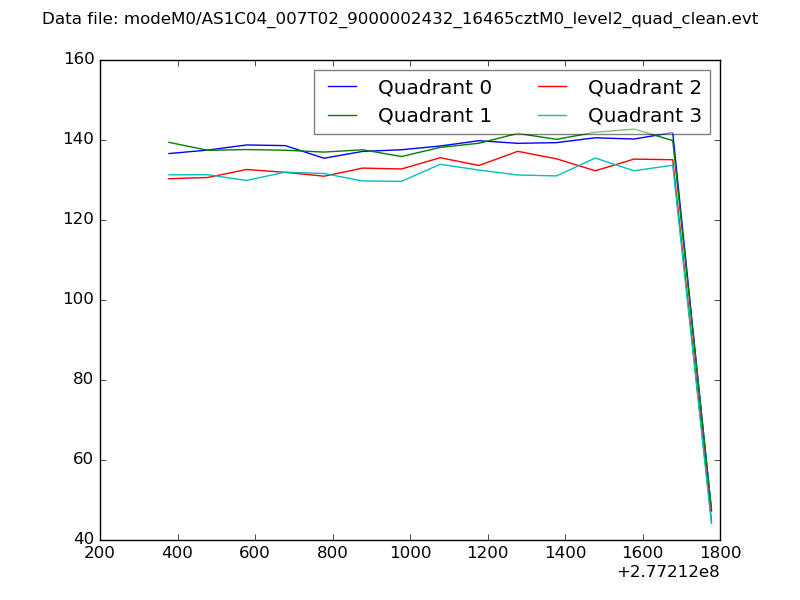 |
|
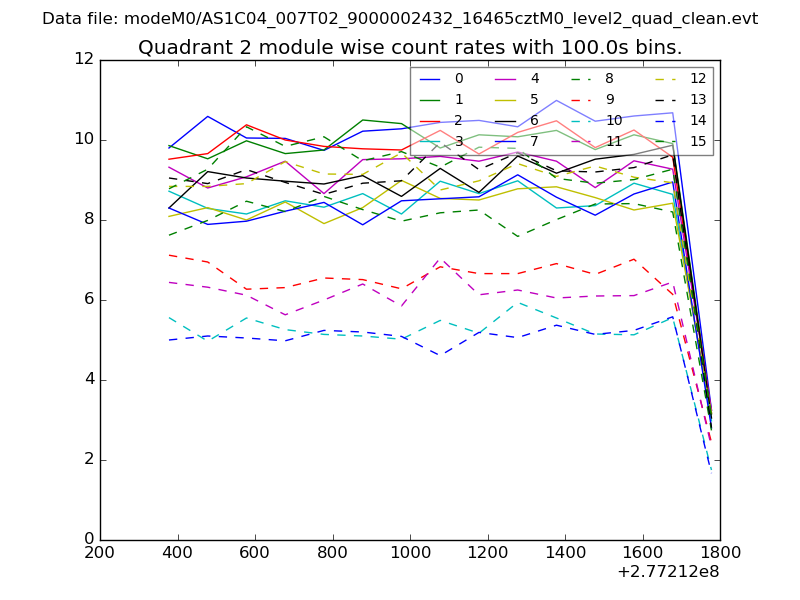
| Module-wise count rates for Quadrant A Data is divided into 100 sec bins |
 |
 |
| Module-wise count rates for Quadrant B Data is divided into 100 sec bins |
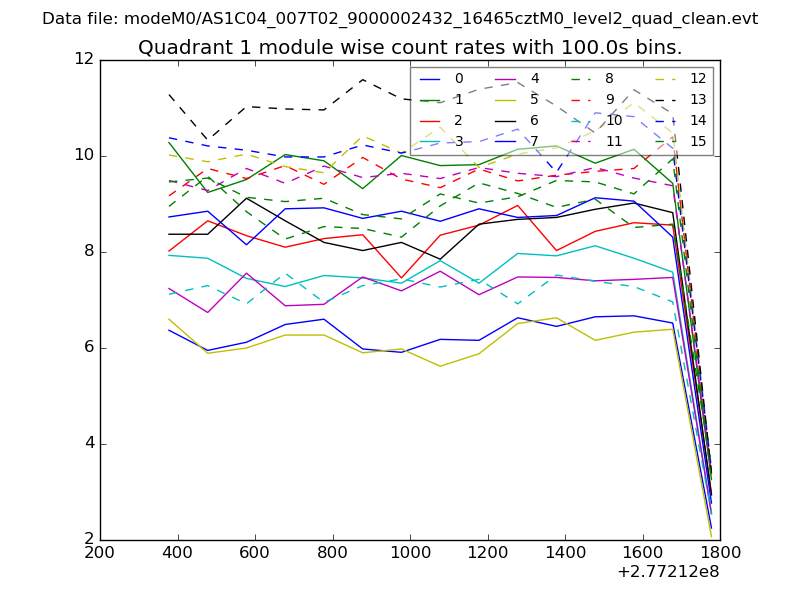 |
 |
| Module-wise count rates for Quadrant C Data is divided into 100 sec bins |
 |
 |
| Module-wise count rates for Quadrant D Data is divided into 100 sec bins |
 |
 |
| Parameter | Plot |
|---|---|
| CZT HV Monitor | 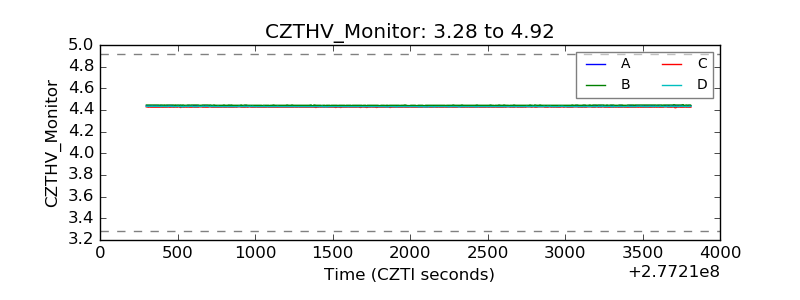 |
| D_VDD |  |
| Temperature 1 |  |
| Veto HV Monitor |  |
| Veto LLD |  |
| Alpha Counter | 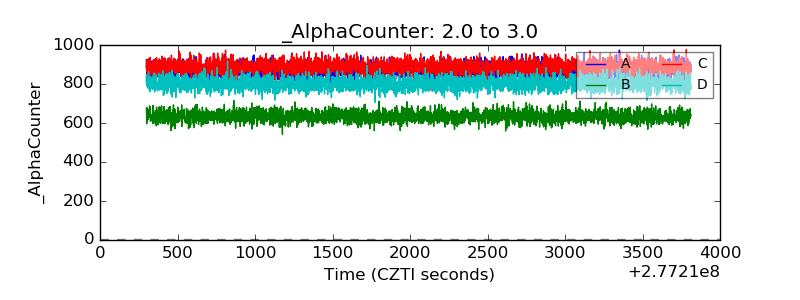 |
| _CPM_Rate | 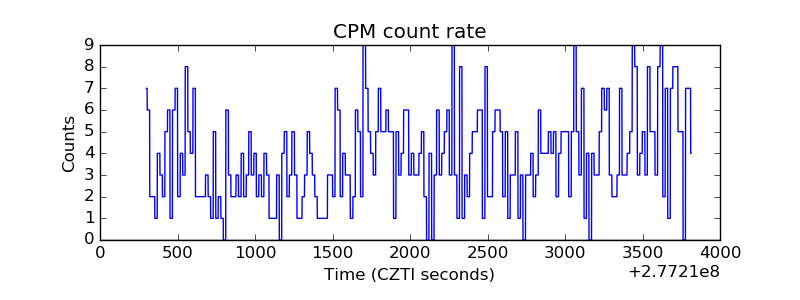 |
| CZT Counter |  |
| +2.5 Volts monitor |  |
| +5 Volts monitor |  |
| _ROLL_ROT |  |
| _Roll_DEC |  |
| _Roll_RA |  |
| Veto Counter |  |