| Param | Original file | Final file |
|---|---|---|
| Filename | modeM0/AS1C04_007T03_9000002436_16471cztM0_level2.evt | modeM0/AS1C04_007T03_9000002436_16471cztM0_level2_quad_clean.evt |
| Size (bytes) | 5,751,360 | 2,056,320 |
| Size | 5.5 MB | 2.0 MB |
| Events in quadrant A | 37,968 | 12,015 |
| Events in quadrant B | 40,816 | 12,542 |
| Events in quadrant C | 40,701 | 11,669 |
| Events in quadrant D | 45,240 | 11,189 |
| Mode M0 | |||
|---|---|---|---|
| Quadrant | BADHDUFLAG | Total packets | Discarded packets |
| A | 0 | 160 | 1 |
| B | 0 | 163 | 0 |
| C | 0 | 167 | 0 |
| D | 0 | 182 | 0 |
| Mode SS | |||
|---|---|---|---|
| Quadrant | BADHDUFLAG | Total packets | Discarded packets |
| A | 0 | 2 | 0 |
| B | 0 | 2 | 0 |
| C | 0 | 2 | 0 |
| D | 0 | 2 | 0 |
| Quadrant | Total seconds | Saturated seconds | Saturation percentage |
|---|---|---|---|
| A | 79 | 0 | 0.000000% |
| B | 79 | 0 | 0.000000% |
| C | 79 | 0 | 0.000000% |
| D | 79 | 2 | 2.531646% |
Noise dominated data is calculated using 1-second bins in cleaned event files. If a bin has >2000 counts, and if more than 50% of those come from <1% of pixels, then it is considered to be noise-dominated and hence unusable.
| Quadrant | # 1 sec bins | Bins with >0 counts | Bins with >2000 counts | High rate bins dominated by noise | Noise dominated (total time) | Noise dominated (detector-on time) | Marked lightcurve |
|---|---|---|---|---|---|---|---|
| A | 80 | 80 | 0 | 0 | 0.00% | 0.00% | 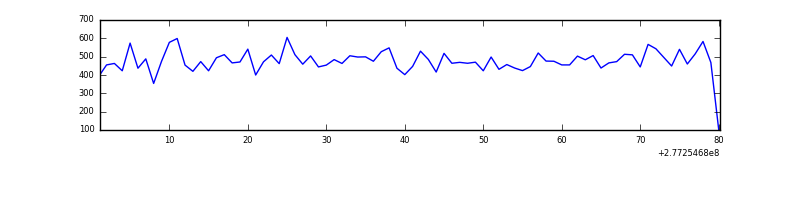 |
| B | 80 | 80 | 0 | 0 | 0.00% | 0.00% | 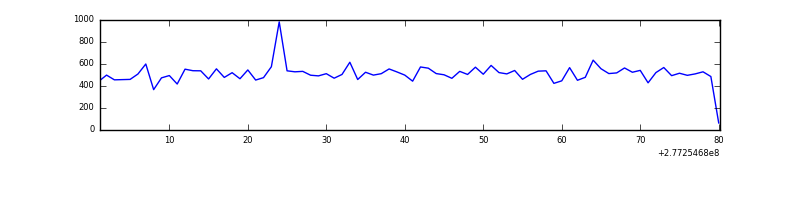 |
| C | 80 | 80 | 0 | 0 | 0.00% | 0.00% | 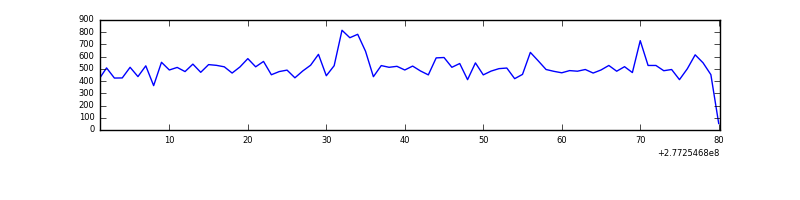 |
| D | 80 | 80 | 3 | 3 | 3.75% | 3.75% | 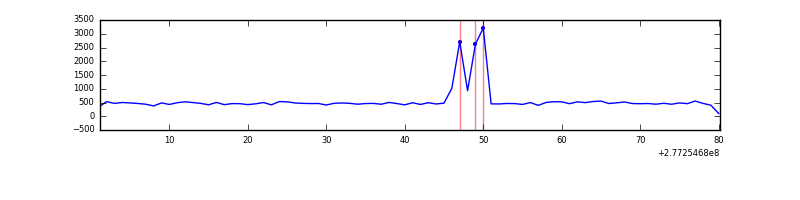 |
Top three noisy pixels from each quadrant. If the there are fewer than three noisy pixels in the level2.evt file, extra rows are filled as -1
| Pixel properties | Quadrant properties | ||||||
|---|---|---|---|---|---|---|---|
| Quadrant | DetID | PixID | Counts | Sigma | Mean | Median | Sigma |
| A | 15 | 174 | 146 | 35.87 | 9 | 9 | 3.8 |
| A | 12 | 194 | 74 | 17.02 | 9 | 9 | 3.8 |
| A | 3 | 137 | 74 | 17.02 | 9 | 9 | 3.8 |
| B | 4 | 48 | 647 | 172.71 | 10 | 9 | 3.7 |
| B | 0 | 214 | 541 | 144.02 | 10 | 9 | 3.7 |
| B | 3 | 209 | 285 | 74.71 | 10 | 9 | 3.7 |
| C | 14 | 238 | 1640 | 413.28 | 9 | 9 | 3.9 |
| C | 3 | 233 | 1246 | 313.44 | 9 | 9 | 3.9 |
| C | 7 | 247 | 95 | 21.79 | 9 | 9 | 3.9 |
| D | 2 | 120 | 8482 | 2172.67 | 9 | 8 | 3.9 |
| D | 8 | 195 | 1069 | 271.92 | 9 | 8 | 3.9 |
| D | 2 | 234 | 302 | 75.26 | 9 | 8 | 3.9 |
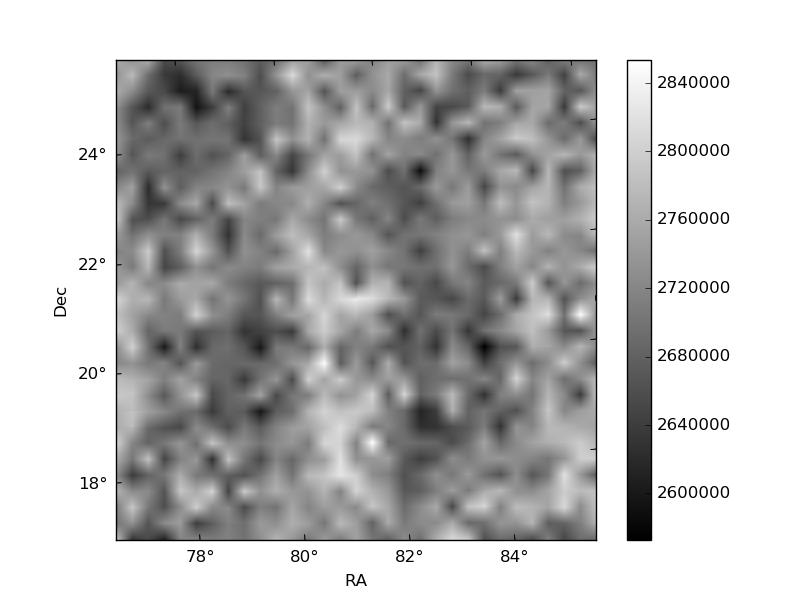
Histogram calculated using DETX and DETY for each event in the final _common_clean file
| Quadrant A |  |
 |
Quadrant B |
|---|---|---|---|
| Quadrant D | 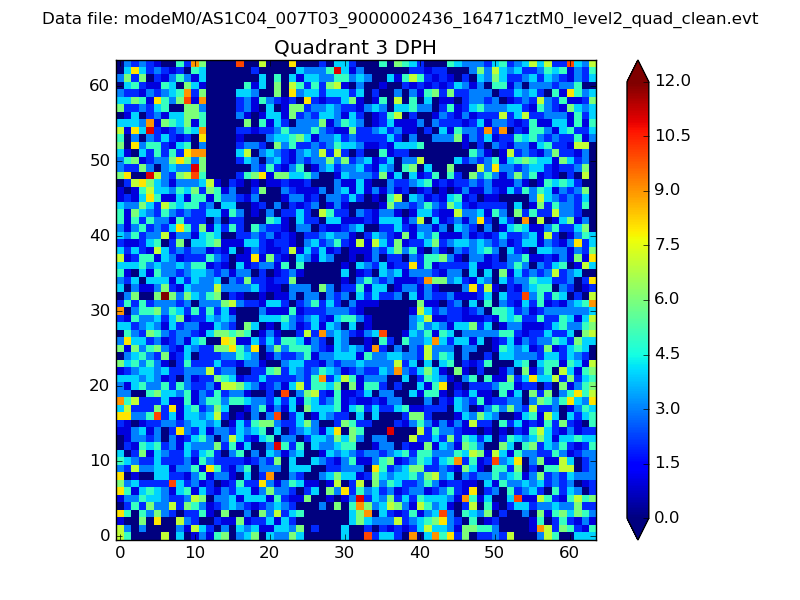 |
 |
Quadrant C |
| Plot type | Count rate plots | Images |
|---|---|---|
| Comparison with Poisson distribution Blue bars denote a histogram of data divided into 1 sec bins. Red curve is a Poisson curve with rate = median count rate of data. |
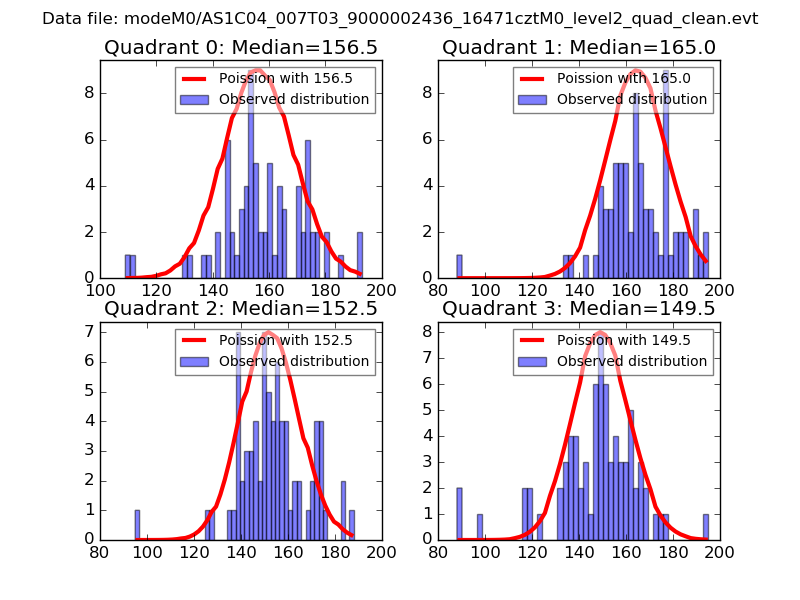 |
 |
| Quadrant-wise count rates Data is divided into 100 sec bins |
 |
|
| Module-wise count rates for Quadrant A Data is divided into 100 sec bins |
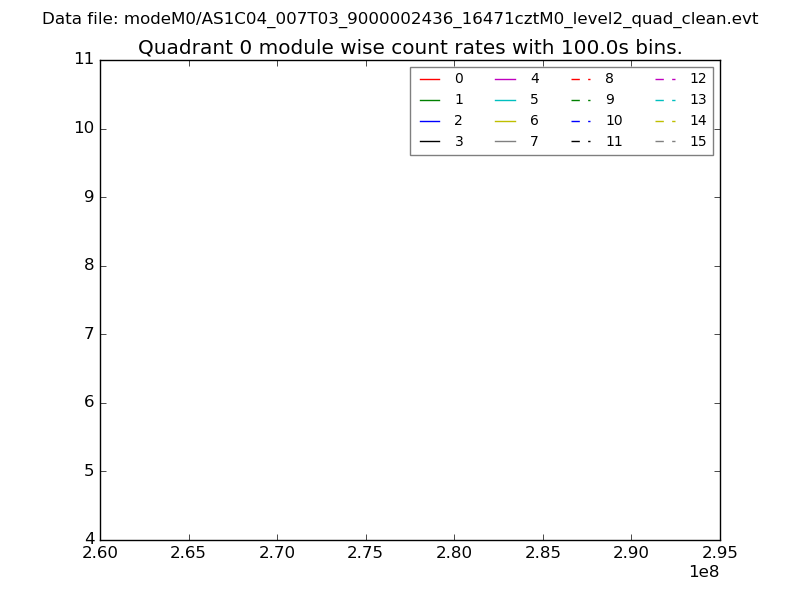 |
 |
| Module-wise count rates for Quadrant B Data is divided into 100 sec bins |
 |
 |
| Module-wise count rates for Quadrant C Data is divided into 100 sec bins |
 |
 |
| Module-wise count rates for Quadrant D Data is divided into 100 sec bins |
 |
 |
| Parameter | Plot |
|---|---|
| CZT HV Monitor |  |
| D_VDD | 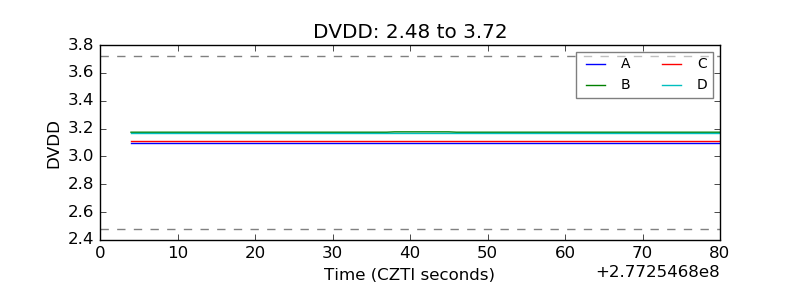 |
| Temperature 1 | 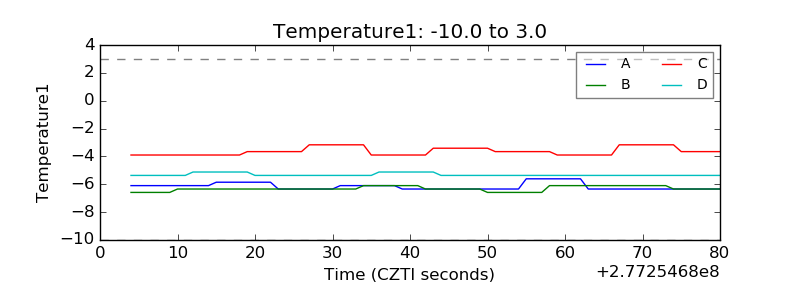 |
| Veto HV Monitor | 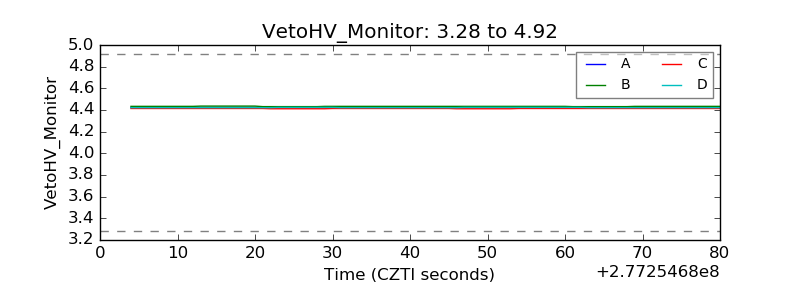 |
| Veto LLD | 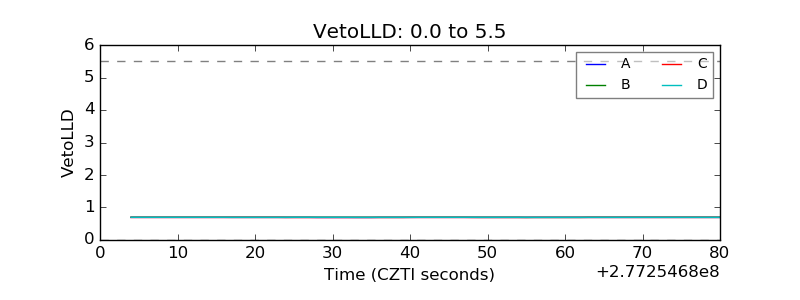 |
| Alpha Counter | 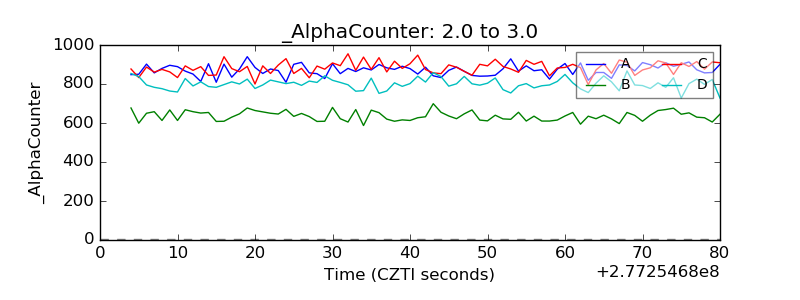 |
| _CPM_Rate | 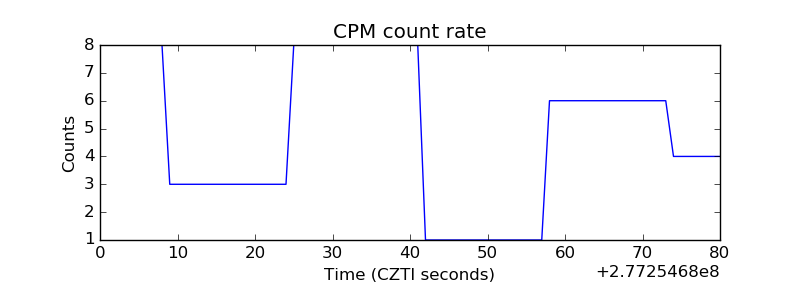 |
| CZT Counter | 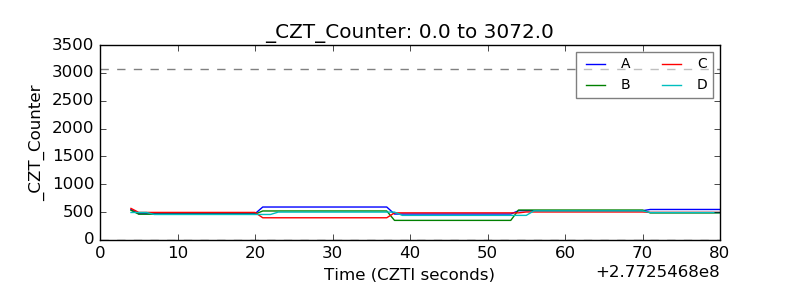 |
| +2.5 Volts monitor |  |
| +5 Volts monitor |  |
| _ROLL_ROT | 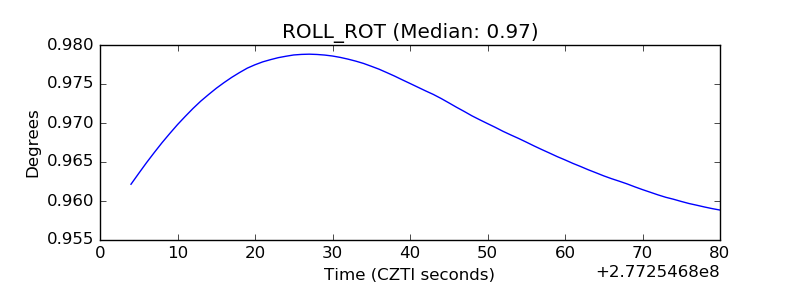 |
| _Roll_DEC | 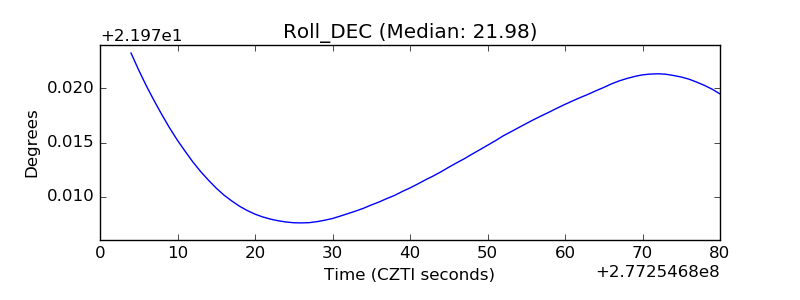 |
| _Roll_RA | 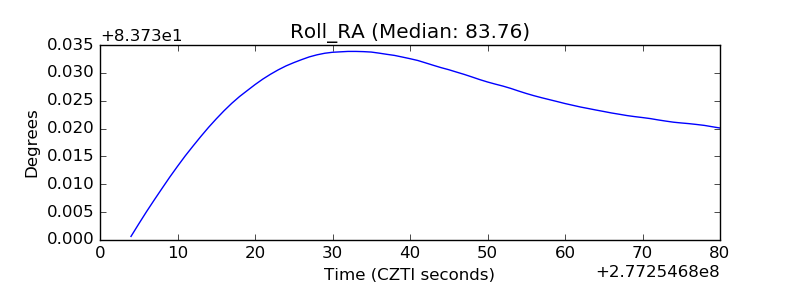 |
| Veto Counter | 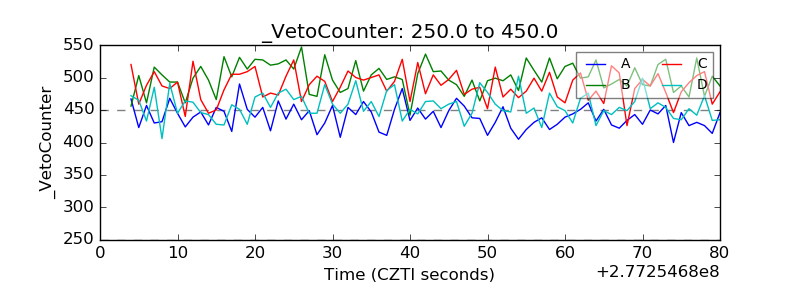 |