| Param | Original file | Final file |
|---|---|---|
| Filename | modeM0/AS1C04_007T03_9000002436_16472cztM0_level2.evt | modeM0/AS1C04_007T03_9000002436_16472cztM0_level2_quad_clean.evt |
| Size (bytes) | 426,729,600 | 82,077,120 |
| Size | 407.0 MB | 78.3 MB |
| Events in quadrant A | 3,889,628 | 537,344 |
| Events in quadrant B | 3,057,968 | 557,812 |
| Events in quadrant C | 2,843,125 | 525,498 |
| Events in quadrant D | 2,783,592 | 504,495 |
| Mode M0 | |||
|---|---|---|---|
| Quadrant | BADHDUFLAG | Total packets | Discarded packets |
| A | 0 | 14935 | 2 |
| B | 0 | 12370 | 1 |
| C | 0 | 11571 | 1 |
| D | 0 | 11729 | 1 |
| Mode SS | |||
|---|---|---|---|
| Quadrant | BADHDUFLAG | Total packets | Discarded packets |
| A | 0 | 106 | 0 |
| B | 0 | 106 | 0 |
| C | 0 | 106 | 0 |
| D | 0 | 106 | 0 |
| Mode M9 | |||
|---|---|---|---|
| Quadrant | BADHDUFLAG | Total packets | Discarded packets |
| A | 0 | 13 | 0 |
| B | 0 | 13 | 0 |
| C | 0 | 13 | 0 |
| D | 0 | 13 | 0 |
| Quadrant | Total seconds | Saturated seconds | Saturation percentage |
|---|---|---|---|
| A | 5139 | 279 | 5.429072% |
| B | 5139 | 115 | 2.237789% |
| C | 5139 | 113 | 2.198871% |
| D | 5139 | 95 | 1.848609% |
Noise dominated data is calculated using 1-second bins in cleaned event files. If a bin has >2000 counts, and if more than 50% of those come from <1% of pixels, then it is considered to be noise-dominated and hence unusable.
| Quadrant | # 1 sec bins | Bins with >0 counts | Bins with >2000 counts | High rate bins dominated by noise | Noise dominated (total time) | Noise dominated (detector-on time) | Marked lightcurve |
|---|---|---|---|---|---|---|---|
| A | 6445 | 5141 | 187 | 187 | 2.90% | 3.64% | 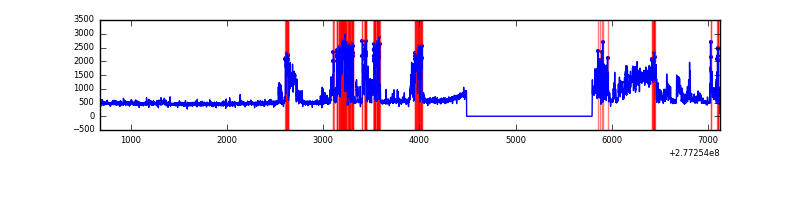 |
| B | 6445 | 5141 | 24 | 24 | 0.37% | 0.47% | 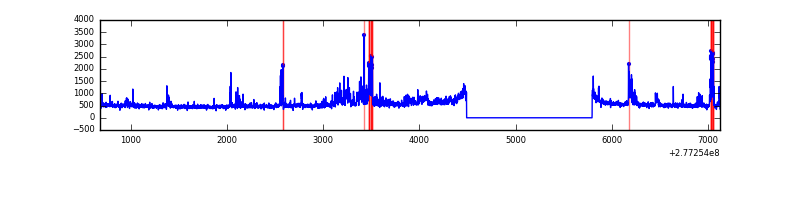 |
| C | 6445 | 5140 | 1 | 1 | 0.02% | 0.02% | 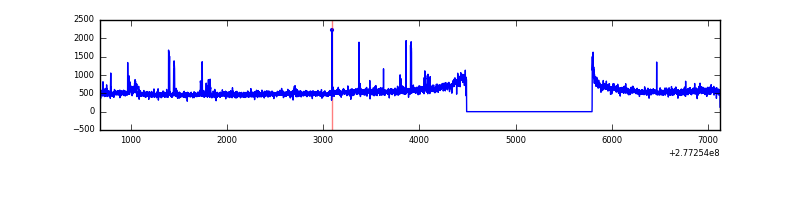 |
| D | 6445 | 5141 | 73 | 73 | 1.13% | 1.42% | 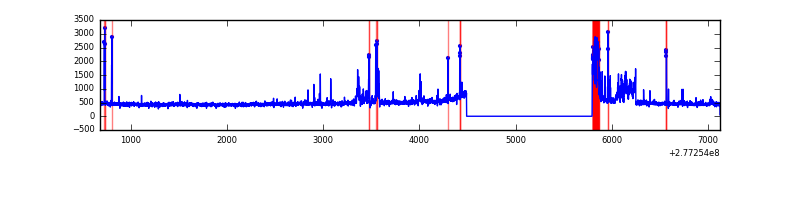 |
Top three noisy pixels from each quadrant. If the there are fewer than three noisy pixels in the level2.evt file, extra rows are filled as -1
| Pixel properties | Quadrant properties | ||||||
|---|---|---|---|---|---|---|---|
| Quadrant | DetID | PixID | Counts | Sigma | Mean | Median | Sigma |
| A | 15 | 174 | 1394611 | 10534.77 | 650 | 639 | 132.3 |
| A | 0 | 226 | 5524 | 36.92 | 650 | 639 | 132.3 |
| A | 12 | 194 | 4722 | 30.86 | 650 | 639 | 132.3 |
| B | 4 | 173 | 193842 | 1542.58 | 664 | 652 | 125.2 |
| B | 10 | 16 | 89992 | 713.36 | 664 | 652 | 125.2 |
| B | 3 | 209 | 55538 | 438.25 | 664 | 652 | 125.2 |
| C | 3 | 233 | 248715 | 1696.88 | 632 | 640 | 146.2 |
| C | 14 | 238 | 99365 | 675.3 | 632 | 640 | 146.2 |
| C | 7 | 247 | 26095 | 174.12 | 632 | 640 | 146.2 |
| D | 1 | 52 | 263264 | 1707.1 | 630 | 615 | 153.9 |
| D | 2 | 33 | 98377 | 635.41 | 630 | 615 | 153.9 |
| D | 2 | 234 | 19672 | 123.86 | 630 | 615 | 153.9 |
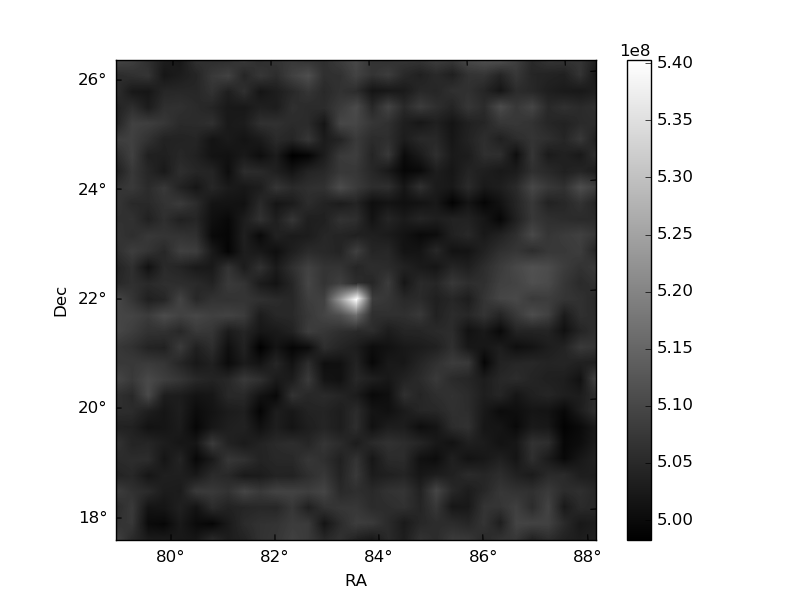
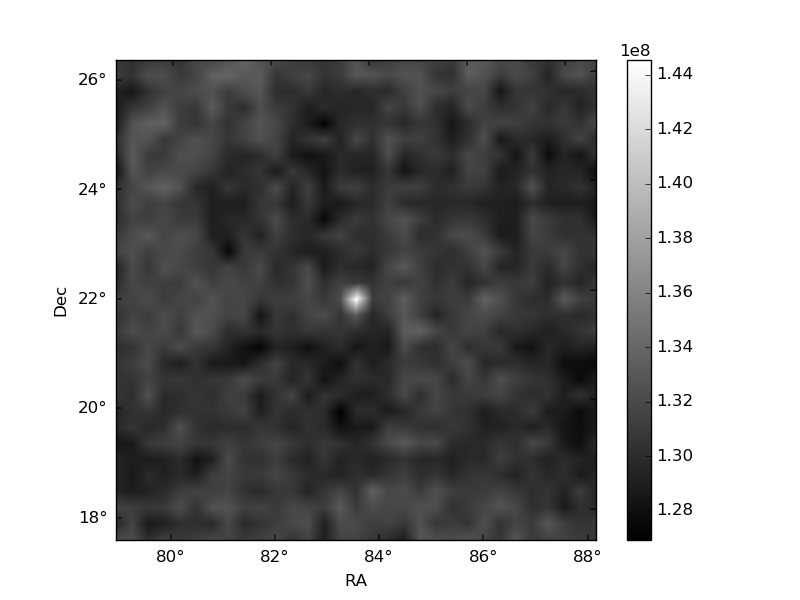
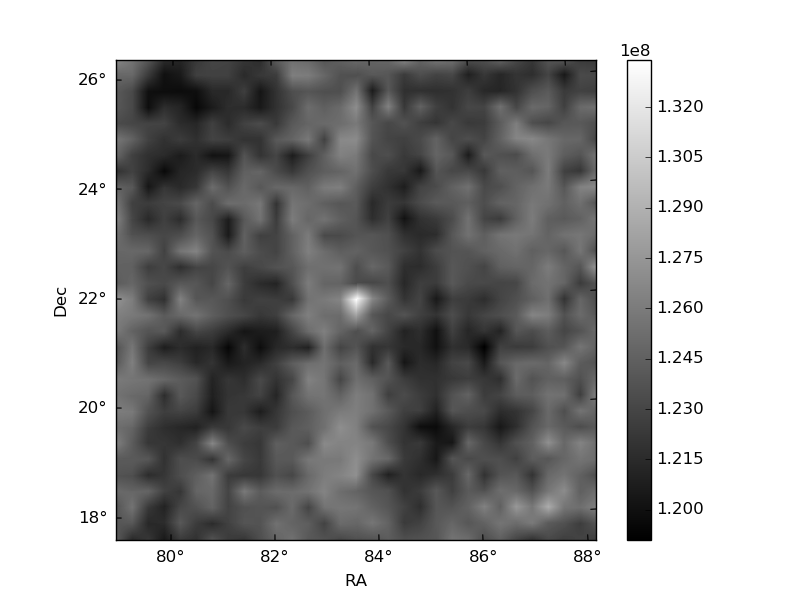
Histogram calculated using DETX and DETY for each event in the final _common_clean file
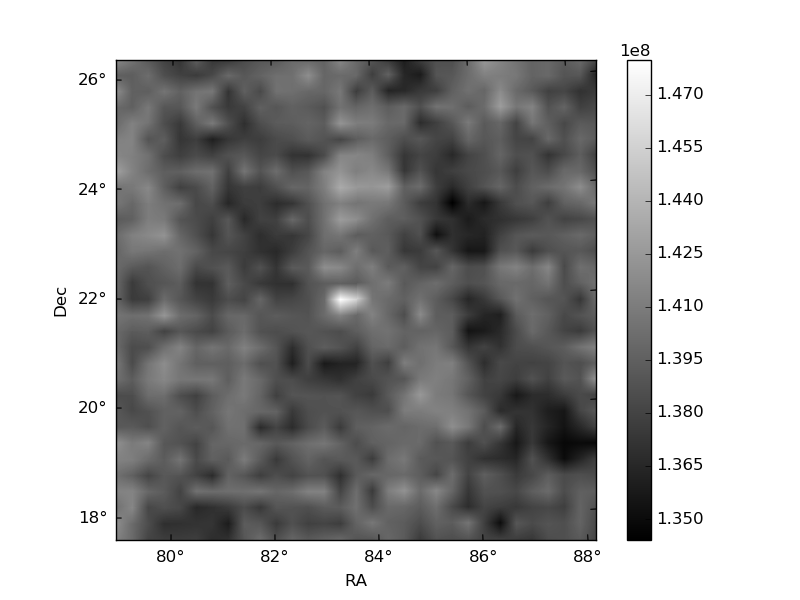
| Quadrant A | 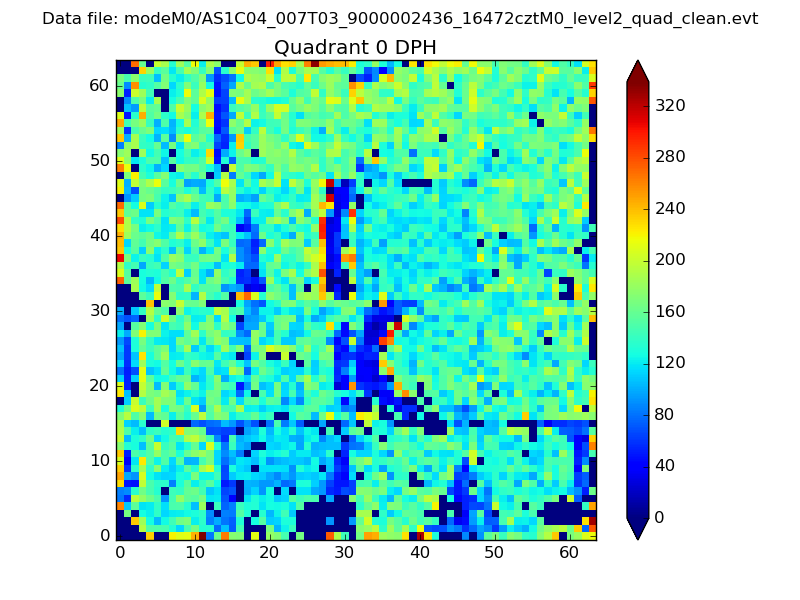 |
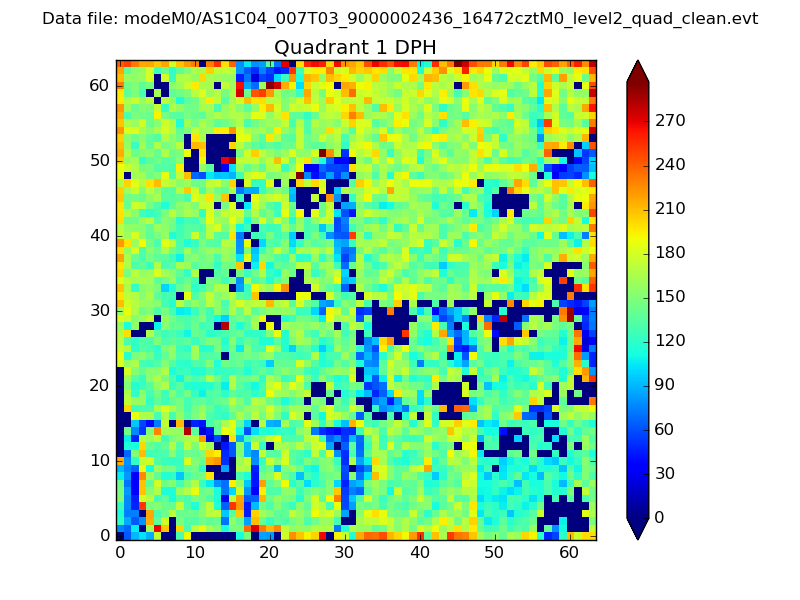 |
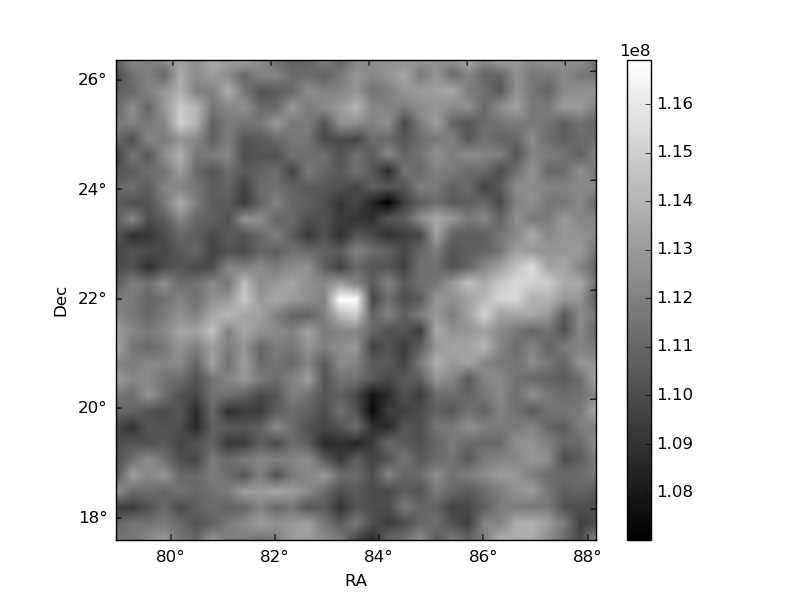
Quadrant B |
|---|---|---|---|
| Quadrant D |  |
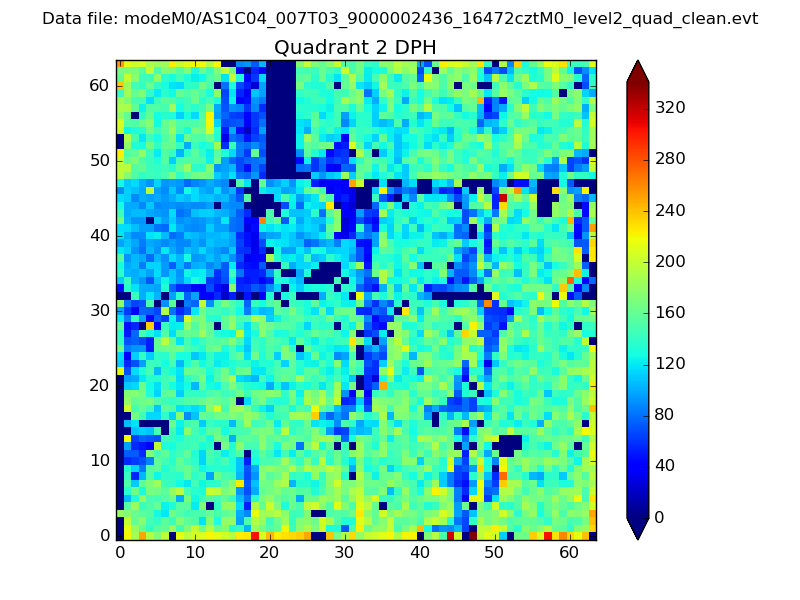 |
Quadrant C |
| Plot type | Count rate plots | Images |
|---|---|---|
| Comparison with Poisson distribution Blue bars denote a histogram of data divided into 1 sec bins. Red curve is a Poisson curve with rate = median count rate of data. |
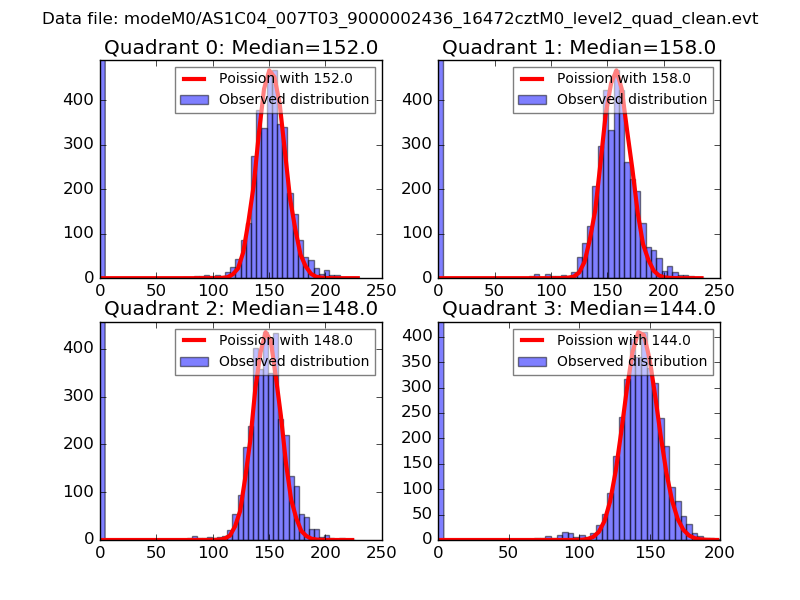 |
 |
| Quadrant-wise count rates Data is divided into 100 sec bins |
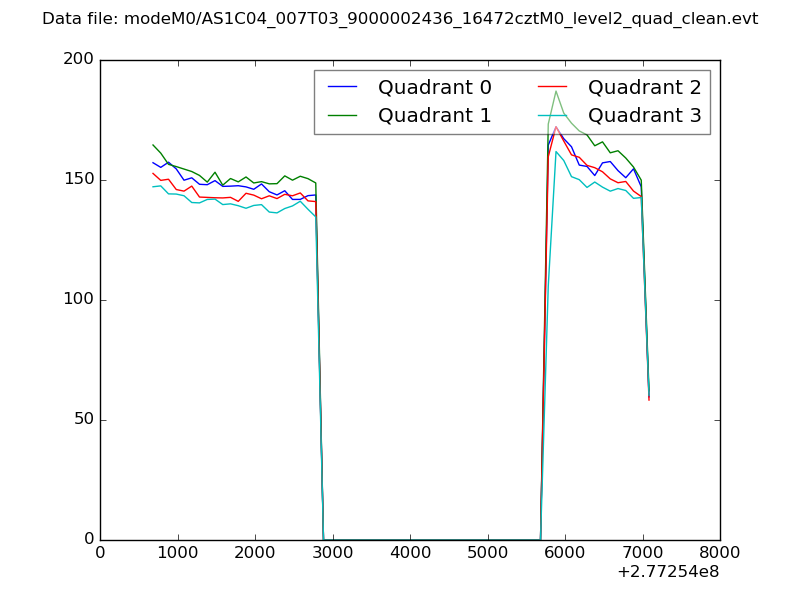 |
|
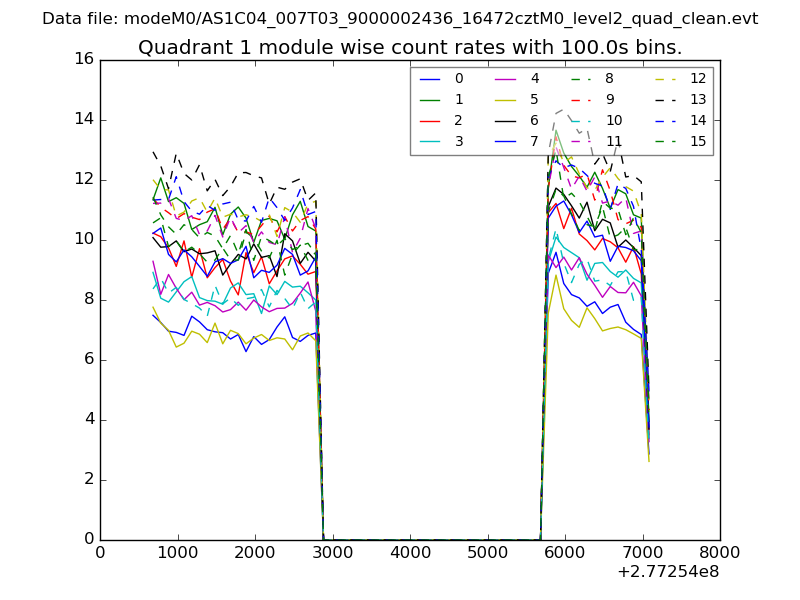
| Module-wise count rates for Quadrant A Data is divided into 100 sec bins |
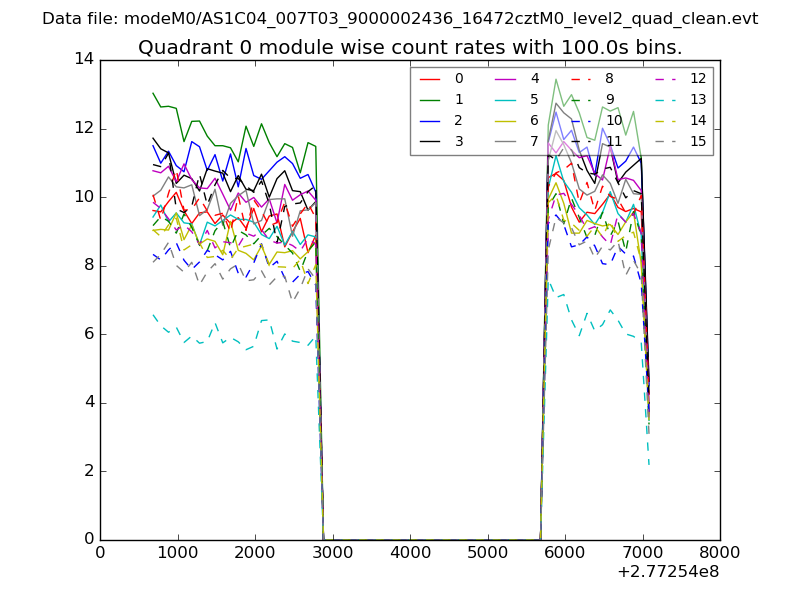 |
 |
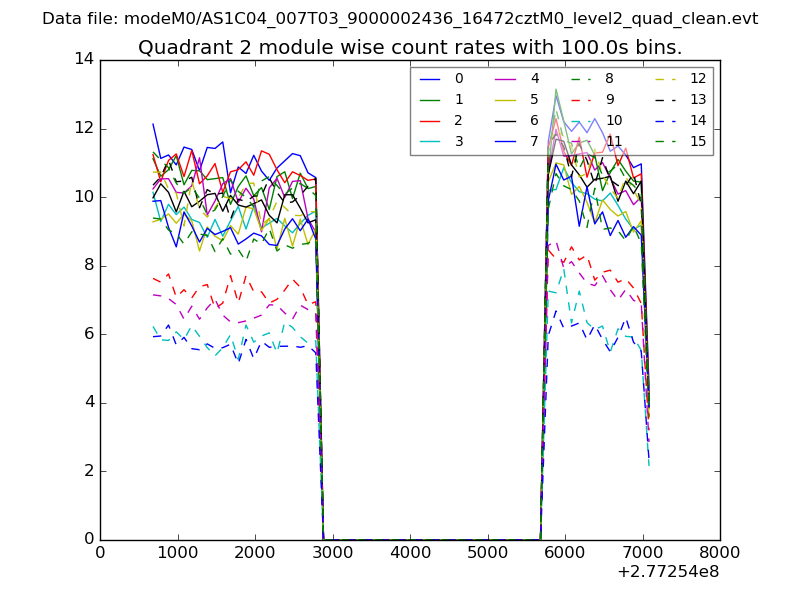
| Module-wise count rates for Quadrant B Data is divided into 100 sec bins |
 |
 |
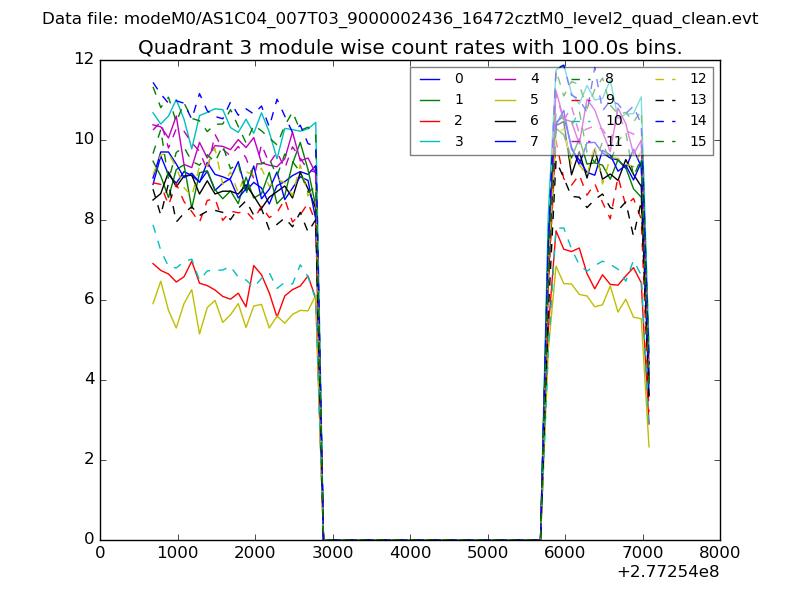
| Module-wise count rates for Quadrant C Data is divided into 100 sec bins |
 |
 |
| Module-wise count rates for Quadrant D Data is divided into 100 sec bins |
 |
 |
| Parameter | Plot |
|---|---|
| CZT HV Monitor | 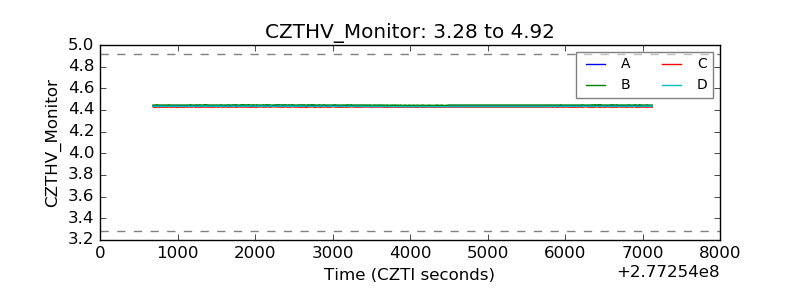 |
| D_VDD | 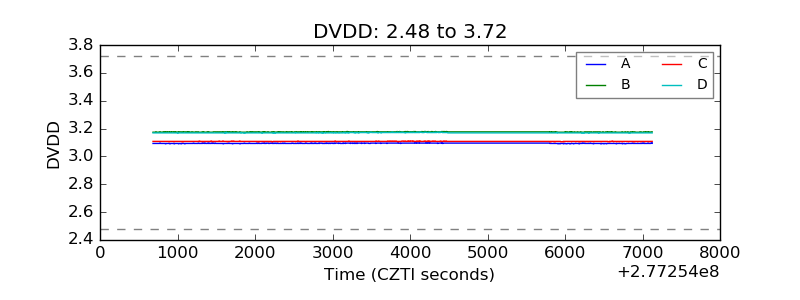 |
| Temperature 1 | 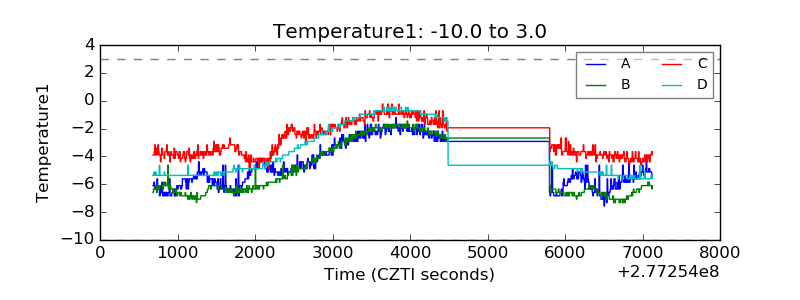 |
| Veto HV Monitor | 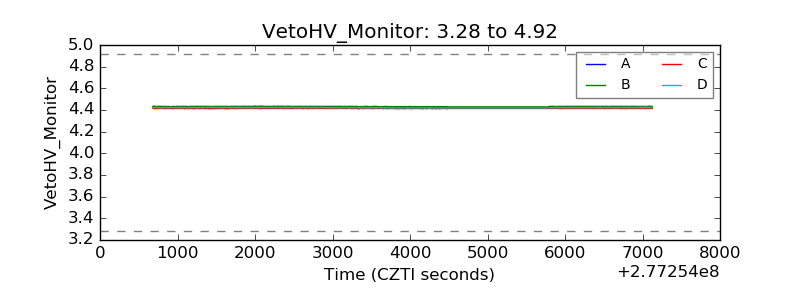 |
| Veto LLD | 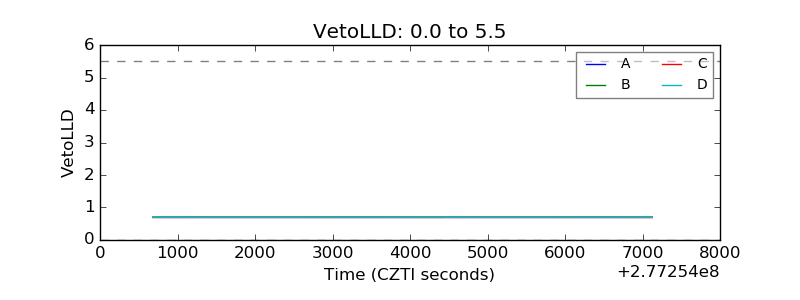 |
| Alpha Counter | 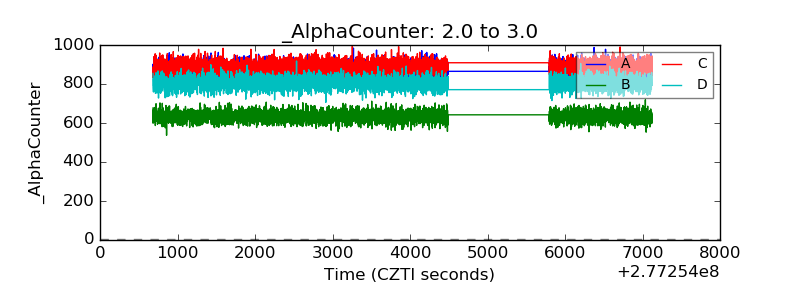 |
| _CPM_Rate | 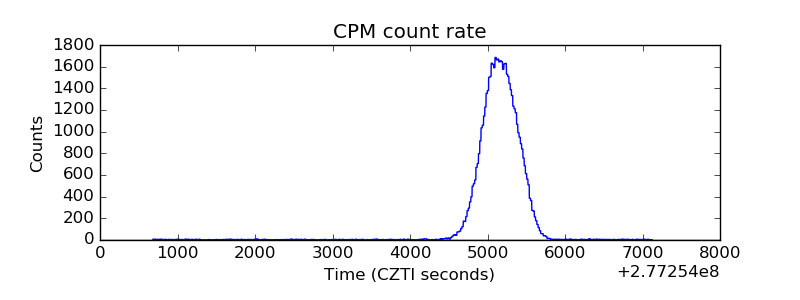 |
| CZT Counter | 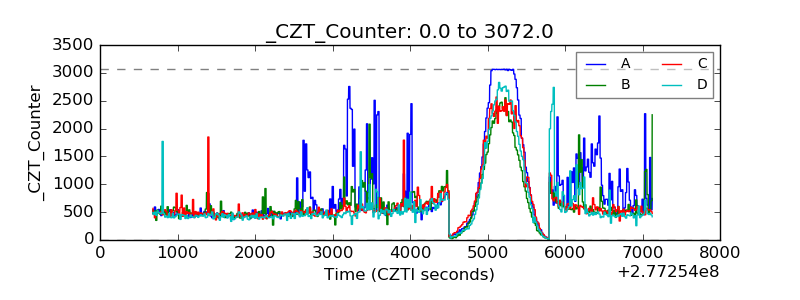 |
| +2.5 Volts monitor |  |
| +5 Volts monitor | 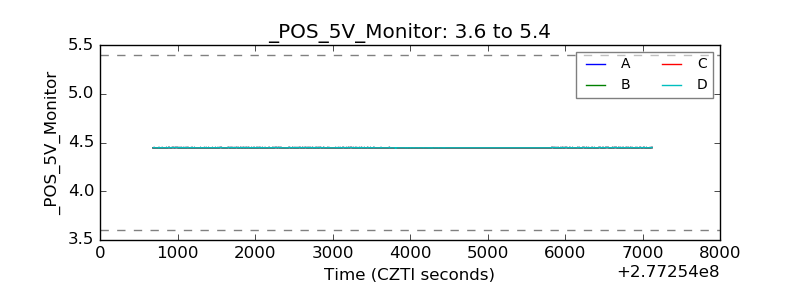 |
| _ROLL_ROT | 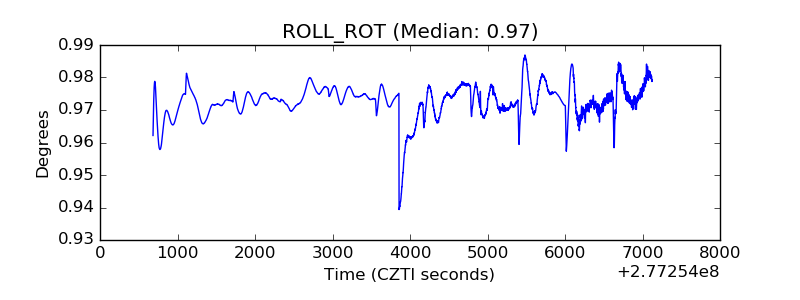 |
| _Roll_DEC | 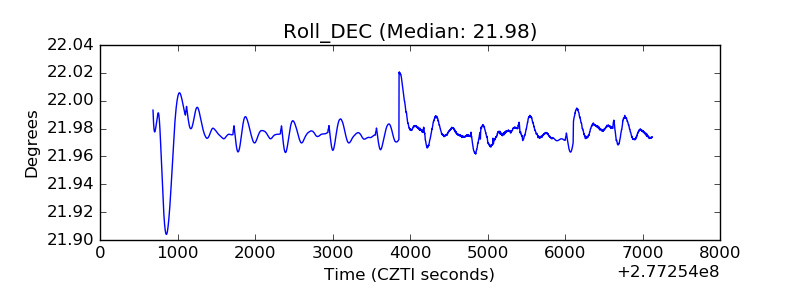 |
| _Roll_RA | 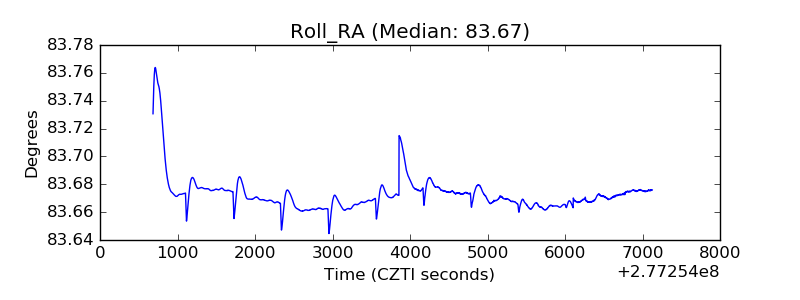 |
| Veto Counter | 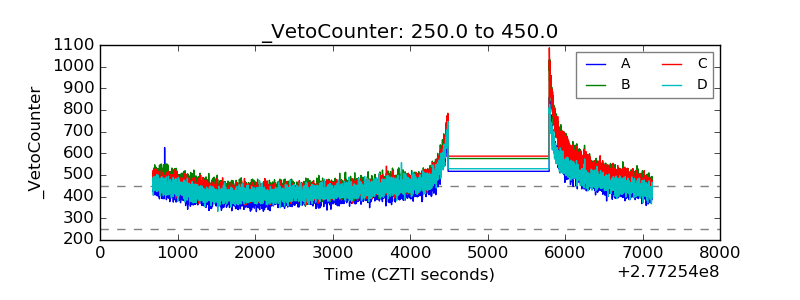 |