| Param | Original file | Final file |
|---|---|---|
| Filename | modeM0/AS1C04_007T03_9000002436_16473cztM0_level2.evt | modeM0/AS1C04_007T03_9000002436_16473cztM0_level2_quad_clean.evt |
| Size (bytes) | 557,694,720 | 104,970,240 |
| Size | 531.9 MB | 100.1 MB |
| Events in quadrant A | 4,529,711 | 694,635 |
| Events in quadrant B | 4,424,422 | 696,153 |
| Events in quadrant C | 3,910,451 | 672,599 |
| Events in quadrant D | 3,571,139 | 648,463 |
| Mode M0 | |||
|---|---|---|---|
| Quadrant | BADHDUFLAG | Total packets | Discarded packets |
| A | 0 | 17782 | 3 |
| B | 0 | 17470 | 2 |
| C | 0 | 15654 | 2 |
| D | 0 | 15219 | 2 |
| Mode SS | |||
|---|---|---|---|
| Quadrant | BADHDUFLAG | Total packets | Discarded packets |
| A | 0 | 136 | 0 |
| B | 0 | 136 | 0 |
| C | 0 | 136 | 0 |
| D | 0 | 136 | 0 |
| Mode M9 | |||
|---|---|---|---|
| Quadrant | BADHDUFLAG | Total packets | Discarded packets |
| A | 0 | 19 | 0 |
| B | 0 | 19 | 0 |
| C | 0 | 19 | 0 |
| D | 0 | 20 | 0 |
| Quadrant | Total seconds | Saturated seconds | Saturation percentage |
|---|---|---|---|
| A | 6702 | 234 | 3.491495% |
| B | 6702 | 326 | 4.864220% |
| C | 6702 | 103 | 1.536855% |
| D | 6702 | 96 | 1.432408% |
Noise dominated data is calculated using 1-second bins in cleaned event files. If a bin has >2000 counts, and if more than 50% of those come from <1% of pixels, then it is considered to be noise-dominated and hence unusable.
| Quadrant | # 1 sec bins | Bins with >0 counts | Bins with >2000 counts | High rate bins dominated by noise | Noise dominated (total time) | Noise dominated (detector-on time) | Marked lightcurve |
|---|---|---|---|---|---|---|---|
| A | 7923 | 6704 | 67 | 67 | 0.85% | 1.00% | 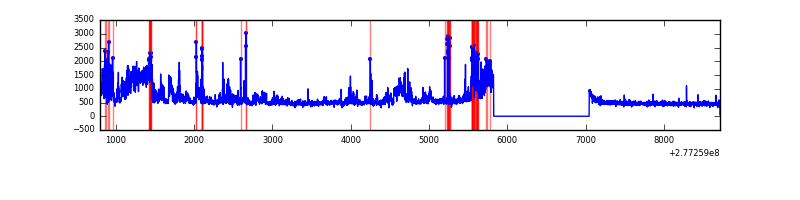 |
| B | 7923 | 6703 | 237 | 237 | 2.99% | 3.54% | 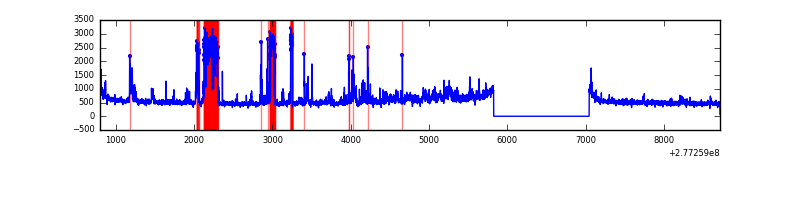 |
| C | 7923 | 6703 | 0 | 0 | 0.00% | 0.00% | 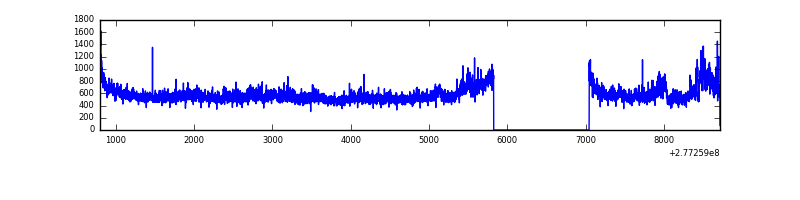 |
| D | 7923 | 6704 | 77 | 77 | 0.97% | 1.15% | 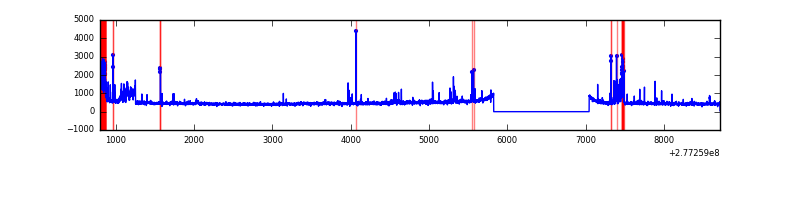 |
Top three noisy pixels from each quadrant. If the there are fewer than three noisy pixels in the level2.evt file, extra rows are filled as -1
| Pixel properties | Quadrant properties | ||||||
|---|---|---|---|---|---|---|---|
| Quadrant | DetID | PixID | Counts | Sigma | Mean | Median | Sigma |
| A | 15 | 174 | 1246098 | 7241.43 | 847 | 833 | 172.0 |
| A | 4 | 2 | 32542 | 184.39 | 847 | 833 | 172.0 |
| A | 0 | 226 | 7367 | 38.0 | 847 | 833 | 172.0 |
| B | 10 | 16 | 693384 | 4328.42 | 847 | 829 | 160.0 |
| B | 3 | 209 | 134847 | 837.6 | 847 | 829 | 160.0 |
| B | 4 | 173 | 86238 | 533.8 | 847 | 829 | 160.0 |
| C | 3 | 233 | 524688 | 2761.21 | 820 | 831 | 189.7 |
| C | 14 | 238 | 129571 | 678.58 | 820 | 831 | 189.7 |
| C | 7 | 247 | 49079 | 254.31 | 820 | 831 | 189.7 |
| D | 1 | 52 | 258635 | 1280.91 | 818 | 798 | 201.3 |
| D | 2 | 33 | 133671 | 660.1 | 818 | 798 | 201.3 |
| D | 13 | 248 | 65991 | 323.87 | 818 | 798 | 201.3 |
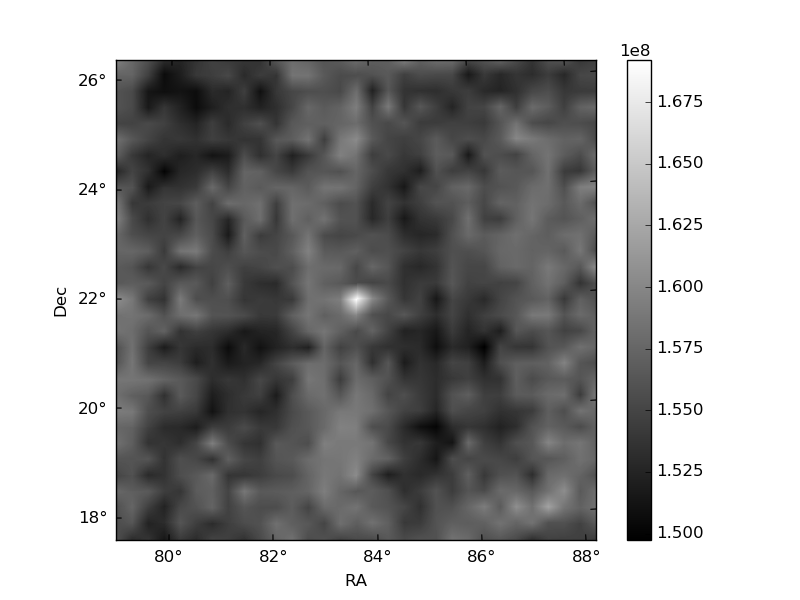
Histogram calculated using DETX and DETY for each event in the final _common_clean file
| Quadrant A | 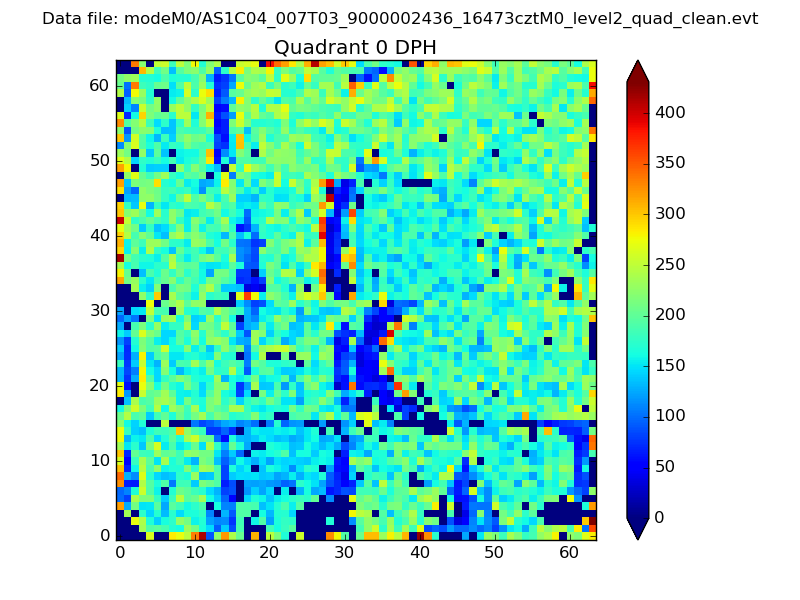 |
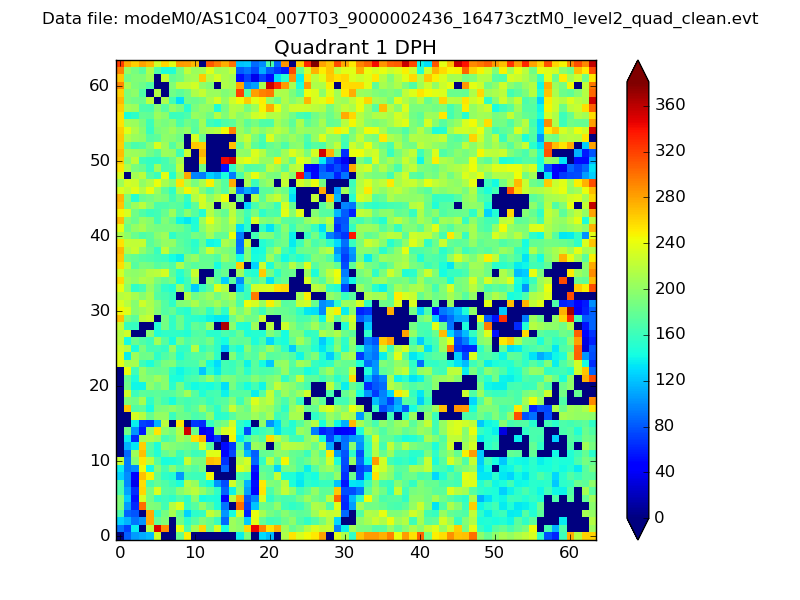 |
Quadrant B |
|---|---|---|---|
| Quadrant D | 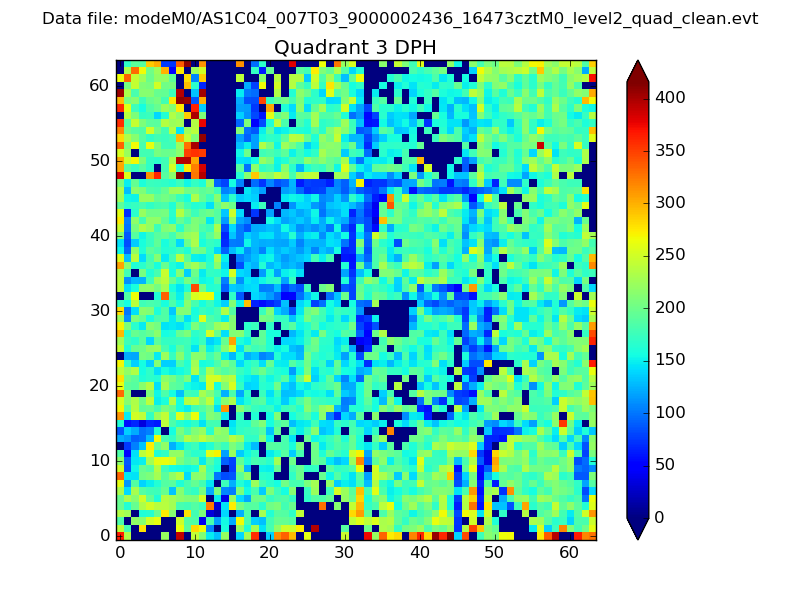 |
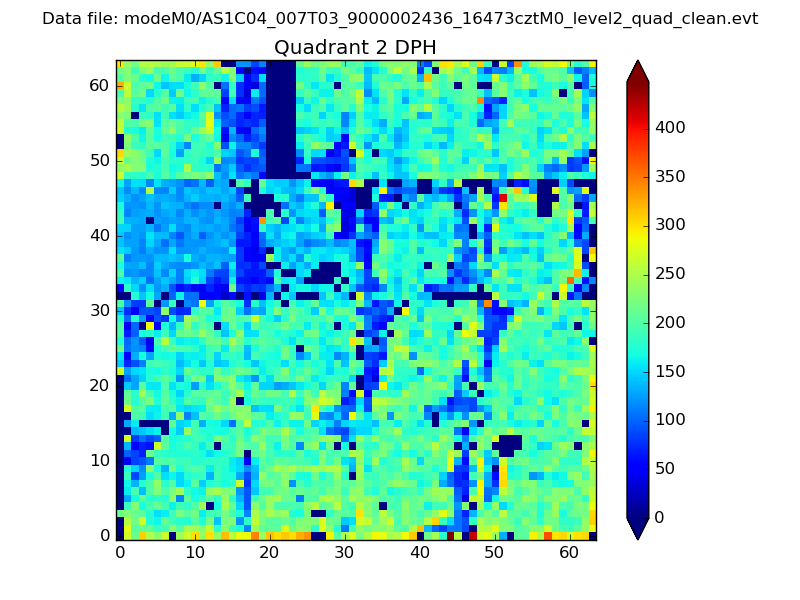 |
Quadrant C |
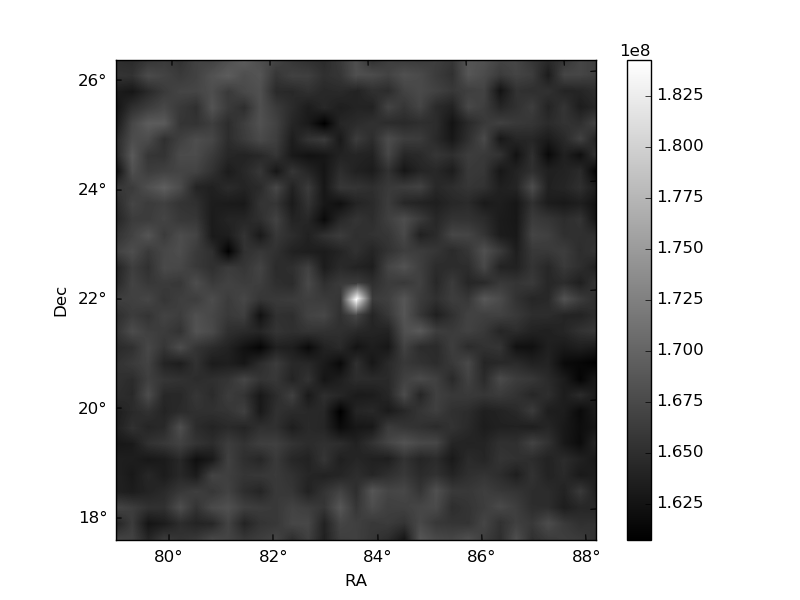
| Plot type | Count rate plots | Images |
|---|---|---|
| Comparison with Poisson distribution Blue bars denote a histogram of data divided into 1 sec bins. Red curve is a Poisson curve with rate = median count rate of data. |
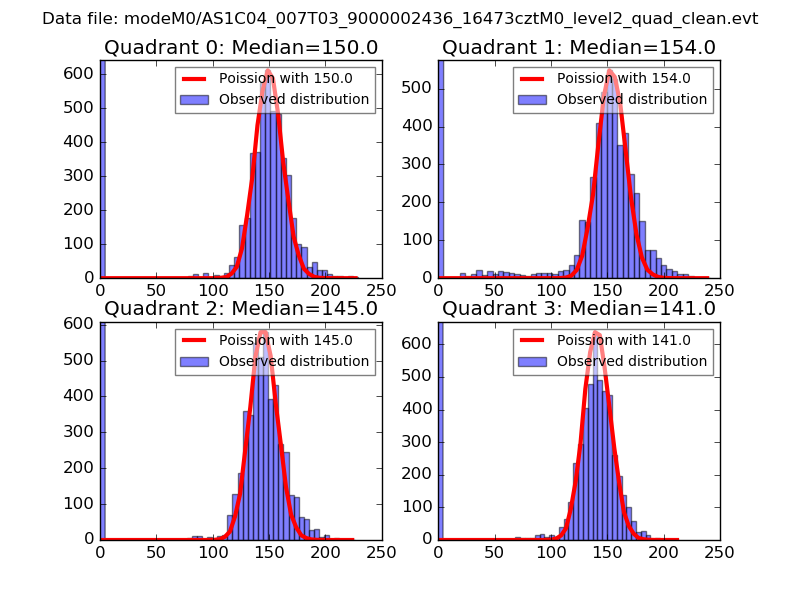 |
 |
| Quadrant-wise count rates Data is divided into 100 sec bins |
 |
|
| Module-wise count rates for Quadrant A Data is divided into 100 sec bins |
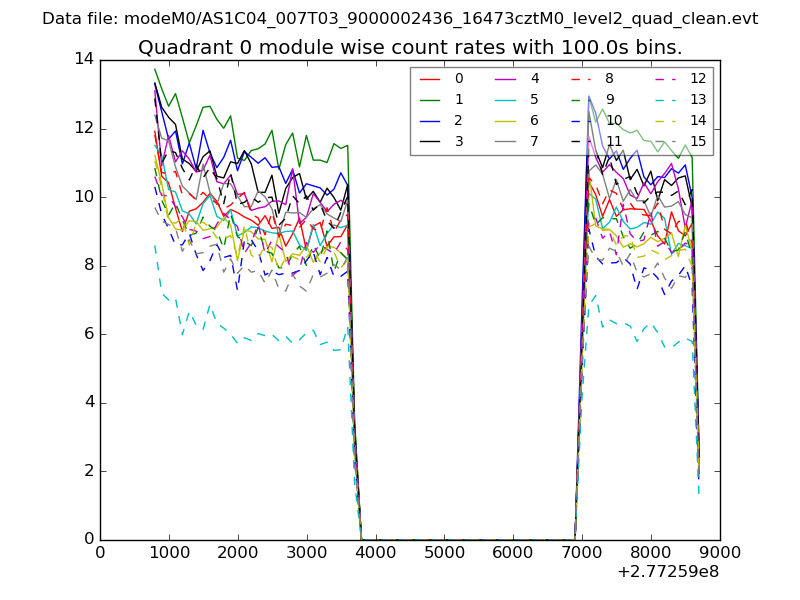 |
 |
| Module-wise count rates for Quadrant B Data is divided into 100 sec bins |
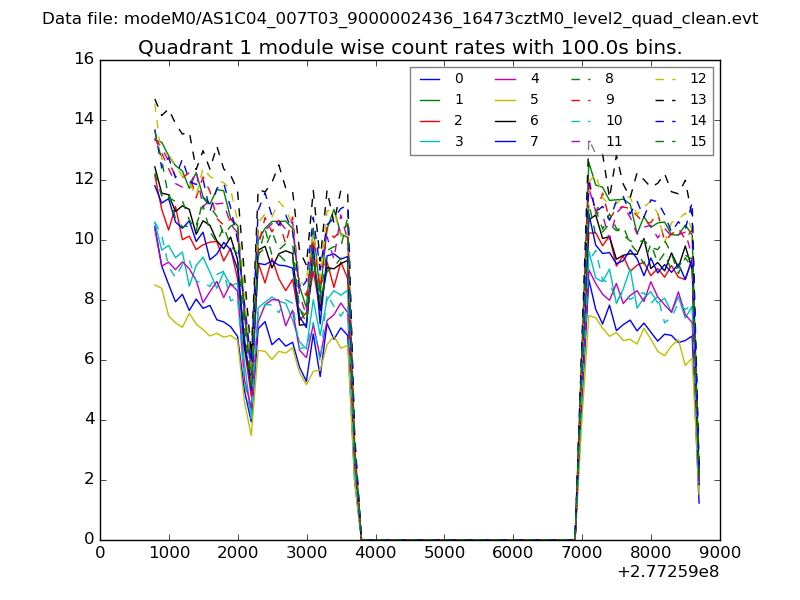 |
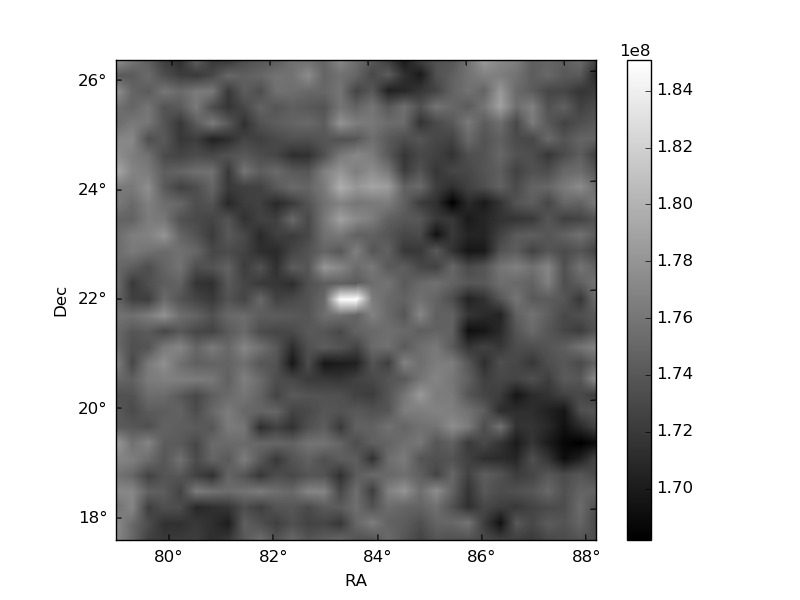 |
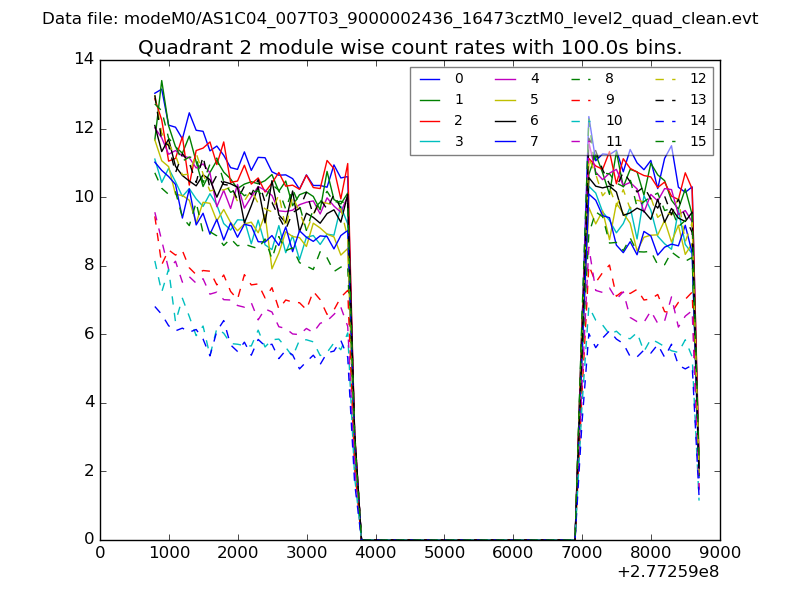
| Module-wise count rates for Quadrant C Data is divided into 100 sec bins |
 |
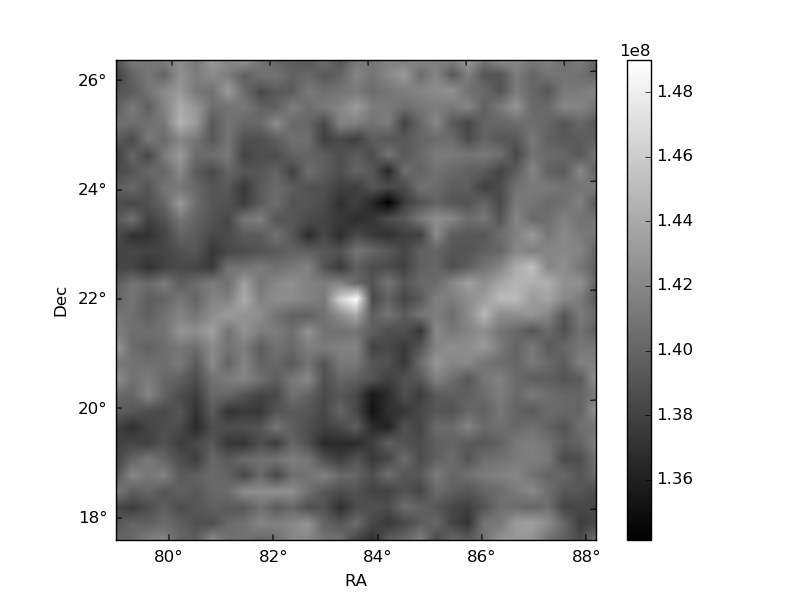 |
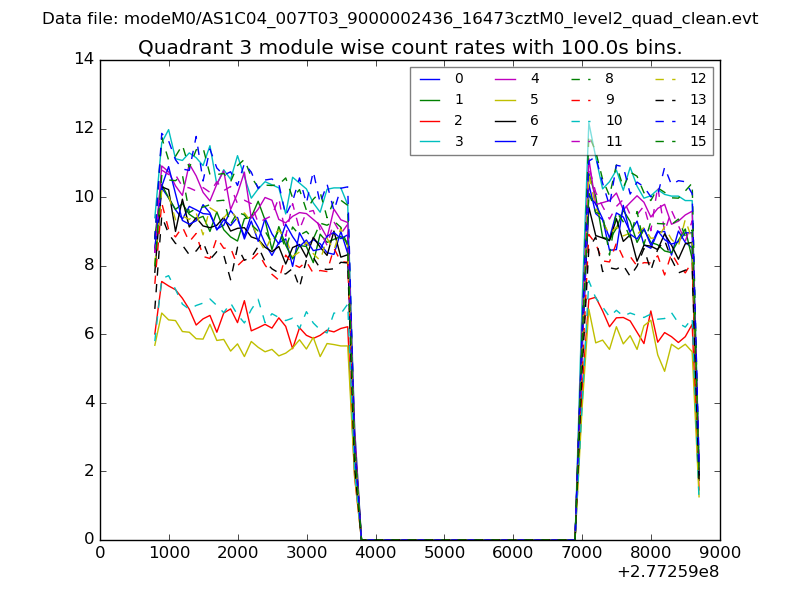
| Module-wise count rates for Quadrant D Data is divided into 100 sec bins |
 |
 |
| Parameter | Plot |
|---|---|
| CZT HV Monitor | 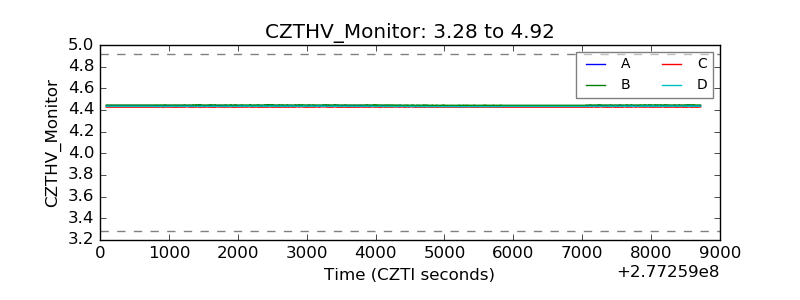 |
| D_VDD |  |
| Temperature 1 | 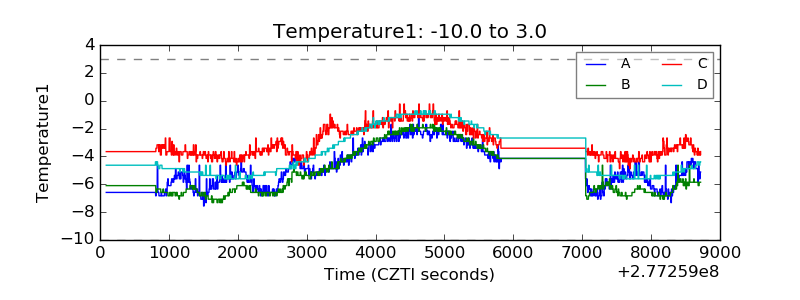 |
| Veto HV Monitor | 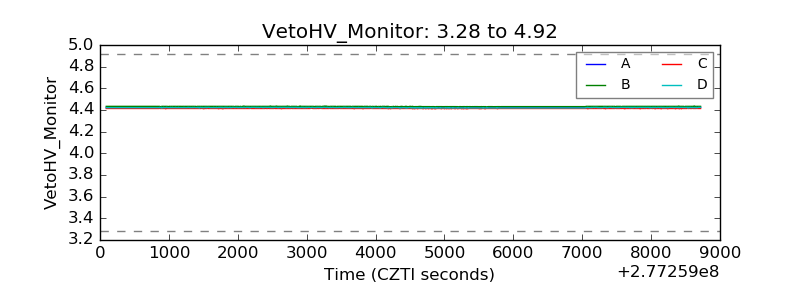 |
| Veto LLD | 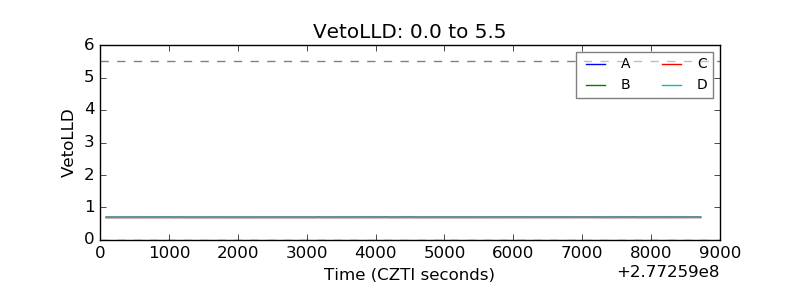 |
| Alpha Counter | 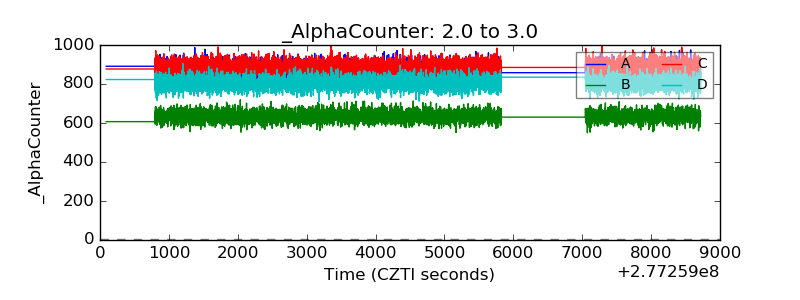 |
| _CPM_Rate | 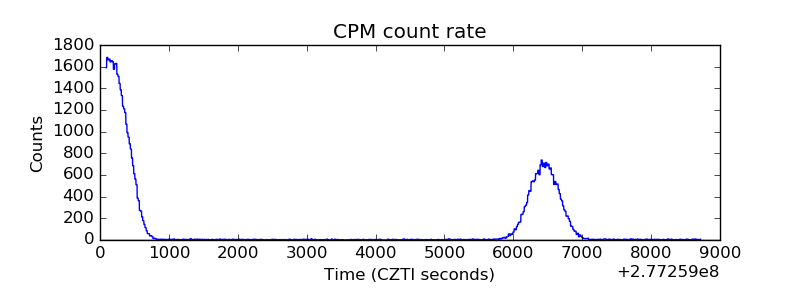 |
| CZT Counter |  |
| +2.5 Volts monitor |  |
| +5 Volts monitor |  |
| _ROLL_ROT | 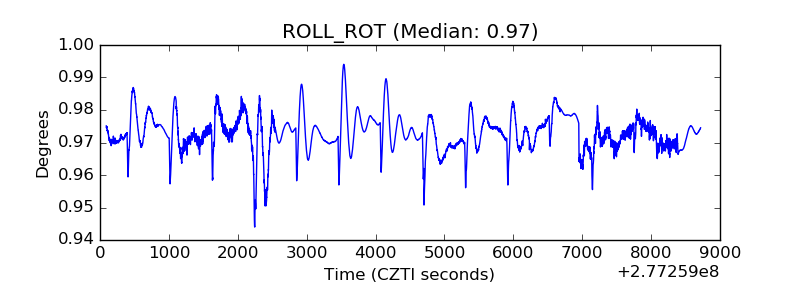 |
| _Roll_DEC | 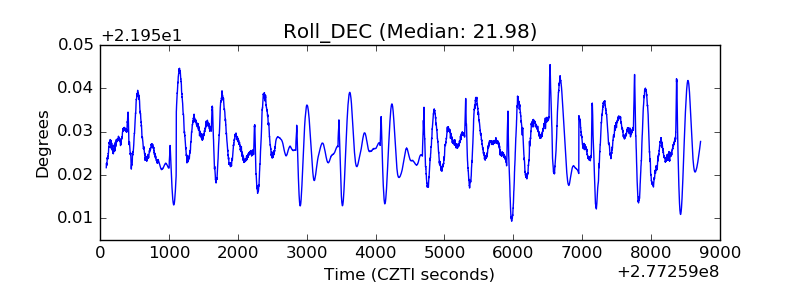 |
| _Roll_RA |  |
| Veto Counter | 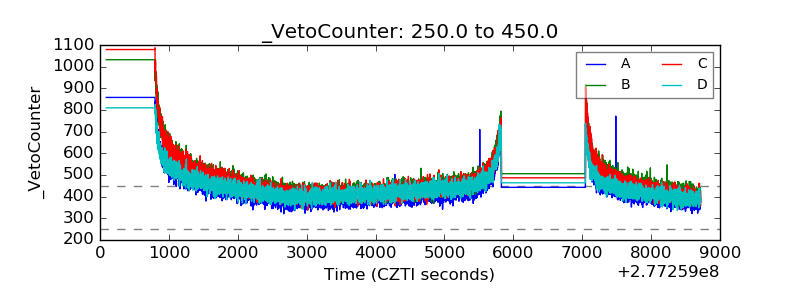 |