| Param | Original file | Final file |
|---|---|---|
| Filename | modeM0/AS1C04_007T03_9000002436_16474cztM0_level2.evt | modeM0/AS1C04_007T03_9000002436_16474cztM0_level2_quad_clean.evt |
| Size (bytes) | 459,345,600 | 87,275,520 |
| Size | 438.1 MB | 83.2 MB |
| Events in quadrant A | 3,333,683 | 559,762 |
| Events in quadrant B | 3,326,348 | 573,599 |
| Events in quadrant C | 3,677,675 | 545,971 |
| Events in quadrant D | 3,154,905 | 533,242 |
| Mode M0 | |||
|---|---|---|---|
| Quadrant | BADHDUFLAG | Total packets | Discarded packets |
| A | 0 | 13895 | 2 |
| B | 0 | 13851 | 1 |
| C | 0 | 14944 | 1 |
| D | 0 | 13577 | 1 |
| Mode SS | |||
|---|---|---|---|
| Quadrant | BADHDUFLAG | Total packets | Discarded packets |
| A | 0 | 124 | 0 |
| B | 0 | 124 | 0 |
| C | 0 | 124 | 0 |
| D | 0 | 124 | 0 |
| Mode M9 | |||
|---|---|---|---|
| Quadrant | BADHDUFLAG | Total packets | Discarded packets |
| A | 0 | 10 | 0 |
| B | 0 | 10 | 0 |
| C | 0 | 10 | 0 |
| D | 0 | 10 | 0 |
| Quadrant | Total seconds | Saturated seconds | Saturation percentage |
|---|---|---|---|
| A | 6170 | 143 | 2.317666% |
| B | 6170 | 84 | 1.361426% |
| C | 6170 | 90 | 1.458671% |
| D | 6170 | 71 | 1.150729% |
Noise dominated data is calculated using 1-second bins in cleaned event files. If a bin has >2000 counts, and if more than 50% of those come from <1% of pixels, then it is considered to be noise-dominated and hence unusable.
| Quadrant | # 1 sec bins | Bins with >0 counts | Bins with >2000 counts | High rate bins dominated by noise | Noise dominated (total time) | Noise dominated (detector-on time) | Marked lightcurve |
|---|---|---|---|---|---|---|---|
| A | 7121 | 6171 | 33 | 33 | 0.46% | 0.53% | 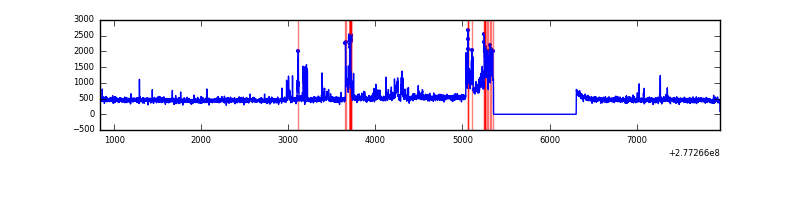 |
| B | 7121 | 6171 | 4 | 4 | 0.06% | 0.06% | 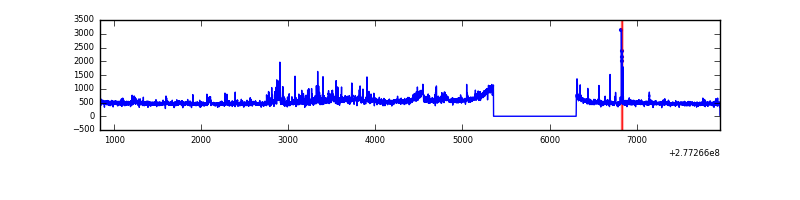 |
| C | 7121 | 6172 | 0 | 0 | 0.00% | 0.00% | 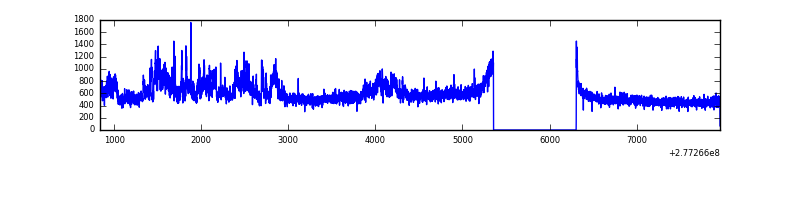 |
| D | 7121 | 6171 | 32 | 32 | 0.45% | 0.52% | 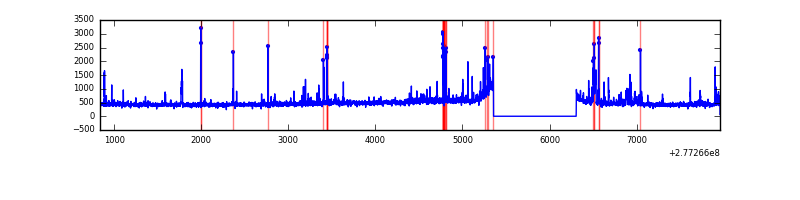 |
Top three noisy pixels from each quadrant. If the there are fewer than three noisy pixels in the level2.evt file, extra rows are filled as -1
| Pixel properties | Quadrant properties | ||||||
|---|---|---|---|---|---|---|---|
| Quadrant | DetID | PixID | Counts | Sigma | Mean | Median | Sigma |
| A | 15 | 174 | 413540 | 2660.14 | 760 | 745 | 155.2 |
| A | 0 | 226 | 6489 | 37.02 | 760 | 745 | 155.2 |
| A | 12 | 194 | 5551 | 30.97 | 760 | 745 | 155.2 |
| B | 3 | 209 | 79359 | 533.02 | 766 | 748 | 147.5 |
| B | 15 | 35 | 58124 | 389.04 | 766 | 748 | 147.5 |
| B | 0 | 198 | 55414 | 370.66 | 766 | 748 | 147.5 |
| C | 3 | 233 | 596804 | 3469.14 | 731 | 737 | 171.8 |
| C | 14 | 238 | 114493 | 662.07 | 731 | 737 | 171.8 |
| C | 7 | 247 | 104668 | 604.88 | 731 | 737 | 171.8 |
| D | 1 | 52 | 150879 | 830.76 | 738 | 718 | 180.8 |
| D | 2 | 33 | 95148 | 522.43 | 738 | 718 | 180.8 |
| D | 2 | 120 | 46560 | 253.62 | 738 | 718 | 180.8 |
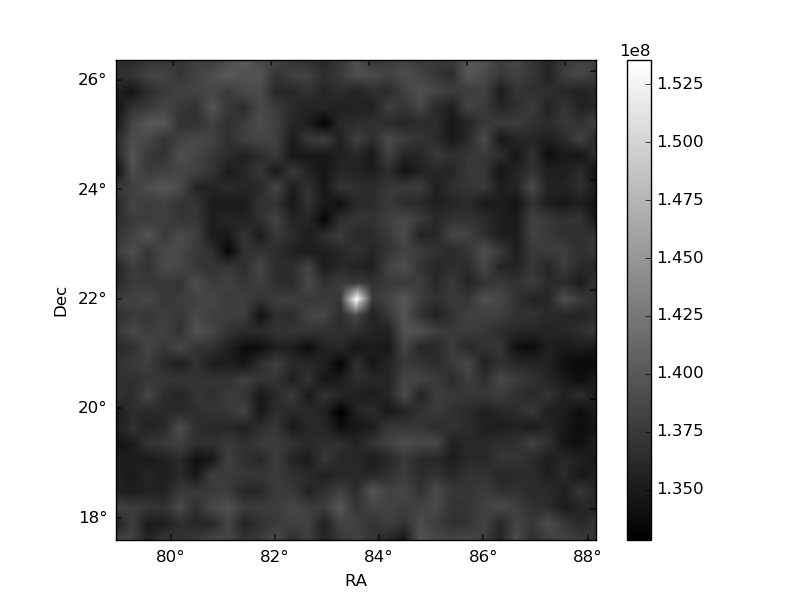
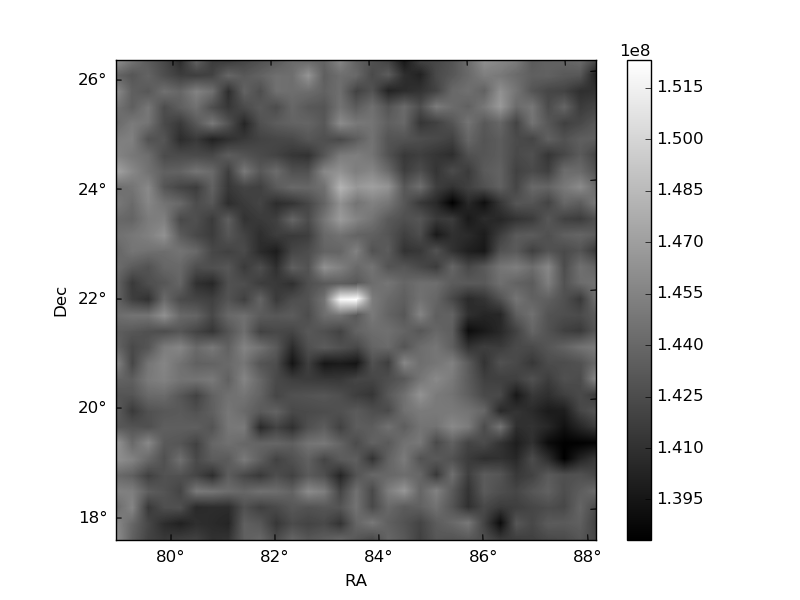
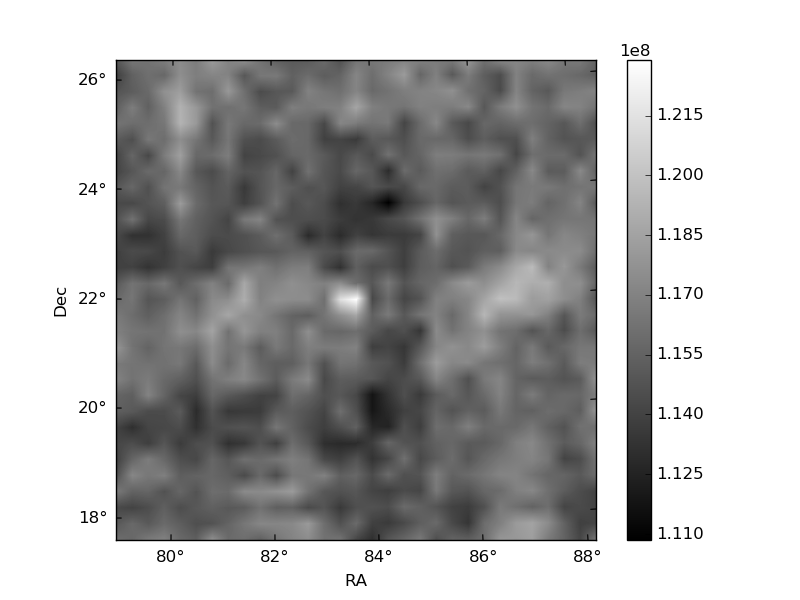
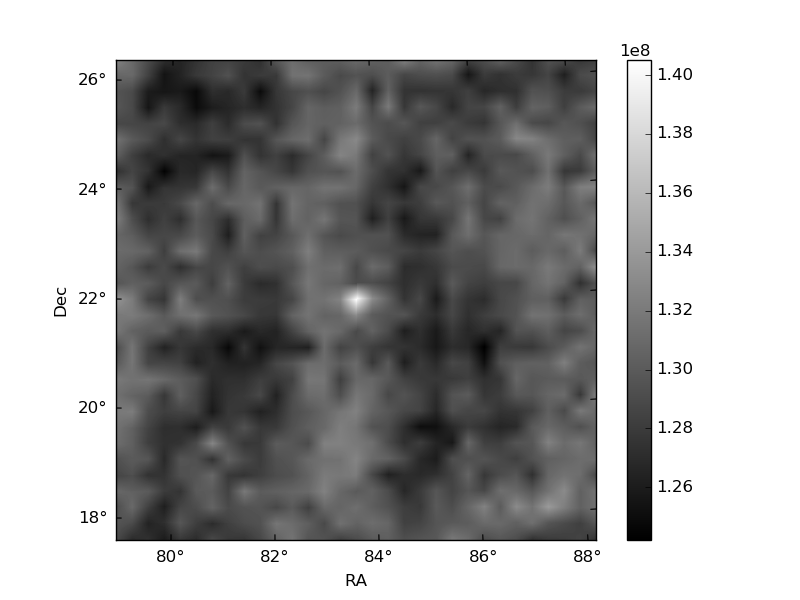
Histogram calculated using DETX and DETY for each event in the final _common_clean file
| Quadrant A |  |
 |
Quadrant B |
|---|---|---|---|
| Quadrant D |  |
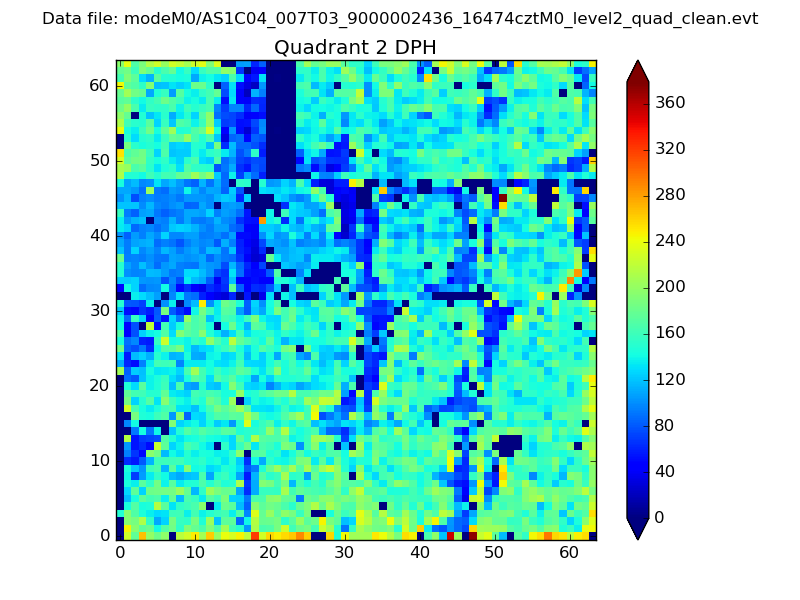 |
Quadrant C |
| Plot type | Count rate plots | Images |
|---|---|---|
| Comparison with Poisson distribution Blue bars denote a histogram of data divided into 1 sec bins. Red curve is a Poisson curve with rate = median count rate of data. |
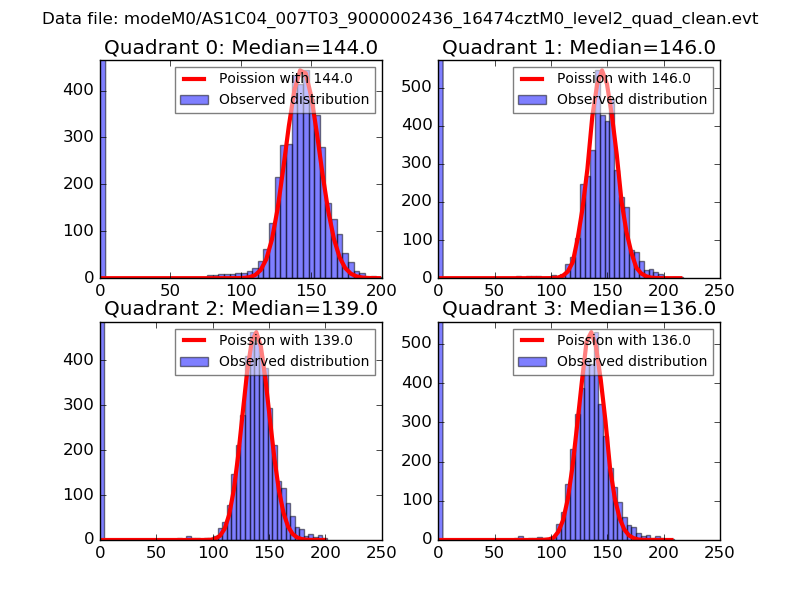 |
 |
| Quadrant-wise count rates Data is divided into 100 sec bins |
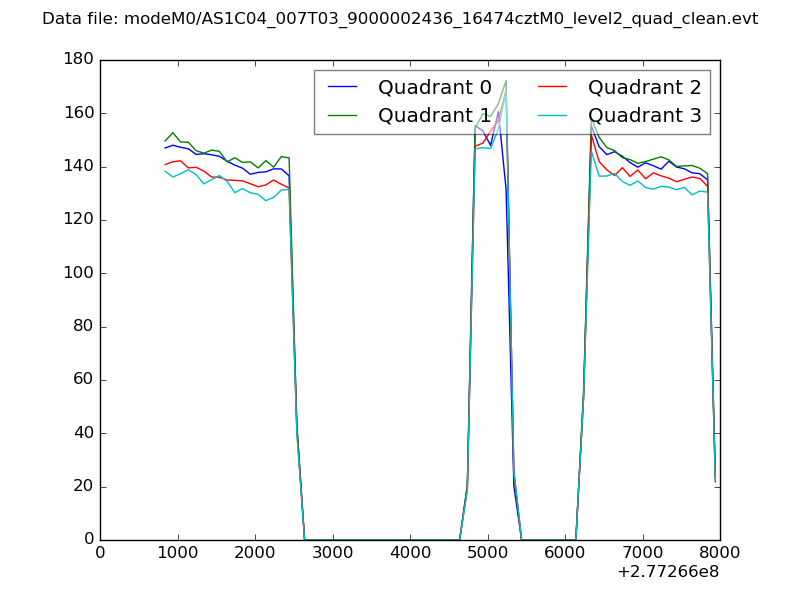 |
|
| Module-wise count rates for Quadrant A Data is divided into 100 sec bins |
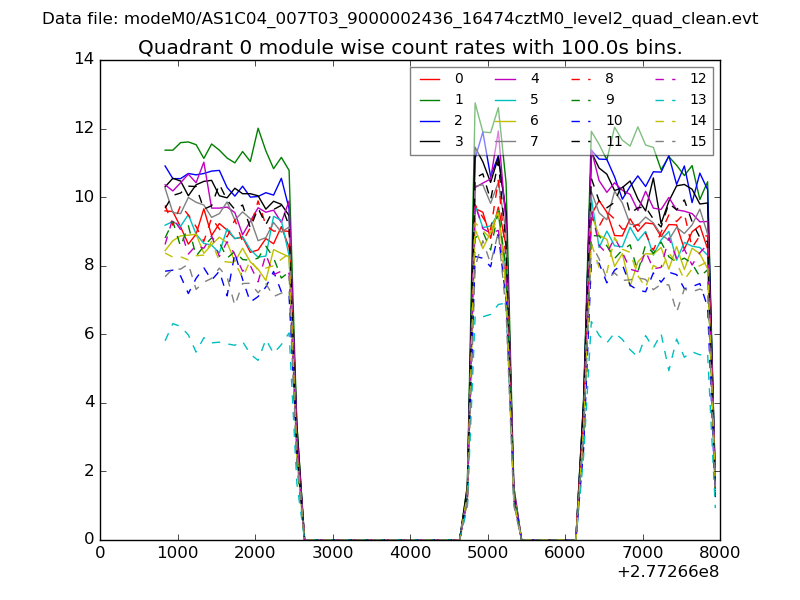 |
 |
| Module-wise count rates for Quadrant B Data is divided into 100 sec bins |
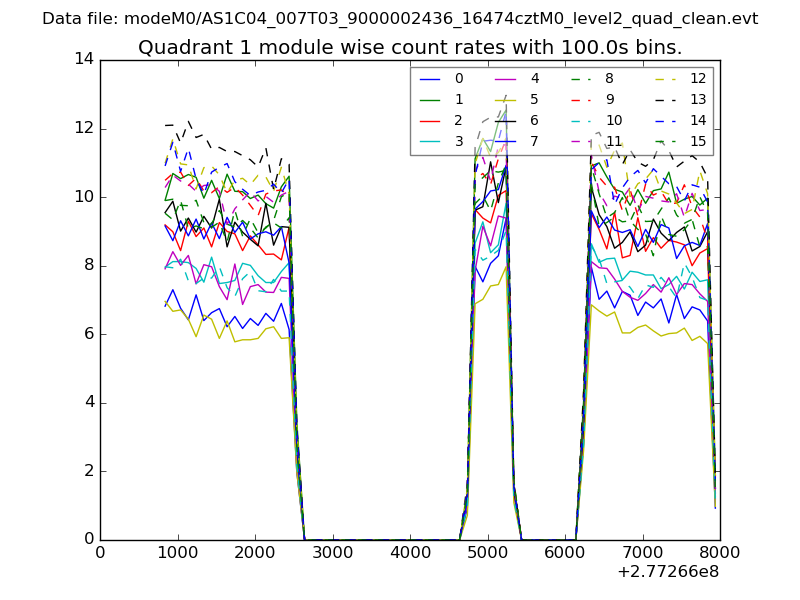 |
 |
| Module-wise count rates for Quadrant C Data is divided into 100 sec bins |
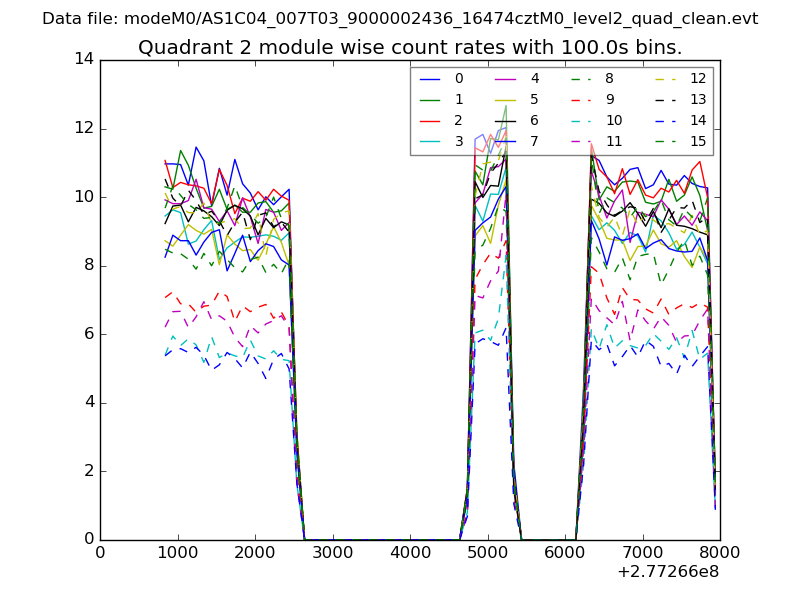 |
 |
| Module-wise count rates for Quadrant D Data is divided into 100 sec bins |
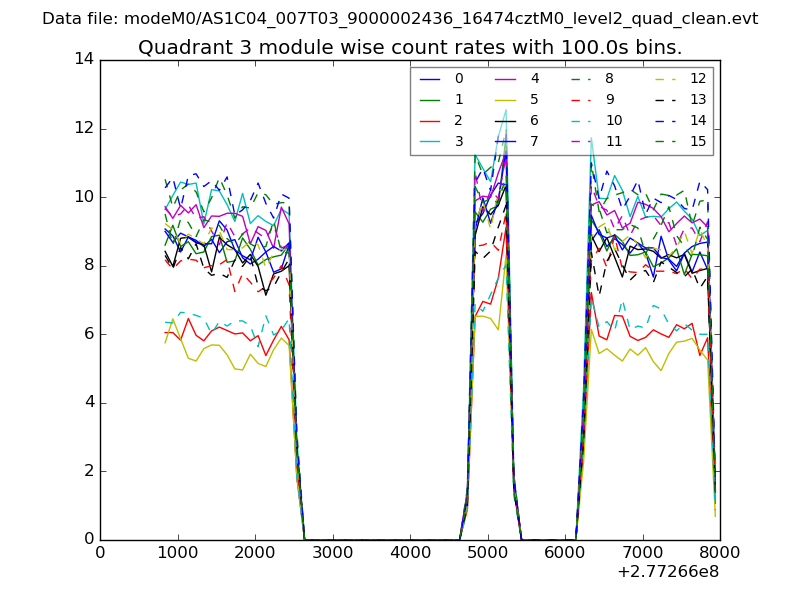 |
 |
| Parameter | Plot |
|---|---|
| CZT HV Monitor |  |
| D_VDD | 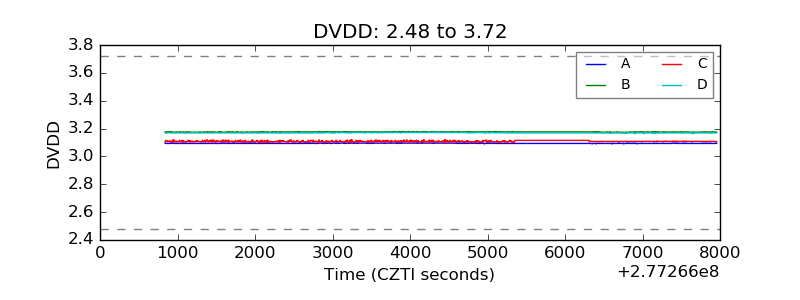 |
| Temperature 1 | 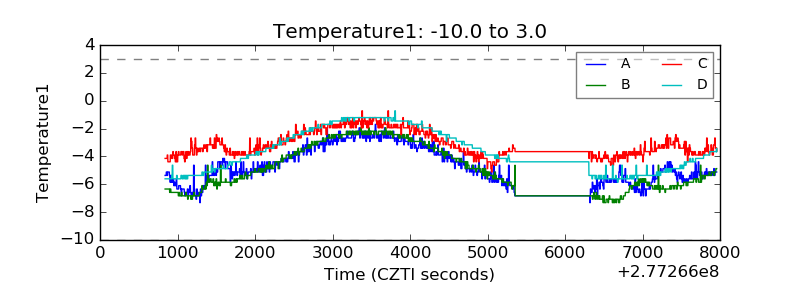 |
| Veto HV Monitor | 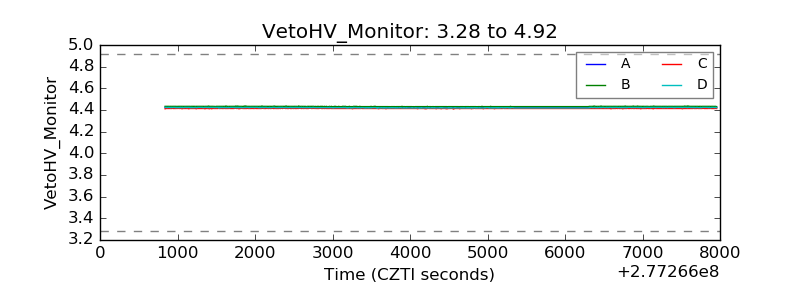 |
| Veto LLD | 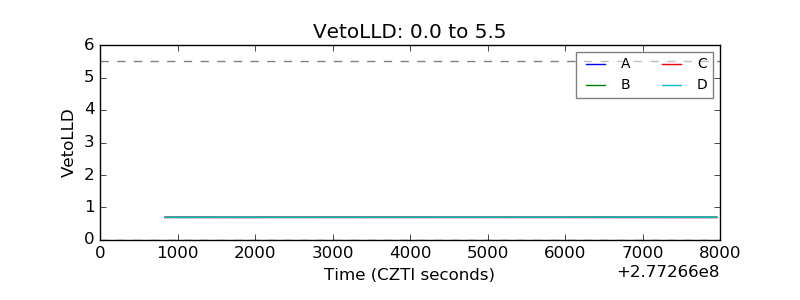 |
| Alpha Counter | 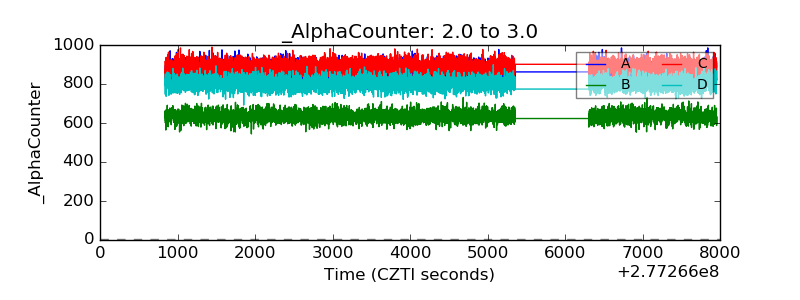 |
| _CPM_Rate | 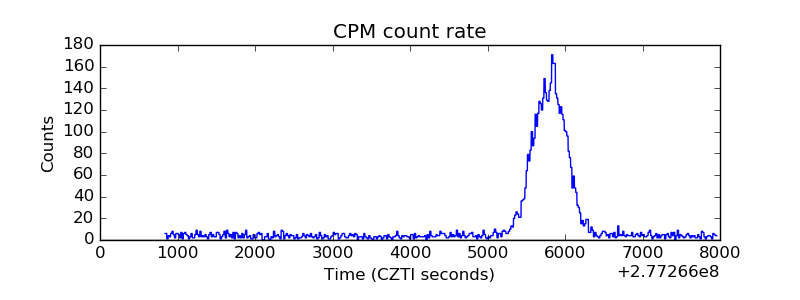 |
| CZT Counter | 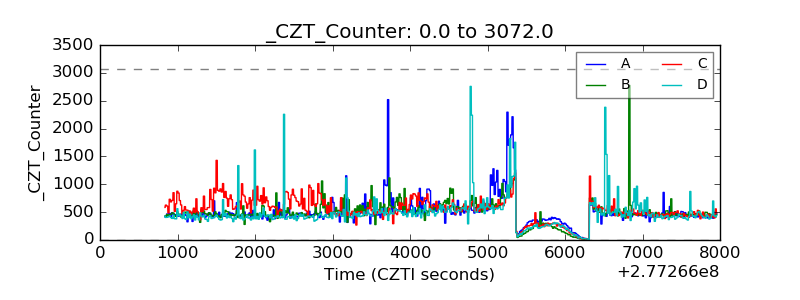 |
| +2.5 Volts monitor |  |
| +5 Volts monitor | 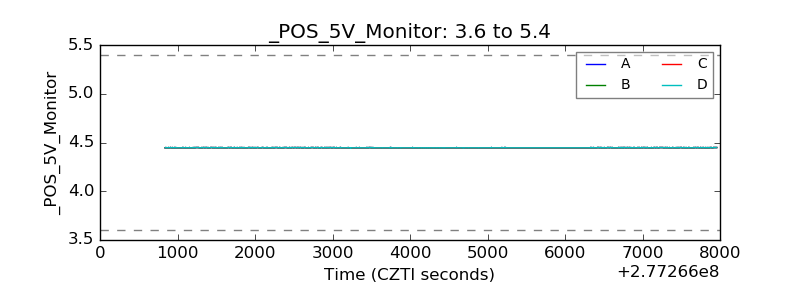 |
| _ROLL_ROT | 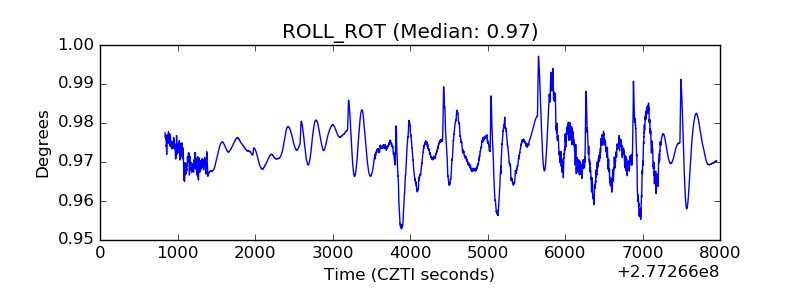 |
| _Roll_DEC | 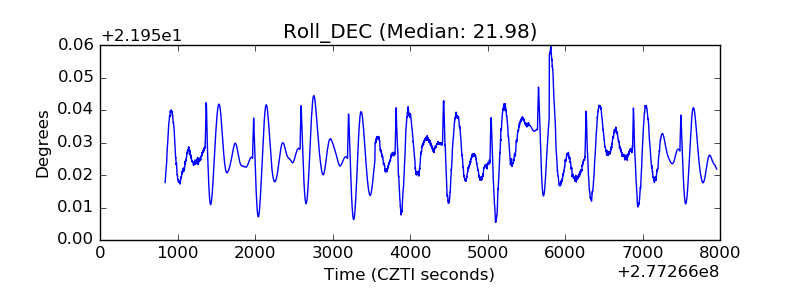 |
| _Roll_RA | 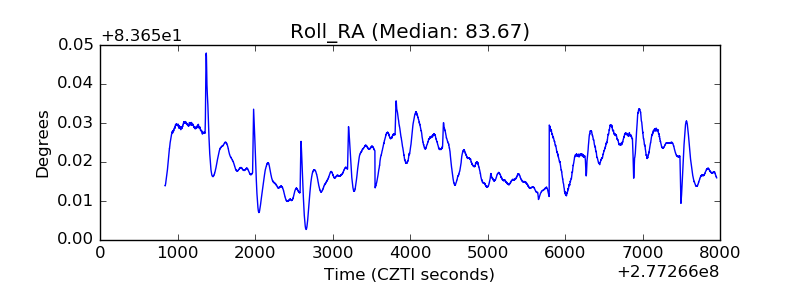 |
| Veto Counter | 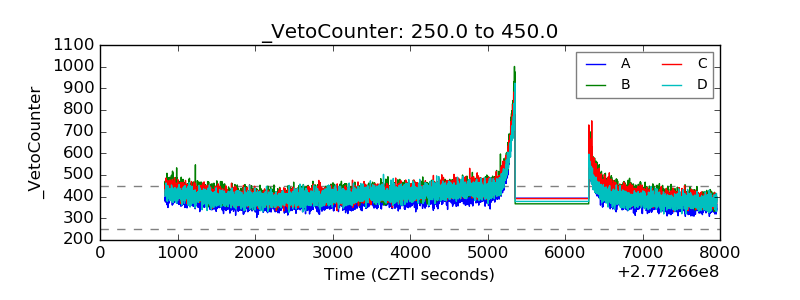 |