| Param | Original file | Final file |
|---|---|---|
| Filename | modeM0/AS1C04_007T03_9000002436_16475cztM0_level2.evt | modeM0/AS1C04_007T03_9000002436_16475cztM0_level2_quad_clean.evt |
| Size (bytes) | 525,225,600 | 94,812,480 |
| Size | 500.9 MB | 90.4 MB |
| Events in quadrant A | 3,456,339 | 626,952 |
| Events in quadrant B | 5,661,511 | 575,645 |
| Events in quadrant C | 3,212,844 | 621,760 |
| Events in quadrant D | 3,144,502 | 604,287 |
| Mode M0 | |||
|---|---|---|---|
| Quadrant | BADHDUFLAG | Total packets | Discarded packets |
| A | 0 | 16008 | 1648 |
| B | 0 | 24176 | 3366 |
| C | 0 | 14669 | 1396 |
| D | 0 | 15234 | 1651 |
| Mode SS | |||
|---|---|---|---|
| Quadrant | BADHDUFLAG | Total packets | Discarded packets |
| A | 0 | 144 | 14 |
| B | 0 | 144 | 12 |
| C | 0 | 144 | 8 |
| D | 0 | 144 | 20 |
| Mode M9 | |||
|---|---|---|---|
| Quadrant | BADHDUFLAG | Total packets | Discarded packets |
| A | 0 | 5 | 0 |
| B | 0 | 6 | 1 |
| C | 0 | 5 | 0 |
| D | 0 | 5 | 0 |
| Quadrant | Total seconds | Saturated seconds | Saturation percentage |
|---|---|---|---|
| A | 6350 | 223 | 3.511811% |
| B | 6187 | 1513 | 24.454501% |
| C | 6400 | 97 | 1.515625% |
| D | 6360 | 74 | 1.163522% |
Noise dominated data is calculated using 1-second bins in cleaned event files. If a bin has >2000 counts, and if more than 50% of those come from <1% of pixels, then it is considered to be noise-dominated and hence unusable.
| Quadrant | # 1 sec bins | Bins with >0 counts | Bins with >2000 counts | High rate bins dominated by noise | Noise dominated (total time) | Noise dominated (detector-on time) | Marked lightcurve |
|---|---|---|---|---|---|---|---|
| A | 7606 | 6836 | 99 | 99 | 1.30% | 1.45% | 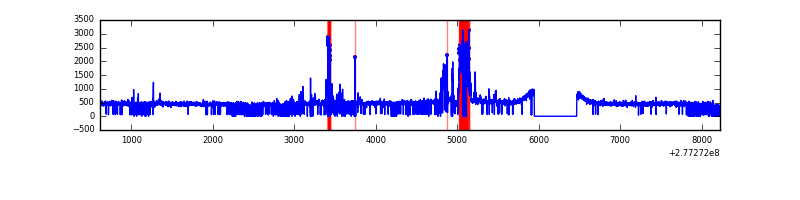 |
| B | 7600 | 6636 | 1037 | 1037 | 13.64% | 15.63% | 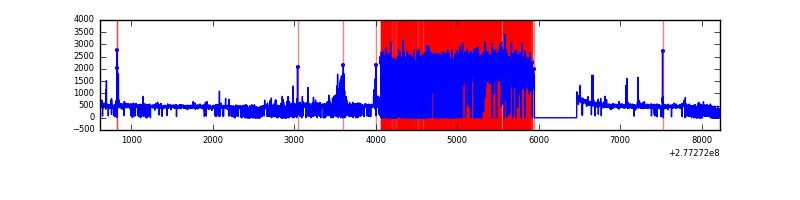 |
| C | 7610 | 6879 | 0 | 0 | 0.00% | 0.00% | 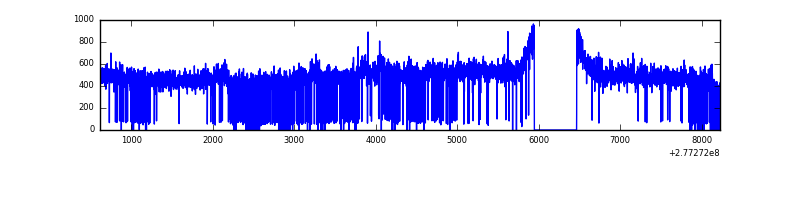 |
| D | 7598 | 6853 | 20 | 20 | 0.26% | 0.29% | 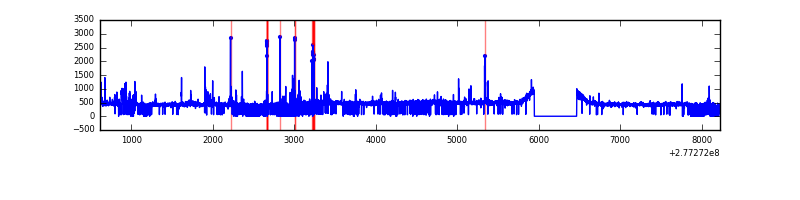 |
Top three noisy pixels from each quadrant. If the there are fewer than three noisy pixels in the level2.evt file, extra rows are filled as -1
| Pixel properties | Quadrant properties | ||||||
|---|---|---|---|---|---|---|---|
| Quadrant | DetID | PixID | Counts | Sigma | Mean | Median | Sigma |
| A | 15 | 174 | 455170 | 2850.48 | 781 | 765 | 159.4 |
| A | 0 | 226 | 6674 | 37.07 | 781 | 765 | 159.4 |
| A | 12 | 194 | 5743 | 31.23 | 781 | 765 | 159.4 |
| B | 5 | 65 | 2616611 | 19404.61 | 698 | 683 | 134.8 |
| B | 15 | 35 | 140092 | 1034.12 | 698 | 683 | 134.8 |
| B | 3 | 209 | 52189 | 382.06 | 698 | 683 | 134.8 |
| C | 3 | 233 | 138633 | 776.37 | 753 | 758 | 177.6 |
| C | 14 | 238 | 116984 | 654.46 | 753 | 758 | 177.6 |
| C | 7 | 247 | 22543 | 122.67 | 753 | 758 | 177.6 |
| D | 2 | 33 | 117648 | 625.17 | 760 | 740 | 187.0 |
| D | 1 | 52 | 69205 | 366.12 | 760 | 740 | 187.0 |
| D | 10 | 70 | 40902 | 214.77 | 760 | 740 | 187.0 |
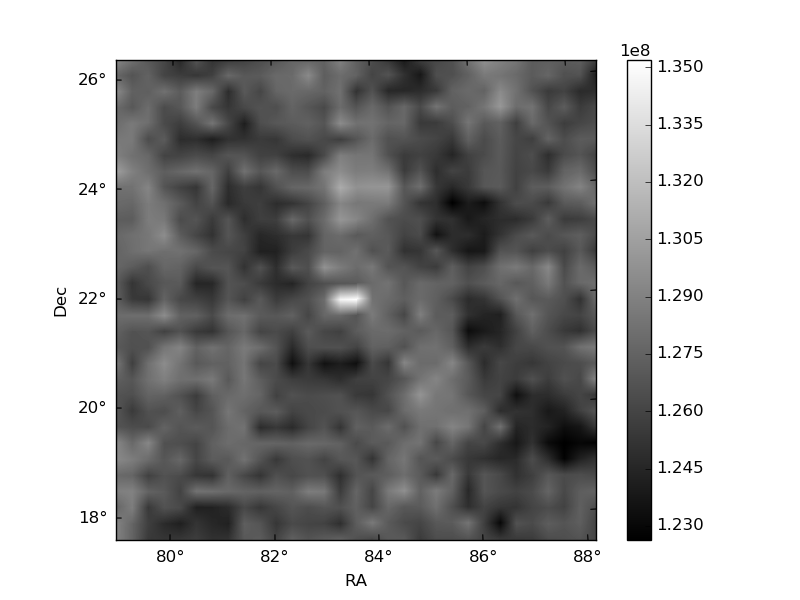
Histogram calculated using DETX and DETY for each event in the final _common_clean file
| Quadrant A | 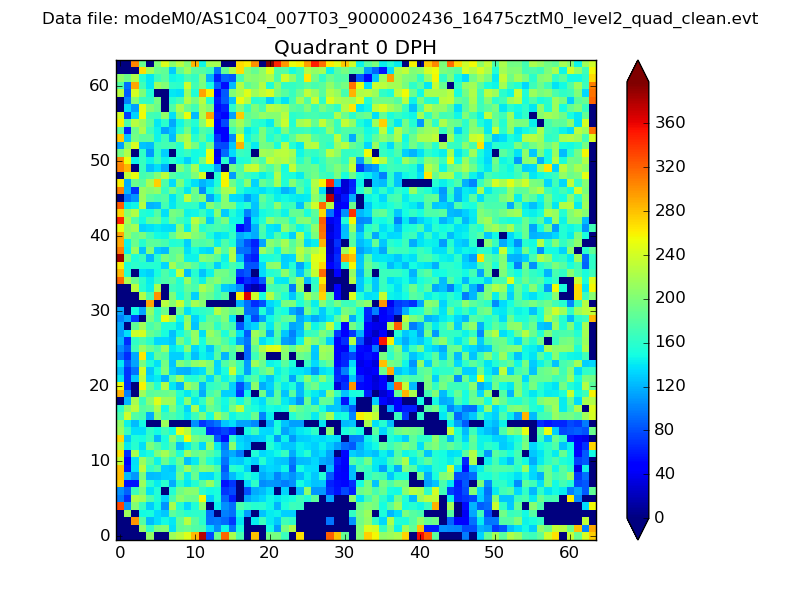 |
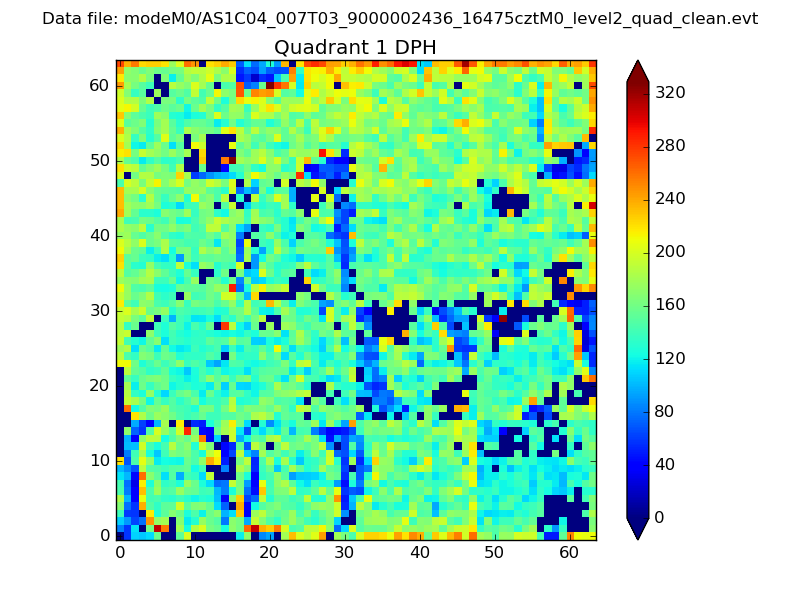 |
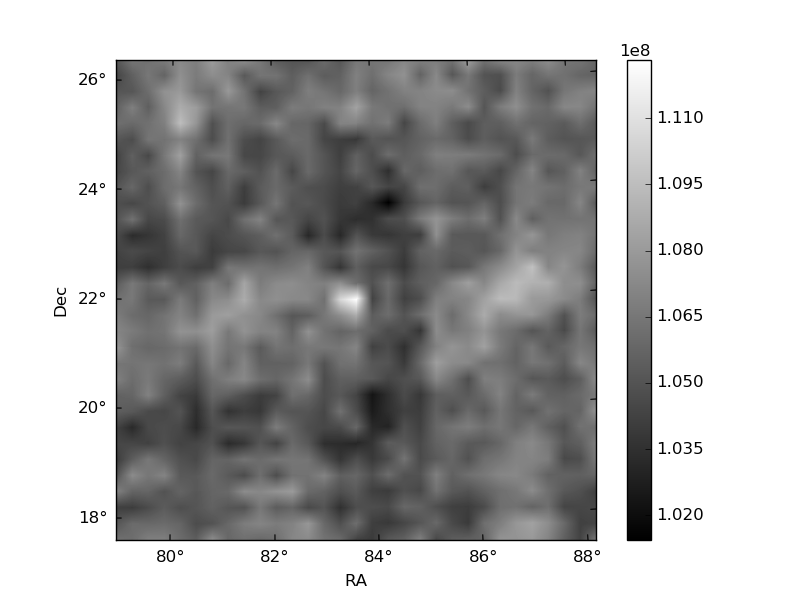
Quadrant B |
|---|---|---|---|
| Quadrant D | 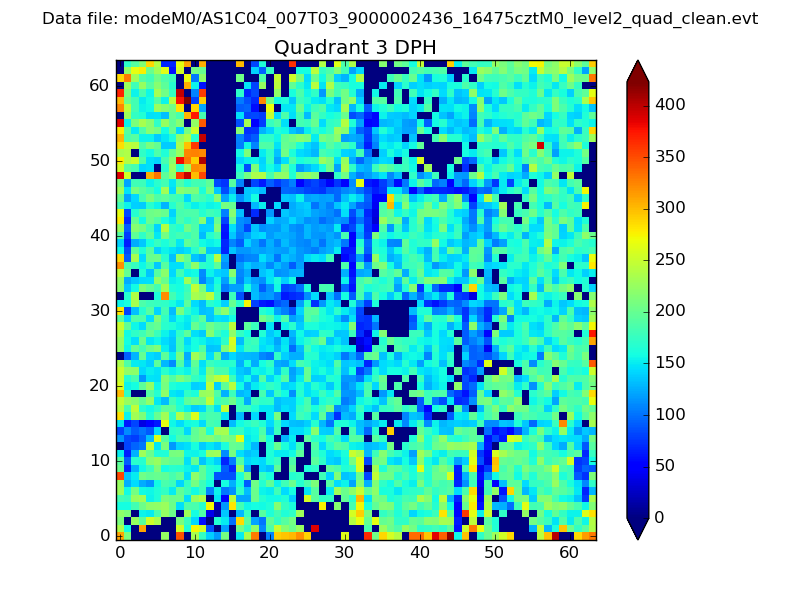 |
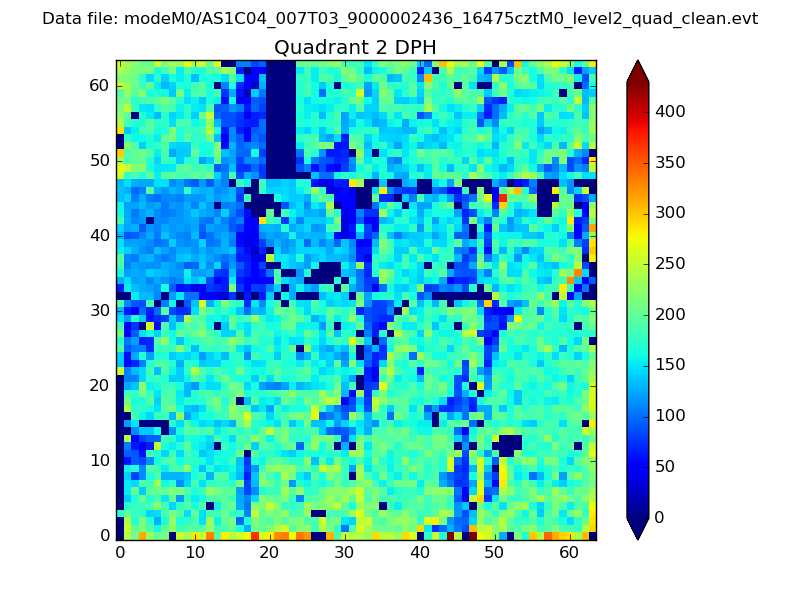 |
Quadrant C |
| Plot type | Count rate plots | Images |
|---|---|---|
| Comparison with Poisson distribution Blue bars denote a histogram of data divided into 1 sec bins. Red curve is a Poisson curve with rate = median count rate of data. |
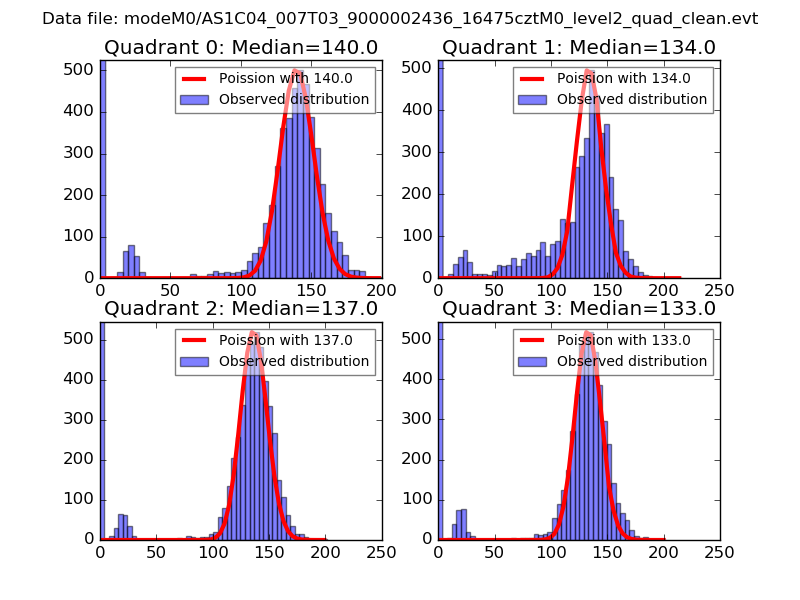 |
 |
| Quadrant-wise count rates Data is divided into 100 sec bins |
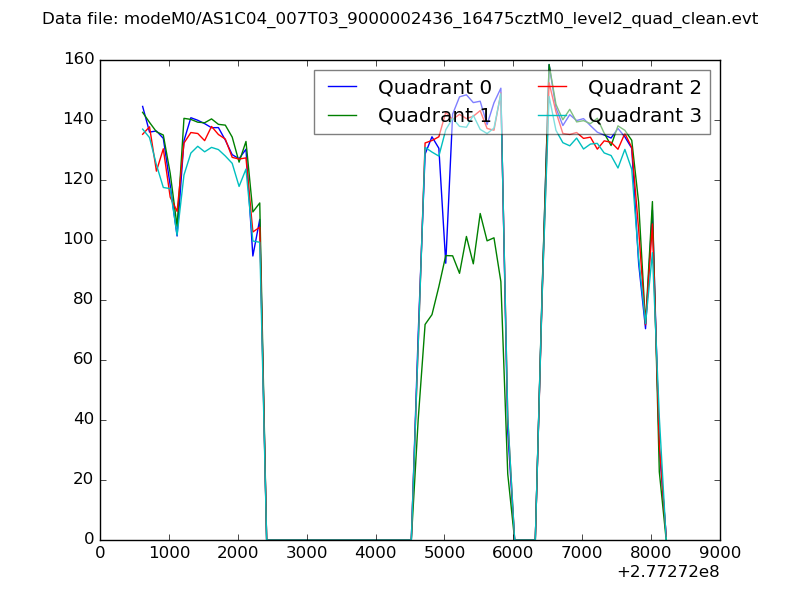 |
|
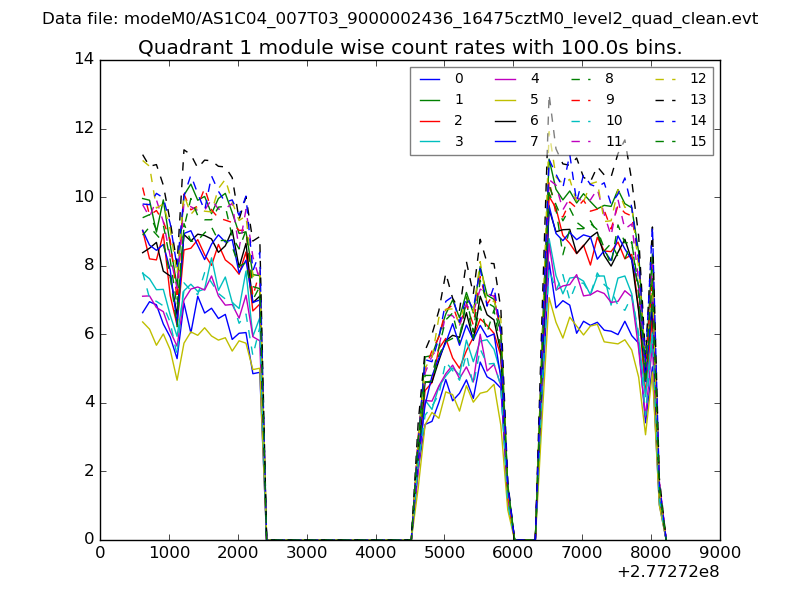
| Module-wise count rates for Quadrant A Data is divided into 100 sec bins |
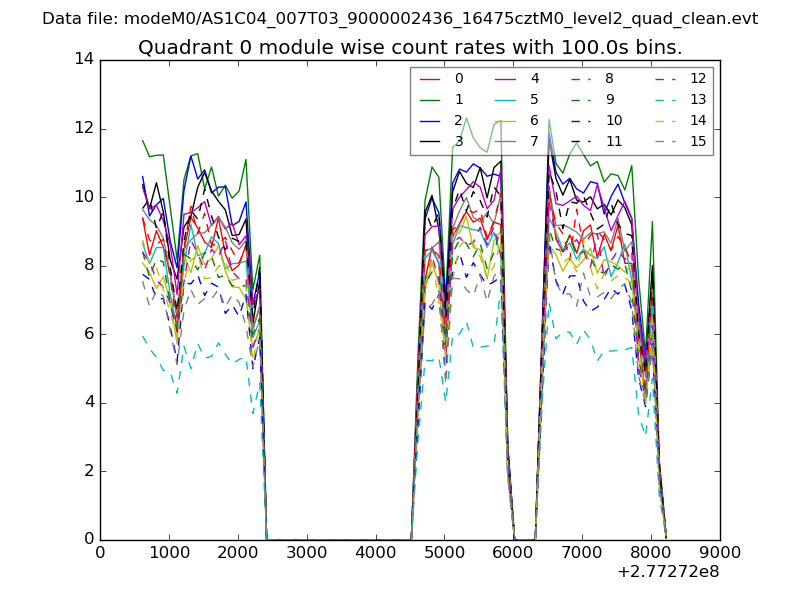 |
 |
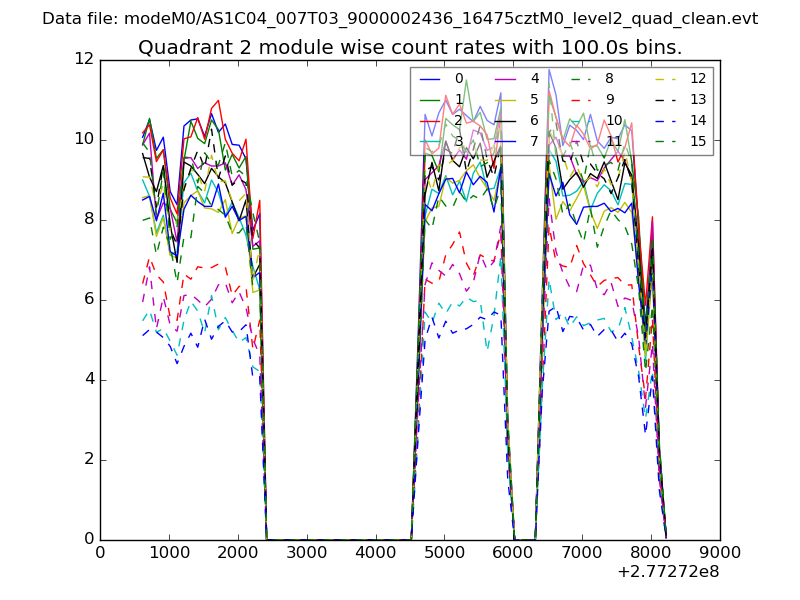
| Module-wise count rates for Quadrant B Data is divided into 100 sec bins |
 |
 |
| Module-wise count rates for Quadrant C Data is divided into 100 sec bins |
 |
 |
| Module-wise count rates for Quadrant D Data is divided into 100 sec bins |
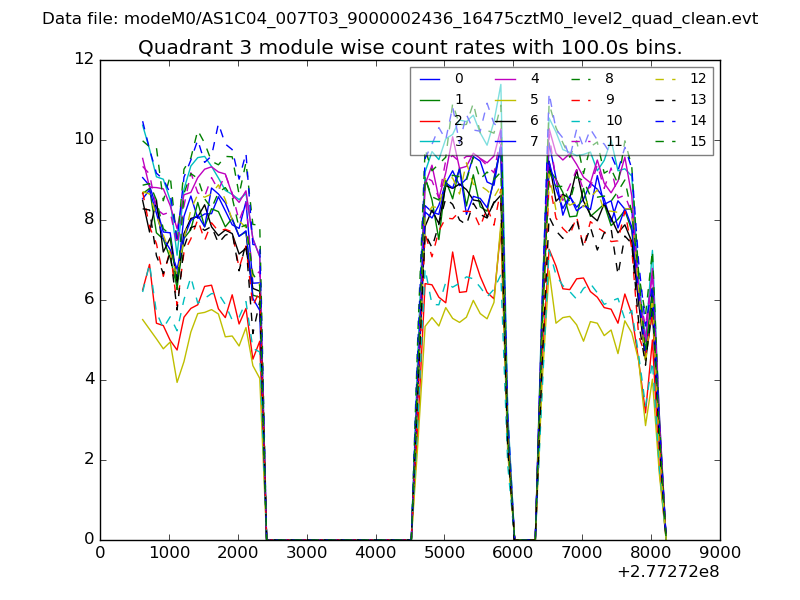 |
 |
| Parameter | Plot |
|---|---|
| CZT HV Monitor | 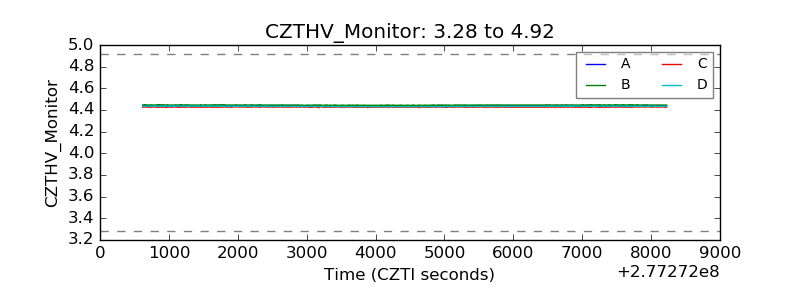 |
| D_VDD | 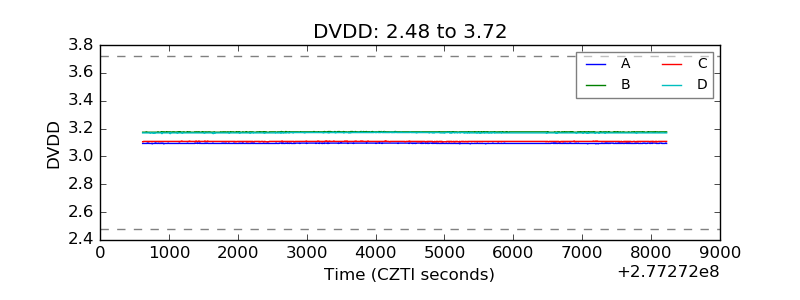 |
| Temperature 1 | 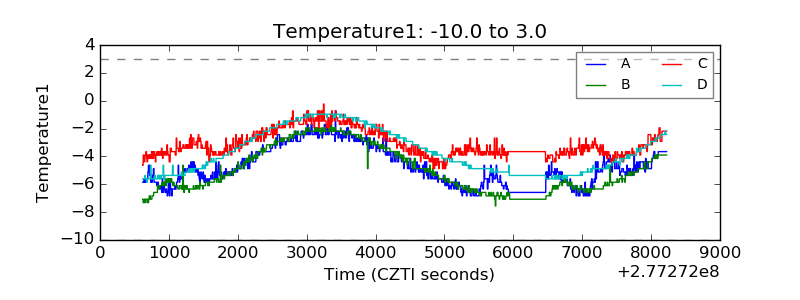 |
| Veto HV Monitor | 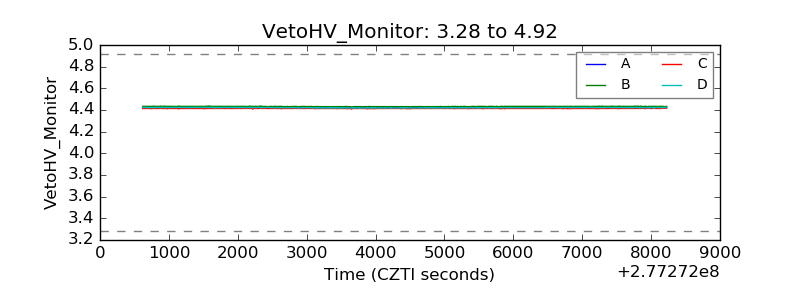 |
| Veto LLD |  |
| Alpha Counter | 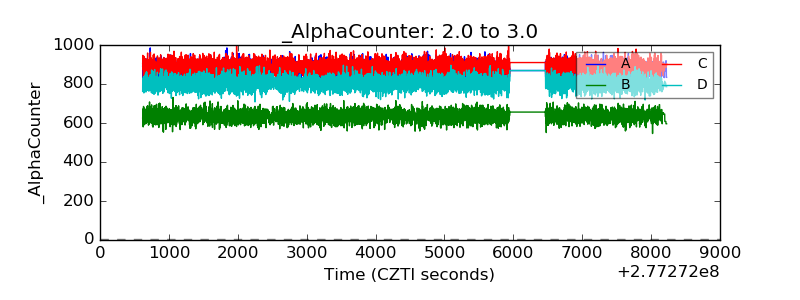 |
| _CPM_Rate | 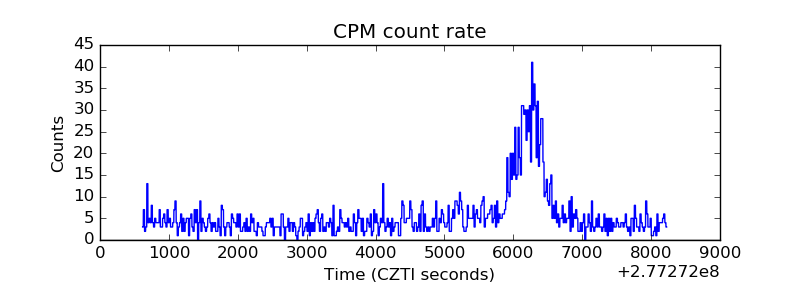 |
| CZT Counter | 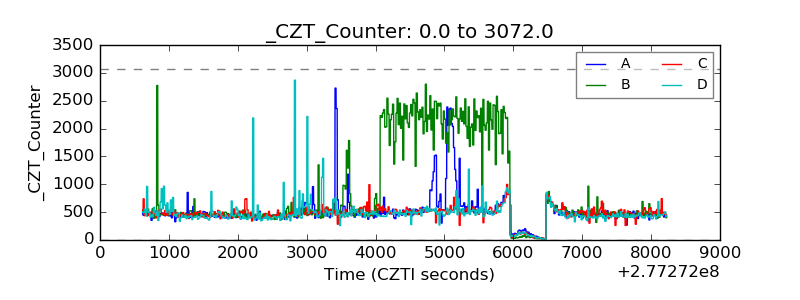 |
| +2.5 Volts monitor |  |
| +5 Volts monitor | 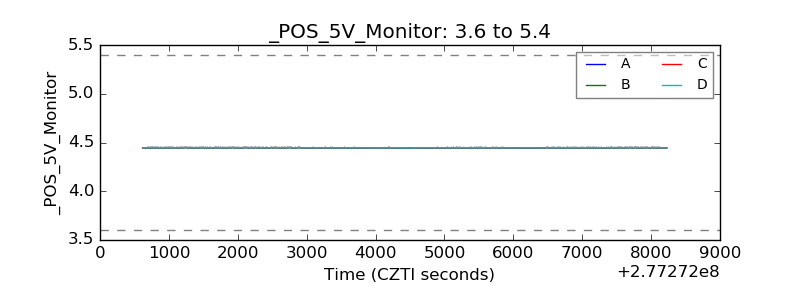 |
| _ROLL_ROT | 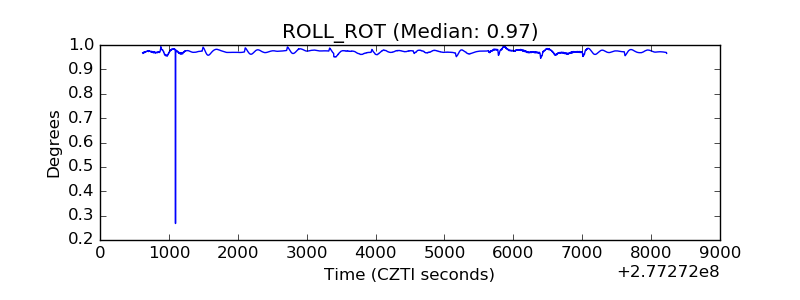 |
| _Roll_DEC | 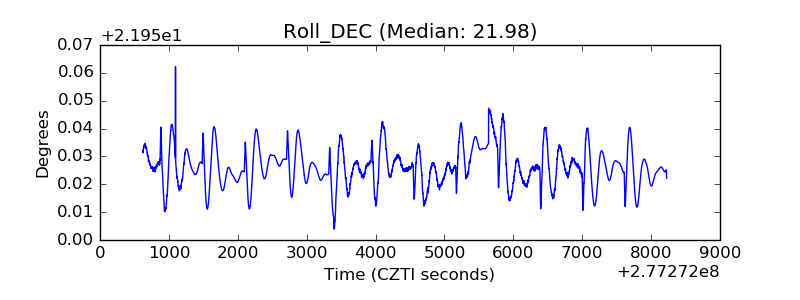 |
| _Roll_RA | 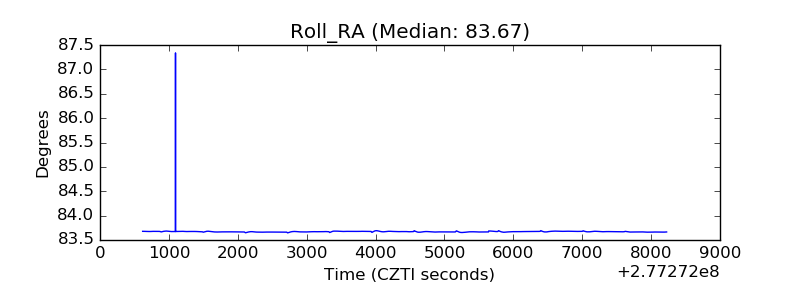 |
| Veto Counter | 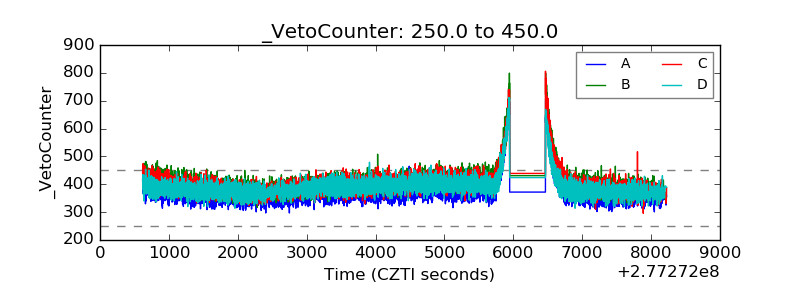 |