| Param | Original file | Final file |
|---|---|---|
| Filename | modeM0/AS1C04_007T03_9000002436_16476cztM0_level2.evt | modeM0/AS1C04_007T03_9000002436_16476cztM0_level2_quad_clean.evt |
| Size (bytes) | 766,272,960 | 106,548,480 |
| Size | 730.8 MB | 101.6 MB |
| Events in quadrant A | 5,438,495 | 658,072 |
| Events in quadrant B | 7,904,120 | 620,416 |
| Events in quadrant C | 4,663,039 | 658,934 |
| Events in quadrant D | 4,571,823 | 644,661 |
| Mode M0 | |||
|---|---|---|---|
| Quadrant | BADHDUFLAG | Total packets | Discarded packets |
| A | 0 | 22180 | 1 |
| B | 0 | 29503 | 1 |
| C | 0 | 19171 | 1 |
| D | 0 | 19741 | 1 |
| Mode SS | |||
|---|---|---|---|
| Quadrant | BADHDUFLAG | Total packets | Discarded packets |
| A | 0 | 188 | 0 |
| B | 0 | 188 | 0 |
| C | 0 | 188 | 0 |
| D | 0 | 188 | 0 |
| Mode M9 | |||
|---|---|---|---|
| Quadrant | BADHDUFLAG | Total packets | Discarded packets |
| A | 0 | 5 | 0 |
| B | 0 | 5 | 0 |
| C | 0 | 5 | 0 |
| D | 0 | 5 | 0 |
| Quadrant | Total seconds | Saturated seconds | Saturation percentage |
|---|---|---|---|
| A | 9282 | 440 | 4.740358% |
| B | 9282 | 1801 | 19.403146% |
| C | 9282 | 117 | 1.260504% |
| D | 9282 | 95 | 1.023486% |
Noise dominated data is calculated using 1-second bins in cleaned event files. If a bin has >2000 counts, and if more than 50% of those come from <1% of pixels, then it is considered to be noise-dominated and hence unusable.
| Quadrant | # 1 sec bins | Bins with >0 counts | Bins with >2000 counts | High rate bins dominated by noise | Noise dominated (total time) | Noise dominated (detector-on time) | Marked lightcurve |
|---|---|---|---|---|---|---|---|
| A | 9803 | 9283 | 296 | 296 | 3.02% | 3.19% | 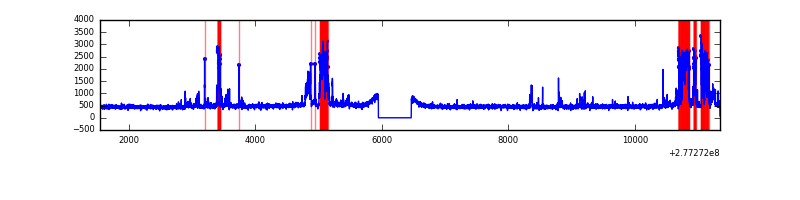 |
| B | 9803 | 9283 | 1269 | 1269 | 12.95% | 13.67% | 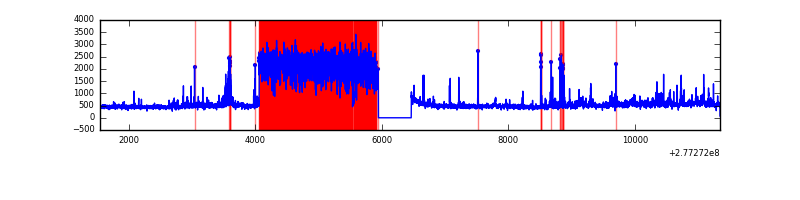 |
| C | 9803 | 9284 | 0 | 0 | 0.00% | 0.00% | 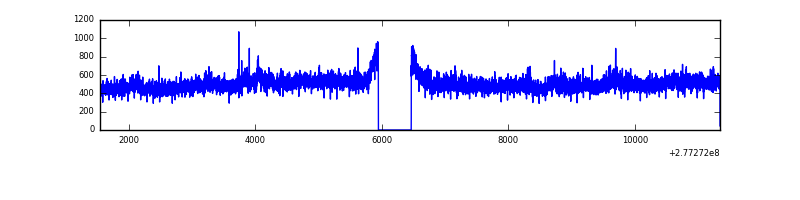 |
| D | 9803 | 9284 | 44 | 44 | 0.45% | 0.47% | 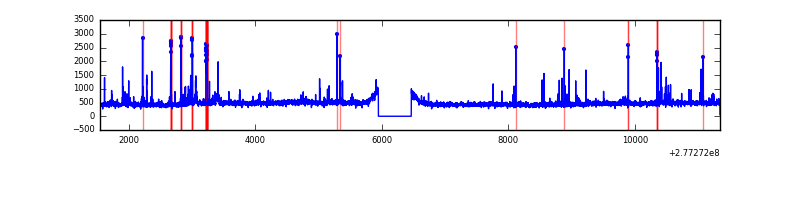 |
Top three noisy pixels from each quadrant. If the there are fewer than three noisy pixels in the level2.evt file, extra rows are filled as -1
| Pixel properties | Quadrant properties | ||||||
|---|---|---|---|---|---|---|---|
| Quadrant | DetID | PixID | Counts | Sigma | Mean | Median | Sigma |
| A | 15 | 174 | 1132219 | 4968.17 | 1120 | 1095 | 227.7 |
| A | 0 | 226 | 9569 | 37.22 | 1120 | 1095 | 227.7 |
| A | 12 | 194 | 8303 | 31.66 | 1120 | 1095 | 227.7 |
| B | 5 | 65 | 3115622 | 15424.19 | 1054 | 1029 | 201.9 |
| B | 15 | 35 | 242687 | 1196.75 | 1054 | 1029 | 201.9 |
| B | 3 | 209 | 140578 | 691.08 | 1054 | 1029 | 201.9 |
| C | 3 | 233 | 250524 | 985.52 | 1082 | 1091 | 253.1 |
| C | 14 | 238 | 168085 | 659.8 | 1082 | 1091 | 253.1 |
| C | 7 | 247 | 27178 | 103.07 | 1082 | 1091 | 253.1 |
| D | 2 | 33 | 120592 | 442.74 | 1102 | 1074 | 269.9 |
| D | 1 | 52 | 114969 | 421.91 | 1102 | 1074 | 269.9 |
| D | 13 | 168 | 74246 | 271.06 | 1102 | 1074 | 269.9 |
Histogram calculated using DETX and DETY for each event in the final _common_clean file
| Quadrant A |  |
 |
Quadrant B |
|---|---|---|---|
| Quadrant D |  |
 |
Quadrant C |
| Plot type | Count rate plots | Images |
|---|---|---|
| Comparison with Poisson distribution Blue bars denote a histogram of data divided into 1 sec bins. Red curve is a Poisson curve with rate = median count rate of data. |
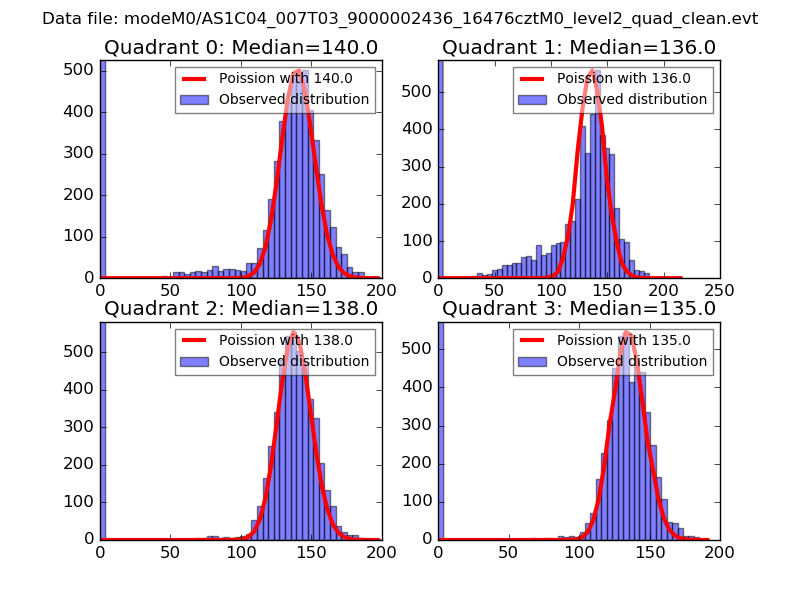 |
 |
| Quadrant-wise count rates Data is divided into 100 sec bins |
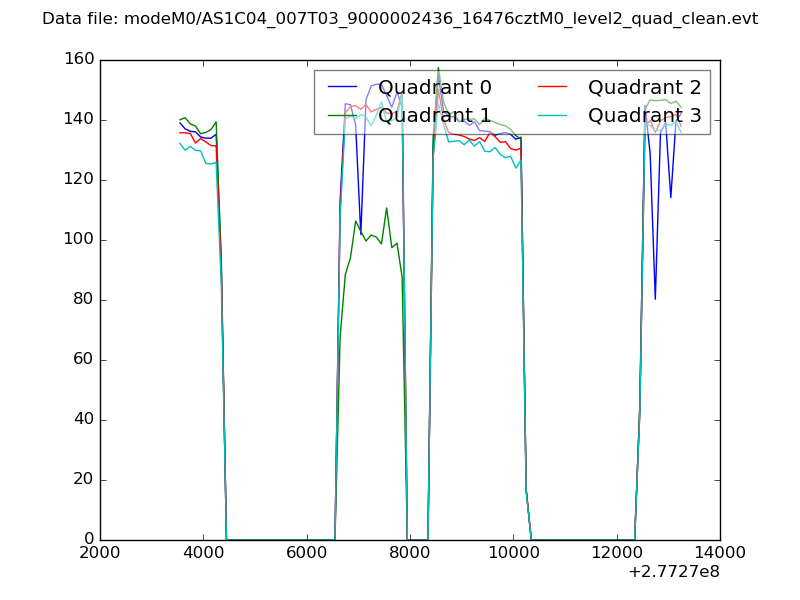 |
|
| Module-wise count rates for Quadrant A Data is divided into 100 sec bins |
 |
 |
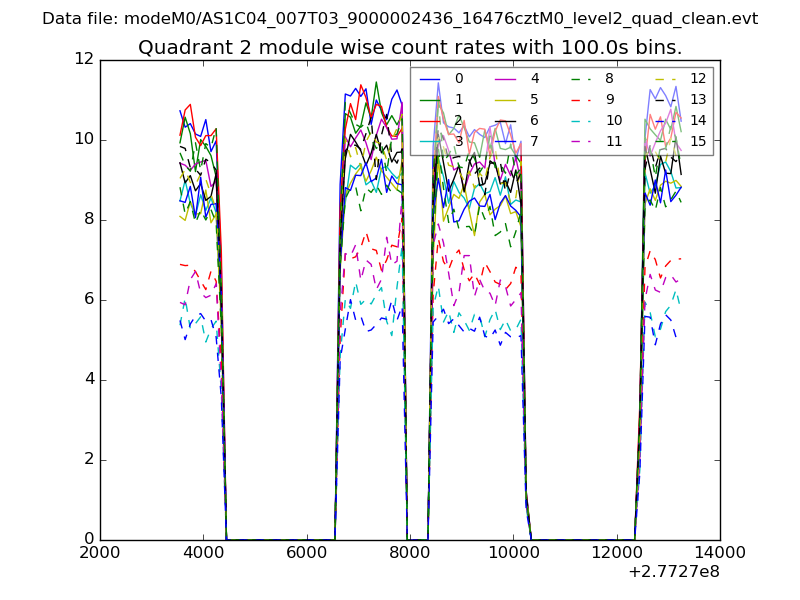
| Module-wise count rates for Quadrant B Data is divided into 100 sec bins |
 |
 |
| Module-wise count rates for Quadrant C Data is divided into 100 sec bins |
 |
 |
| Module-wise count rates for Quadrant D Data is divided into 100 sec bins |
 |
 |
| Parameter | Plot |
|---|---|
| CZT HV Monitor |  |
| D_VDD |  |
| Temperature 1 |  |
| Veto HV Monitor |  |
| Veto LLD |  |
| Alpha Counter | 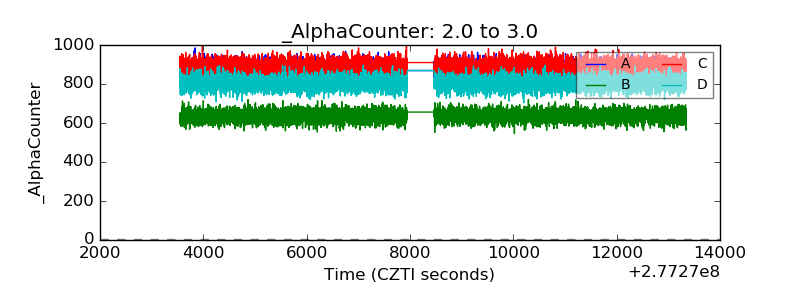 |
| _CPM_Rate | 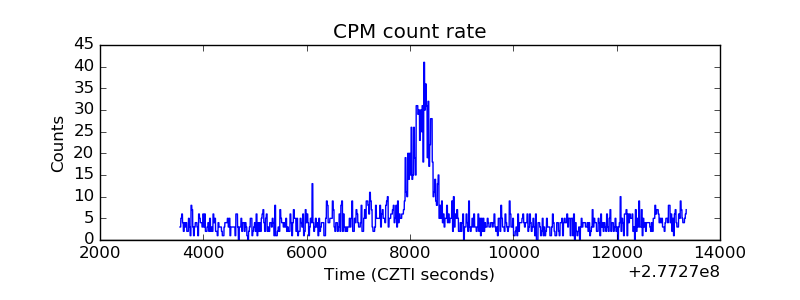 |
| CZT Counter |  |
| +2.5 Volts monitor |  |
| +5 Volts monitor |  |
| _ROLL_ROT |  |
| _Roll_DEC |  |
| _Roll_RA |  |
| Veto Counter |  |