| Param | Original file | Final file |
|---|---|---|
| Filename | modeM0/AS1C04_008T01_9000002434cztM0_level2.fits | modeM0/AS1C04_008T01_9000002434cztM0_level2_quad_clean.evt |
| Size (bytes) | 327,499,200 | 352,831,680 |
| Size | 312.3 MB | 336.5 MB |
| Events in quadrant A | 2,001,920 | 2,179,823 |
| Events in quadrant B | 1,929,894 | 2,202,906 |
| Events in quadrant C | 1,982,760 | 2,099,553 |
| Events in quadrant D | 1,715,484 | 1,915,465 |
| Mode M0 | |||
|---|---|---|---|
| Quadrant | BADHDUFLAG | Total packets | Discarded packets |
| A | 0 | 74810 | 0 |
| B | 0 | 77134 | 0 |
| C | 0 | 72844 | 0 |
| D | 0 | 77341 | 0 |
| Mode SS | |||
|---|---|---|---|
| Quadrant | BADHDUFLAG | Total packets | Discarded packets |
| A | 0 | 678 | 0 |
| B | 0 | 678 | 0 |
| C | 0 | 678 | 0 |
| D | 0 | 678 | 0 |
| Mode M9 | |||
|---|---|---|---|
| Quadrant | BADHDUFLAG | Total packets | Discarded packets |
| A | 0 | 70 | 0 |
| B | 0 | 70 | 0 |
| C | 0 | 70 | 0 |
| D | 0 | 70 | 0 |
| Quadrant | Total seconds | Saturated seconds | Saturation percentage |
|---|---|---|---|
| A | 33312 | 479 | 1.437920% |
| B | 33312 | 537 | 1.612032% |
| C | 33312 | 515 | 1.545989% |
| D | 33312 | 765 | 2.296470% |
Noise dominated data is calculated using 1-second bins in cleaned event files. If a bin has >2000 counts, and if more than 50% of those come from <1% of pixels, then it is considered to be noise-dominated and hence unusable.
| Quadrant | # 1 sec bins | Bins with >0 counts | Bins with >2000 counts | High rate bins dominated by noise | Noise dominated (total time) | Noise dominated (detector-on time) | Marked lightcurve |
|---|---|---|---|---|---|---|---|
| A | 40202 | 33306 | 0 | 0 | 0.00% | 0.00% |  |
| B | 40202 | 33306 | 0 | 0 | 0.00% | 0.00% | 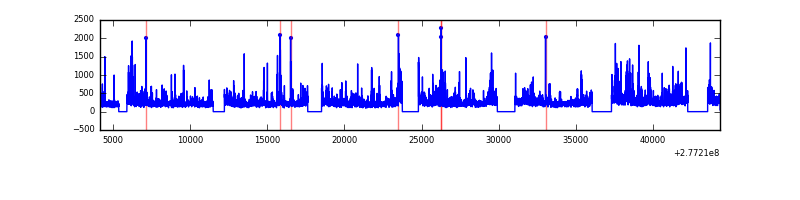 |
| C | 40202 | 33306 | 0 | 0 | 0.00% | 0.00% |  |
| D | 40202 | 33292 | 0 | 0 | 0.00% | 0.00% |  |
Top three noisy pixels from each quadrant. If the there are fewer than three noisy pixels in the level2.evt file, extra rows are filled as -1
| Pixel properties | Quadrant properties | ||||||
|---|---|---|---|---|---|---|---|
| Quadrant | DetID | PixID | Counts | Sigma | Mean | Median | Sigma |
| A | 14 | 188 | 2168 | 12.98 | 519 | 487 | 129.5 |
| A | 0 | 29 | 2007 | 11.74 | 519 | 487 | 129.5 |
| A | 14 | 204 | 1818 | 10.28 | 519 | 487 | 129.5 |
| B | 2 | 9 | 1518 | 10.29 | 509 | 486 | 100.3 |
| B | 2 | 8 | 1325 | 8.37 | 509 | 486 | 100.3 |
| B | 14 | 254 | 1291 | 8.03 | 509 | 486 | 100.3 |
| C | 1 | 81 | 1591 | 8.02 | 523 | 487 | 137.7 |
| C | 1 | 80 | 1556 | 7.76 | 523 | 487 | 137.7 |
| C | 12 | 241 | 1382 | 6.5 | 523 | 487 | 137.7 |
| D | 6 | 38 | 1238 | 5.93 | 489 | 443 | 134.0 |
| D | 10 | 189 | 1230 | 5.87 | 489 | 443 | 134.0 |
| D | 6 | 231 | 1222 | 5.81 | 489 | 443 | 134.0 |
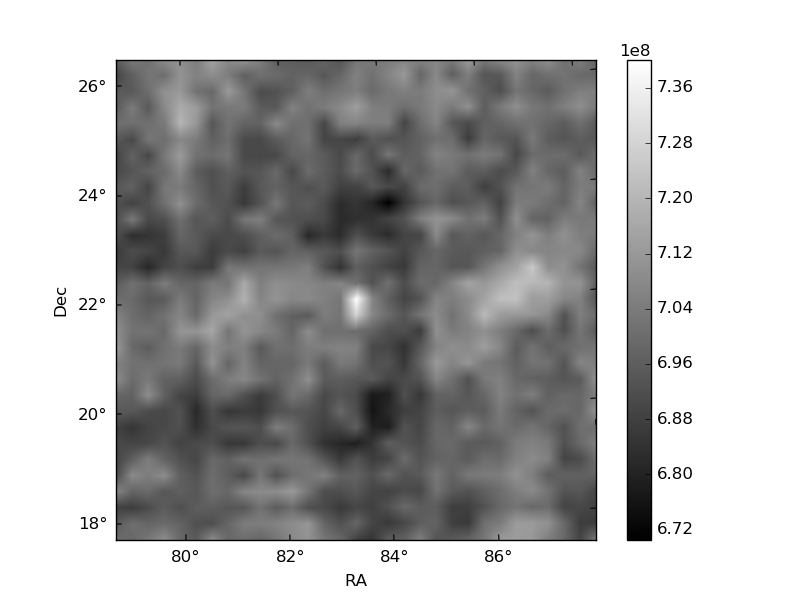
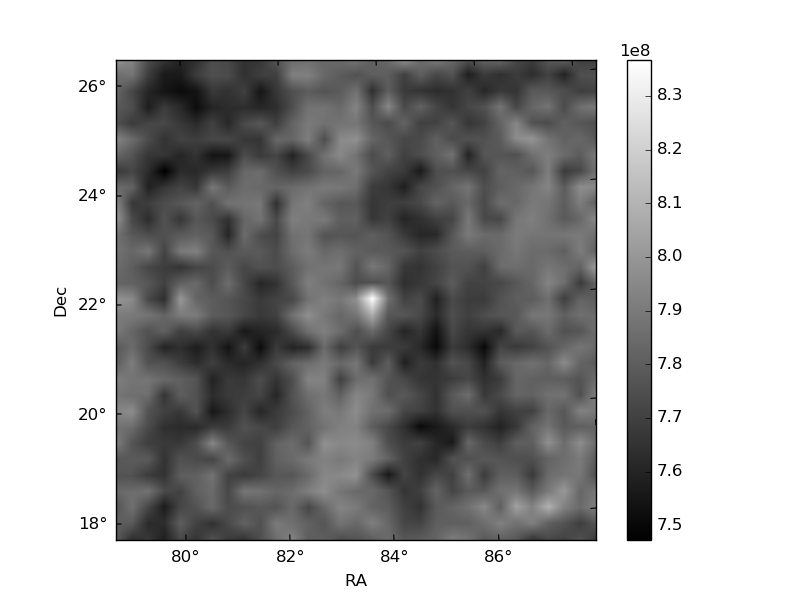
Histogram calculated using DETX and DETY for each event in the final _common_clean file
| Quadrant A | 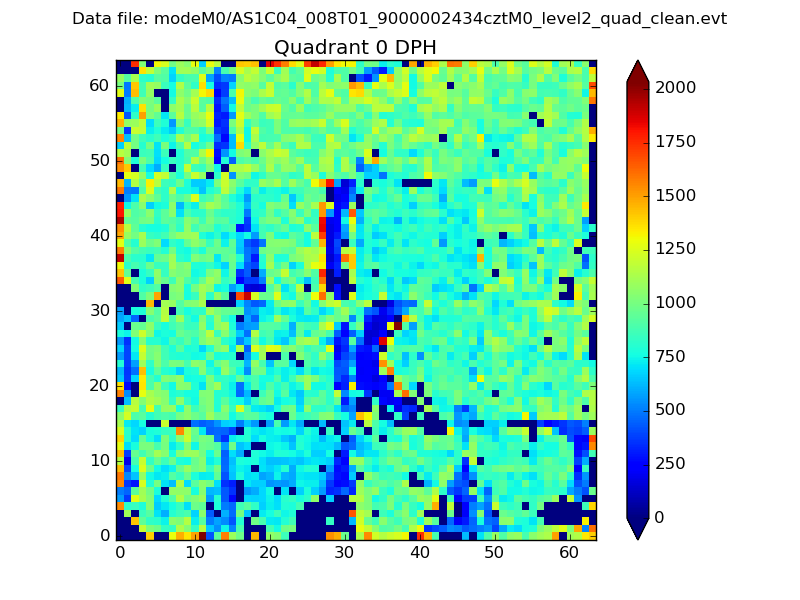 |
 |
Quadrant B |
|---|---|---|---|
| Quadrant D |  |
 |
Quadrant C |
| Plot type | Count rate plots | Images |
|---|---|---|
| Comparison with Poisson distribution Blue bars denote a histogram of data divided into 1 sec bins. Red curve is a Poisson curve with rate = median count rate of data. |
 |
 |
| Quadrant-wise count rates Data is divided into 100 sec bins |
 |
|
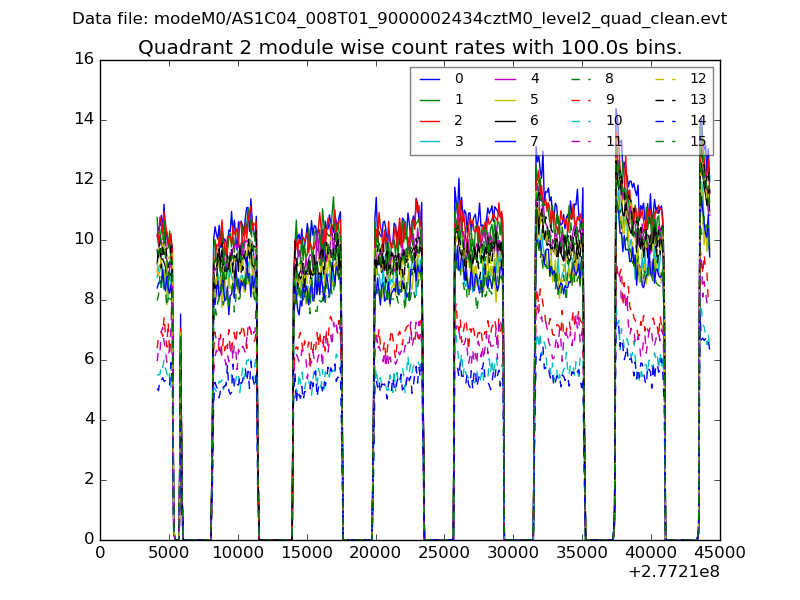
| Module-wise count rates for Quadrant A Data is divided into 100 sec bins |
 |
 |
| Module-wise count rates for Quadrant B Data is divided into 100 sec bins |
 |
 |
| Module-wise count rates for Quadrant C Data is divided into 100 sec bins |
 |
 |
| Module-wise count rates for Quadrant D Data is divided into 100 sec bins |
 |
 |
| Parameter | Plot |
|---|---|
| CZT HV Monitor |  |
| D_VDD | 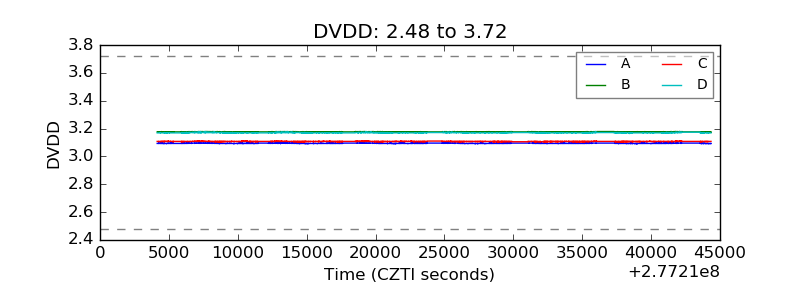 |
| Temperature 1 |  |
| Veto HV Monitor |  |
| Veto LLD |  |
| Alpha Counter |  |
| _CPM_Rate |  |
| CZT Counter |  |
| +2.5 Volts monitor |  |
| +5 Volts monitor |  |
| _ROLL_ROT | 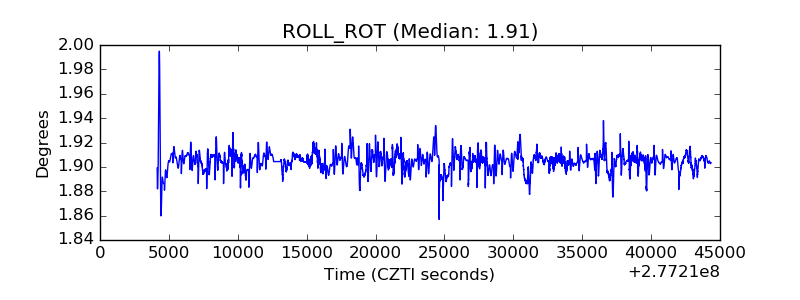 |
| _Roll_DEC |  |
| _Roll_RA |  |
| Veto Counter | 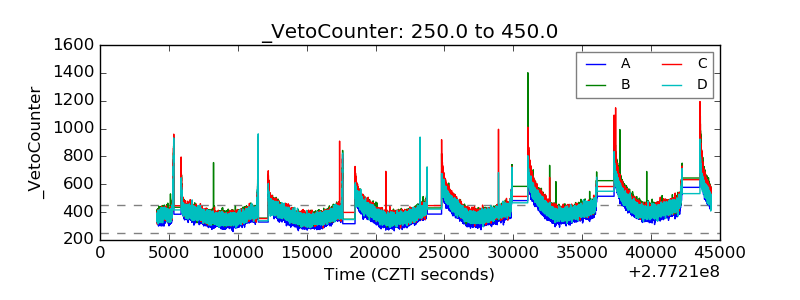 |