| Param | Original file | Final file |
|---|---|---|
| Filename | modeM0/AS1C04_008T01_9000002434_16465cztM0_level2.evt | modeM0/AS1C04_008T01_9000002434_16465cztM0_level2_quad_clean.evt |
| Size (bytes) | 635,385,600 | 101,286,720 |
| Size | 606.0 MB | 96.6 MB |
| Events in quadrant A | 4,051,243 | 638,555 |
| Events in quadrant B | 4,531,355 | 644,497 |
| Events in quadrant C | 4,360,747 | 617,202 |
| Events in quadrant D | 5,736,570 | 590,217 |
| Mode M0 | |||
|---|---|---|---|
| Quadrant | BADHDUFLAG | Total packets | Discarded packets |
| A | 0 | 17188 | 3 |
| B | 0 | 18465 | 2 |
| C | 0 | 17884 | 2 |
| D | 0 | 22630 | 2 |
| Mode SS | |||
|---|---|---|---|
| Quadrant | BADHDUFLAG | Total packets | Discarded packets |
| A | 0 | 170 | 0 |
| B | 0 | 170 | 0 |
| C | 0 | 170 | 0 |
| D | 0 | 170 | 0 |
| Mode M9 | |||
|---|---|---|---|
| Quadrant | BADHDUFLAG | Total packets | Discarded packets |
| A | 0 | 13 | 0 |
| B | 0 | 13 | 0 |
| C | 0 | 13 | 0 |
| D | 0 | 13 | 0 |
| Quadrant | Total seconds | Saturated seconds | Saturation percentage |
|---|---|---|---|
| A | 8303 | 124 | 1.493436% |
| B | 8303 | 170 | 2.047453% |
| C | 8303 | 156 | 1.878839% |
| D | 8303 | 591 | 7.117909% |
Noise dominated data is calculated using 1-second bins in cleaned event files. If a bin has >2000 counts, and if more than 50% of those come from <1% of pixels, then it is considered to be noise-dominated and hence unusable.
| Quadrant | # 1 sec bins | Bins with >0 counts | Bins with >2000 counts | High rate bins dominated by noise | Noise dominated (total time) | Noise dominated (detector-on time) | Marked lightcurve |
|---|---|---|---|---|---|---|---|
| A | 9559 | 8304 | 2 | 2 | 0.02% | 0.02% | 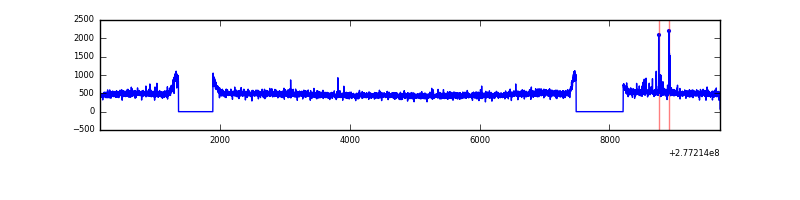 |
| B | 9559 | 8304 | 22 | 22 | 0.23% | 0.26% | 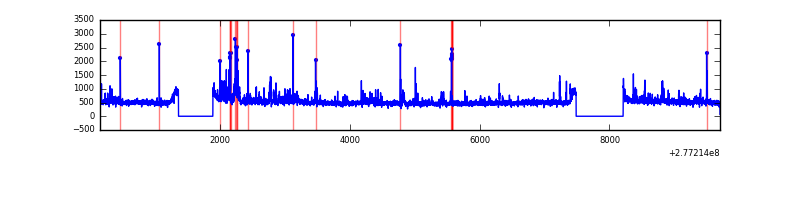 |
| C | 9559 | 8304 | 0 | 0 | 0.00% | 0.00% | 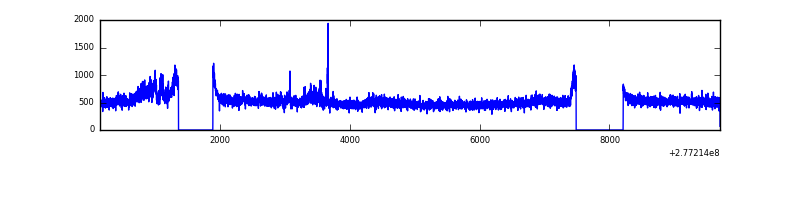 |
| D | 9559 | 8304 | 438 | 438 | 4.58% | 5.27% | 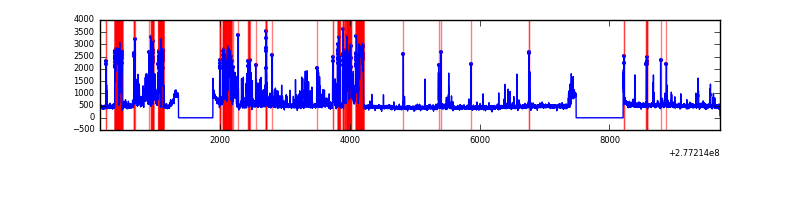 |
Top three noisy pixels from each quadrant. If the there are fewer than three noisy pixels in the level2.evt file, extra rows are filled as -1
| Pixel properties | Quadrant properties | ||||||
|---|---|---|---|---|---|---|---|
| Quadrant | DetID | PixID | Counts | Sigma | Mean | Median | Sigma |
| A | 15 | 174 | 40219 | 185.38 | 1043 | 1025 | 211.4 |
| A | 0 | 226 | 9109 | 38.24 | 1043 | 1025 | 211.4 |
| A | 12 | 194 | 7675 | 31.45 | 1043 | 1025 | 211.4 |
| B | 15 | 35 | 166817 | 825.63 | 1038 | 1015 | 200.8 |
| B | 4 | 48 | 139502 | 689.61 | 1038 | 1015 | 200.8 |
| B | 0 | 198 | 64278 | 315.03 | 1038 | 1015 | 200.8 |
| C | 3 | 233 | 293233 | 1244.16 | 997 | 1005 | 234.9 |
| C | 14 | 238 | 151363 | 640.15 | 997 | 1005 | 234.9 |
| C | 7 | 247 | 26875 | 110.14 | 997 | 1005 | 234.9 |
| D | 2 | 33 | 848794 | 3500.11 | 989 | 960 | 242.2 |
| D | 12 | 218 | 726501 | 2995.25 | 989 | 960 | 242.2 |
| D | 12 | 110 | 327809 | 1349.33 | 989 | 960 | 242.2 |
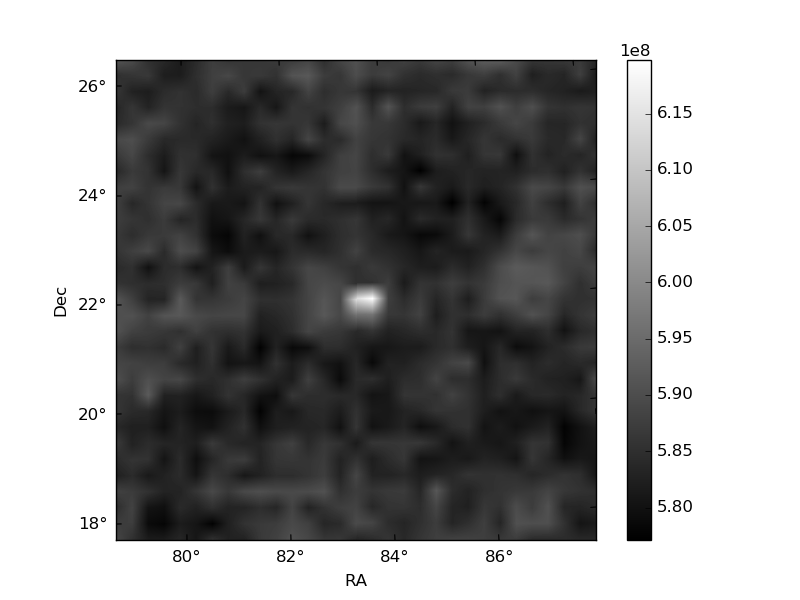
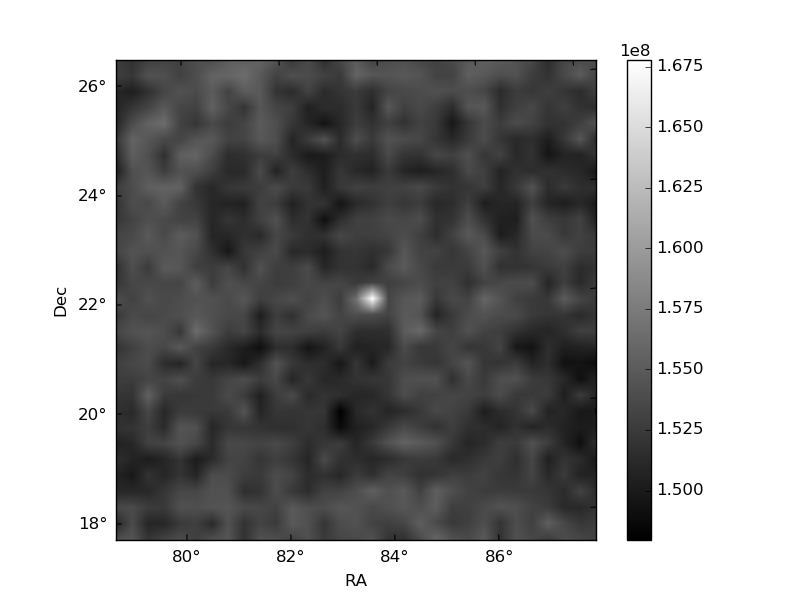
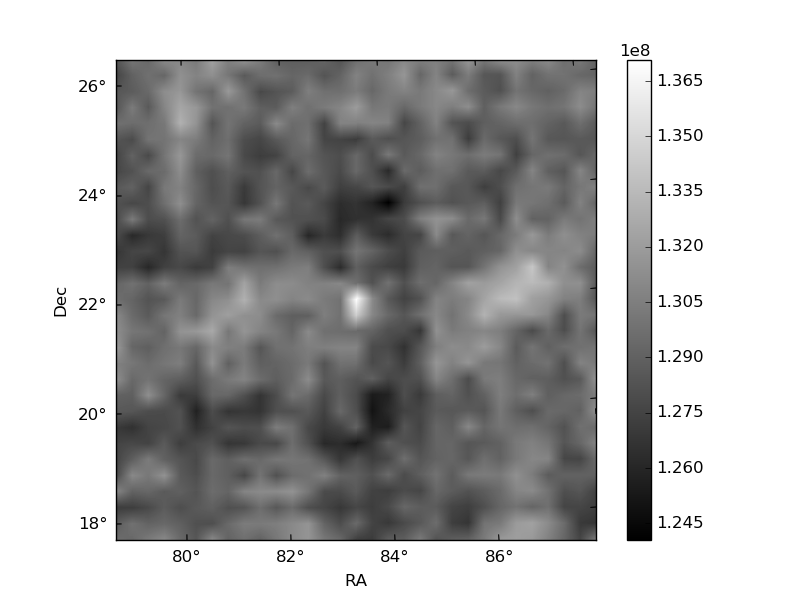
Histogram calculated using DETX and DETY for each event in the final _common_clean file
| Quadrant A | 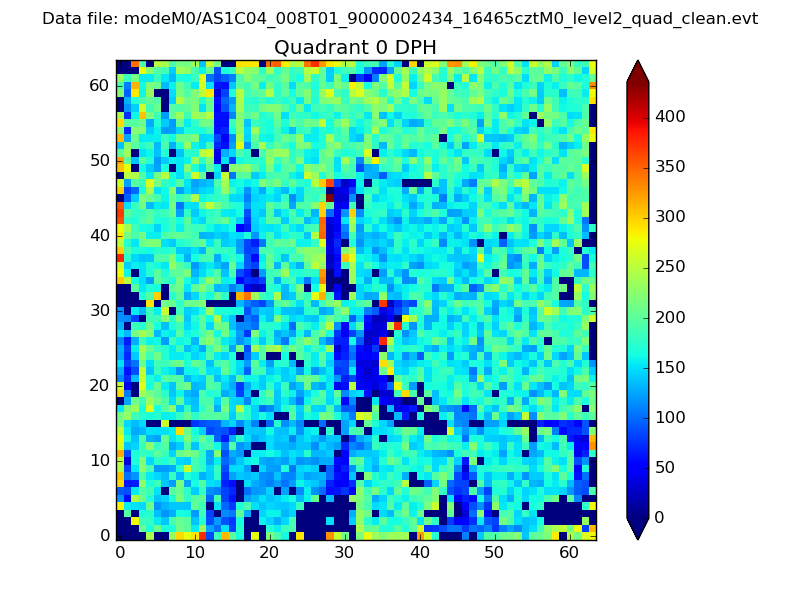 |
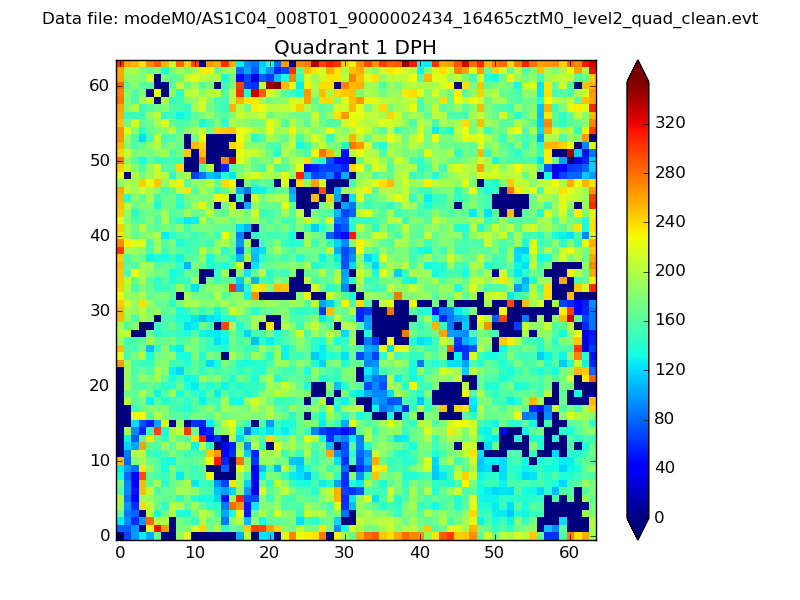 |
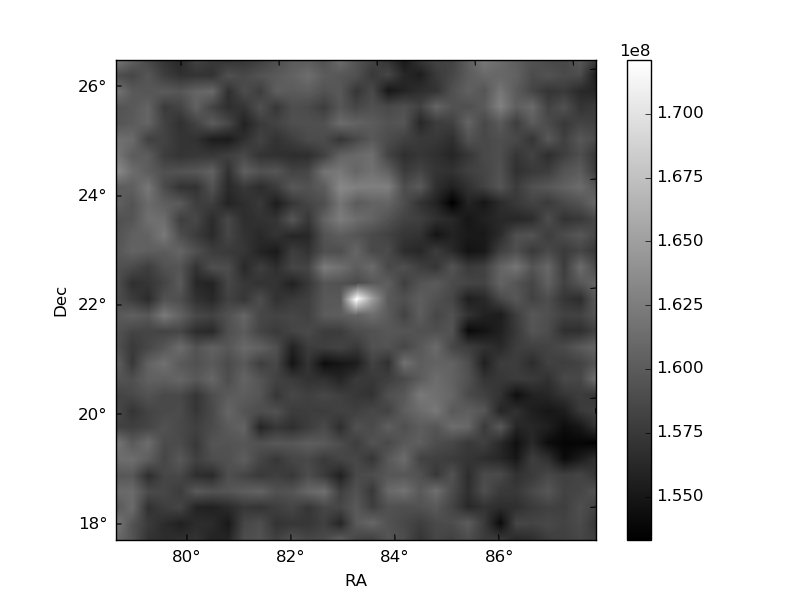
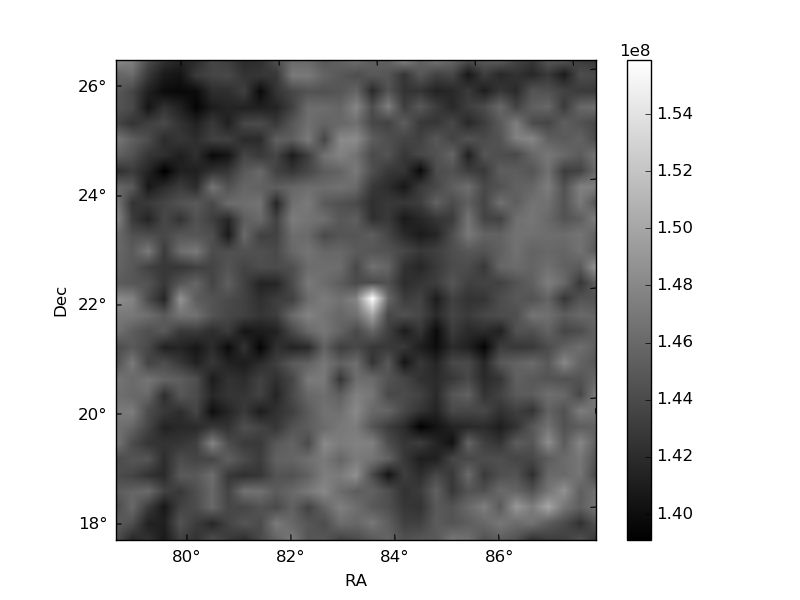
Quadrant B |
|---|---|---|---|
| Quadrant D | 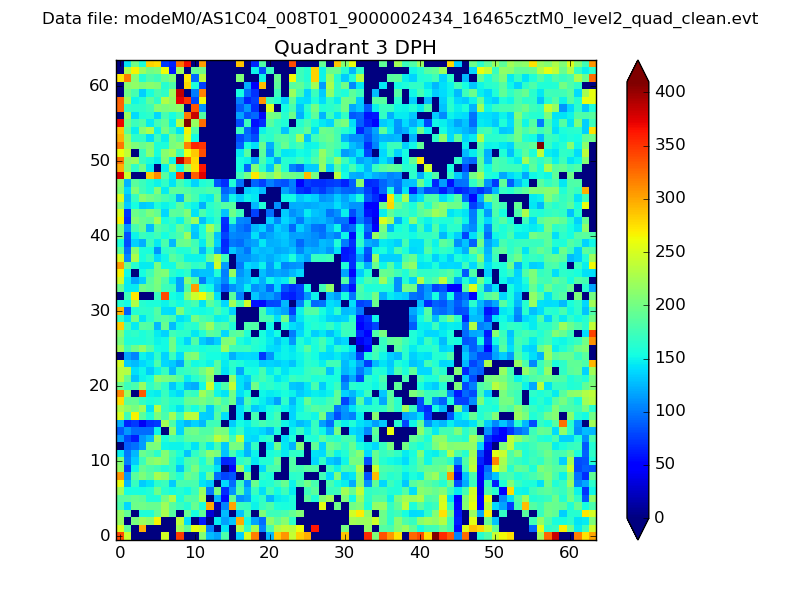 |
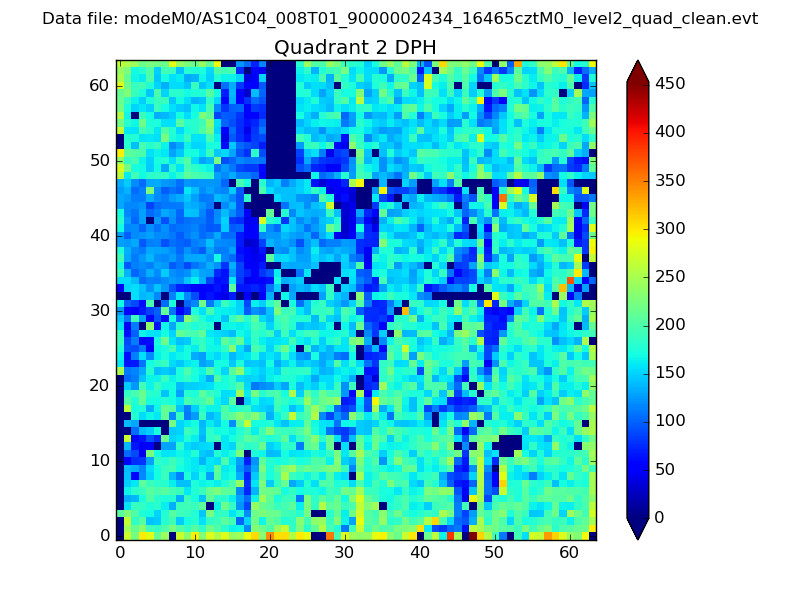 |
Quadrant C |
| Plot type | Count rate plots | Images |
|---|---|---|
| Comparison with Poisson distribution Blue bars denote a histogram of data divided into 1 sec bins. Red curve is a Poisson curve with rate = median count rate of data. |
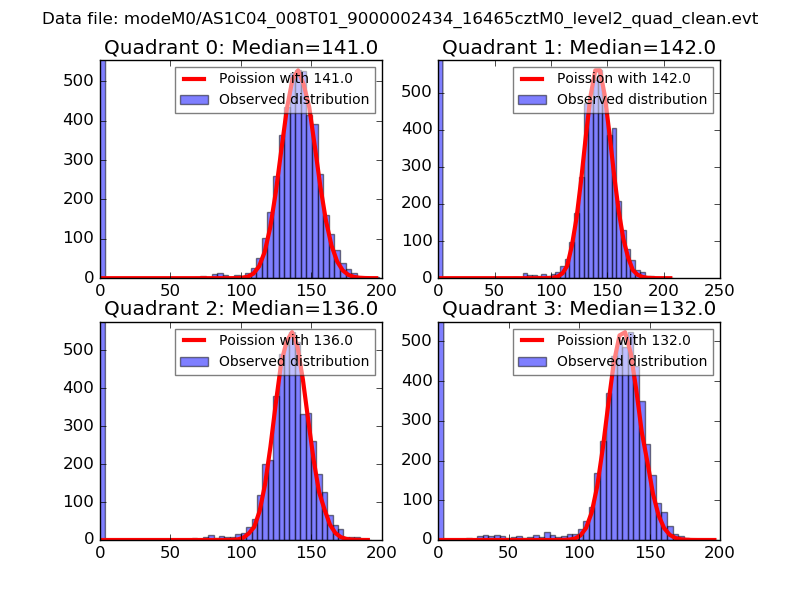 |
 |
| Quadrant-wise count rates Data is divided into 100 sec bins |
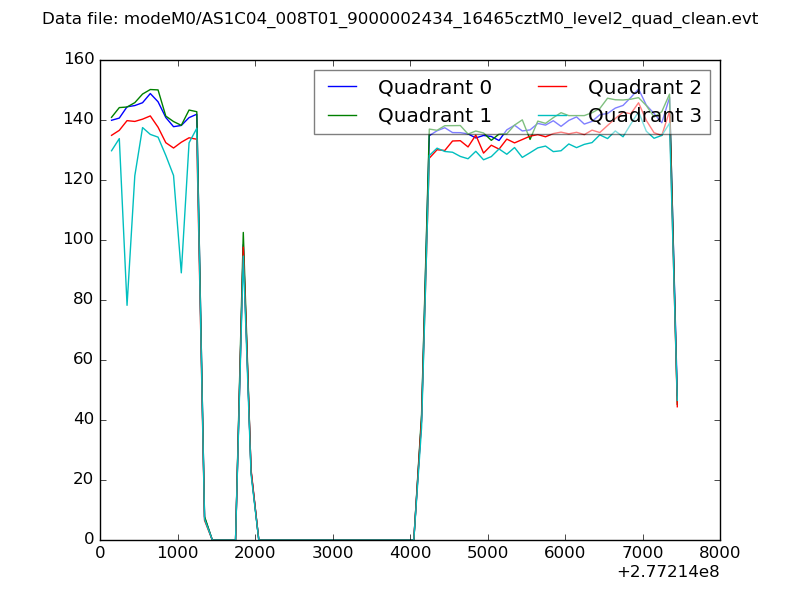 |
|
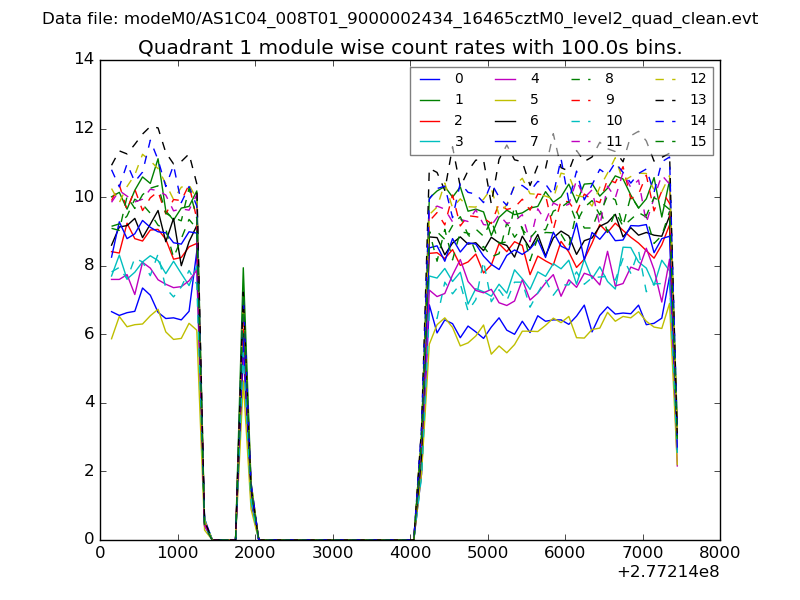
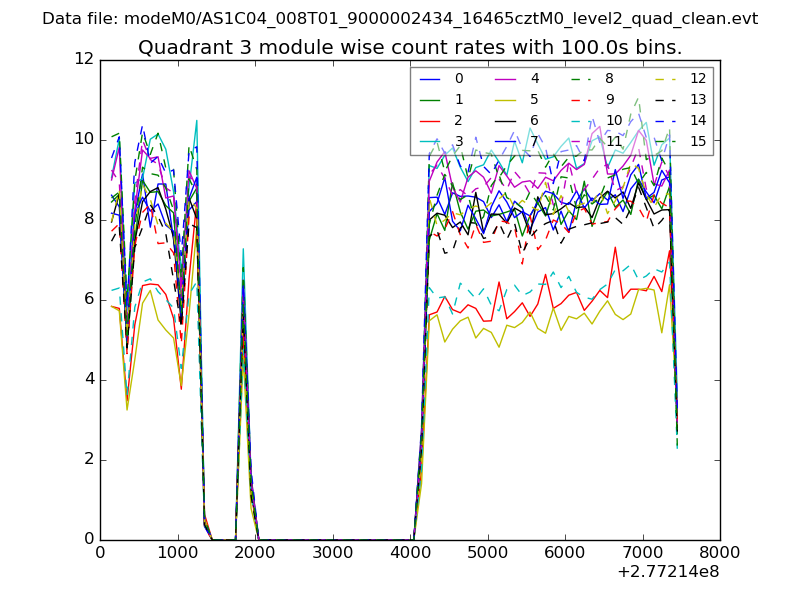
| Module-wise count rates for Quadrant A Data is divided into 100 sec bins |
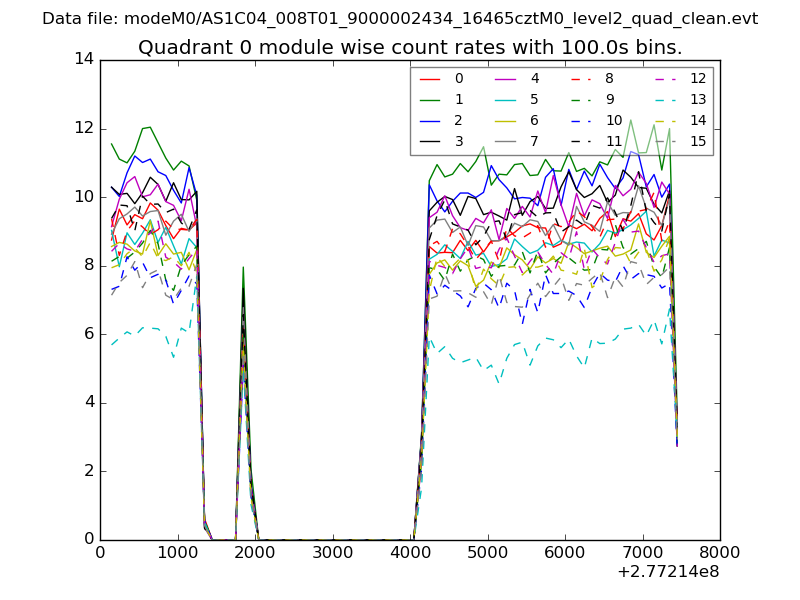 |
 |
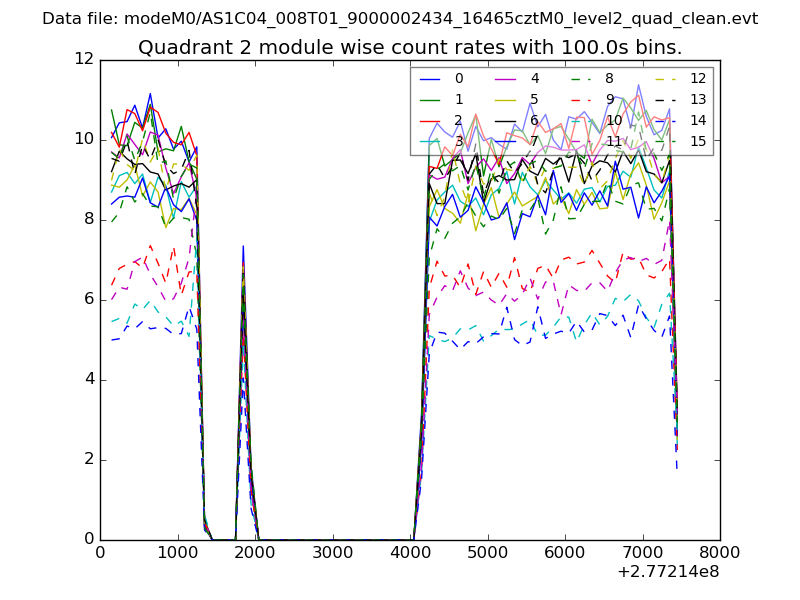
| Module-wise count rates for Quadrant B Data is divided into 100 sec bins |
 |
 |
| Module-wise count rates for Quadrant C Data is divided into 100 sec bins |
 |
 |
| Module-wise count rates for Quadrant D Data is divided into 100 sec bins |
 |
 |
| Parameter | Plot |
|---|---|
| CZT HV Monitor | 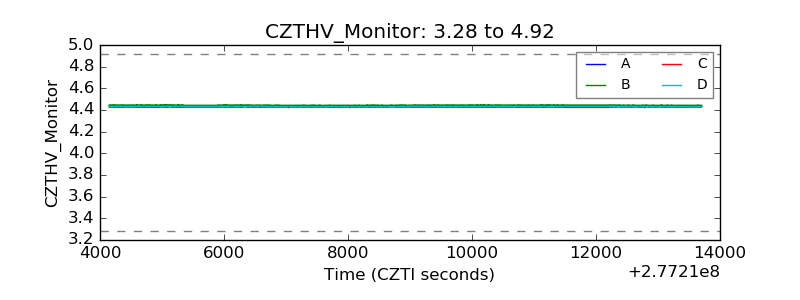 |
| D_VDD | 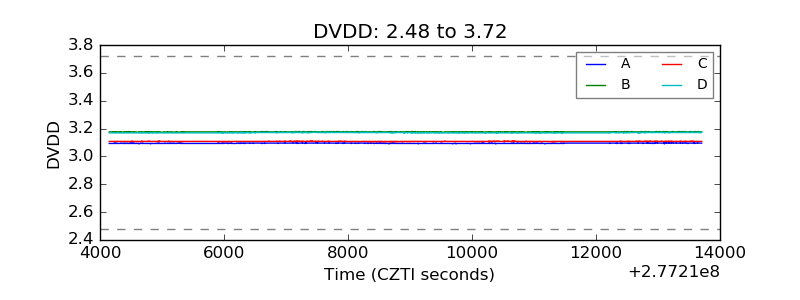 |
| Temperature 1 | 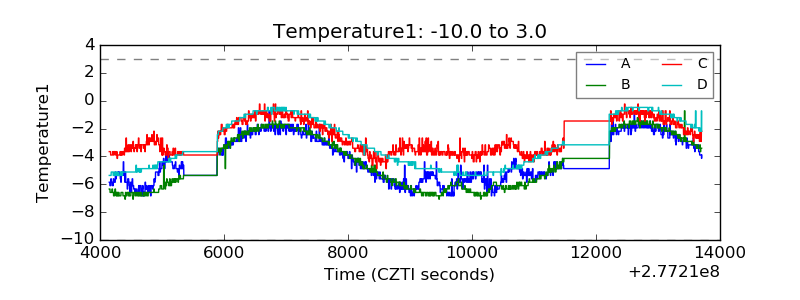 |
| Veto HV Monitor | 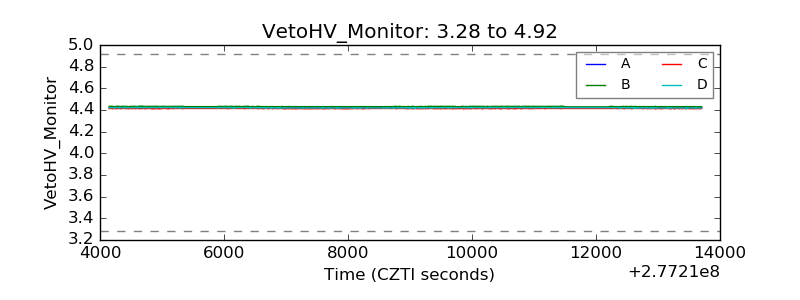 |
| Veto LLD | 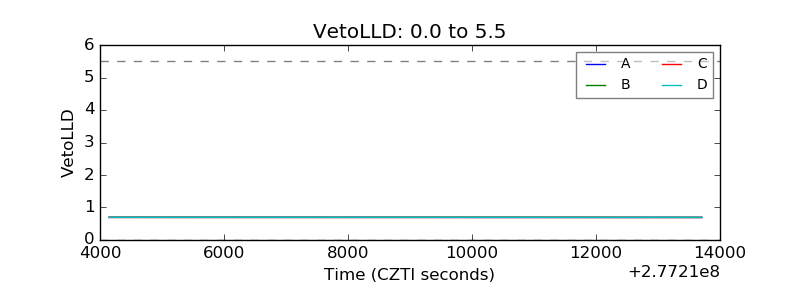 |
| Alpha Counter | 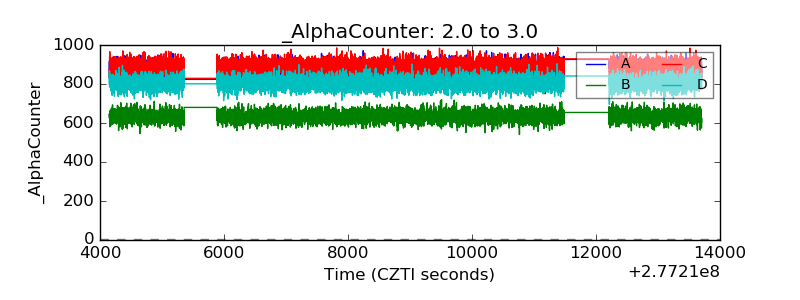 |
| _CPM_Rate | 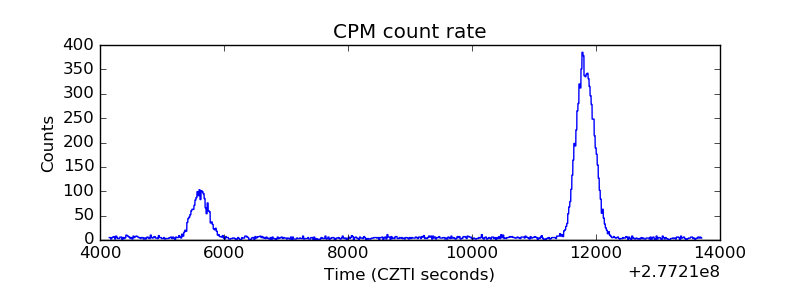 |
| CZT Counter | 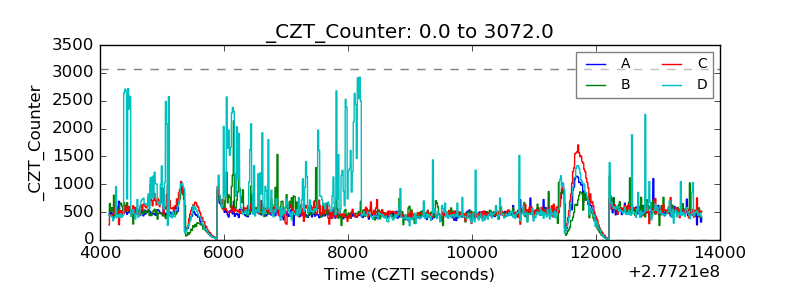 |
| +2.5 Volts monitor | 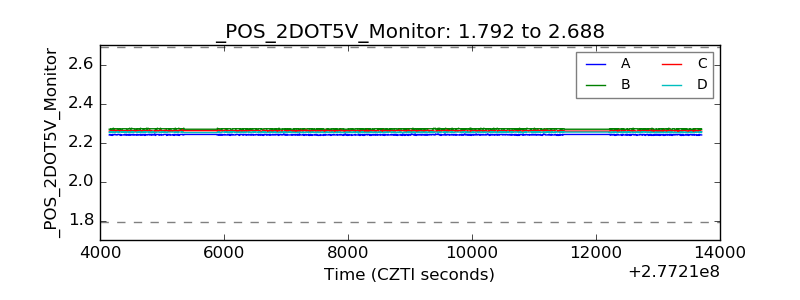 |
| +5 Volts monitor | 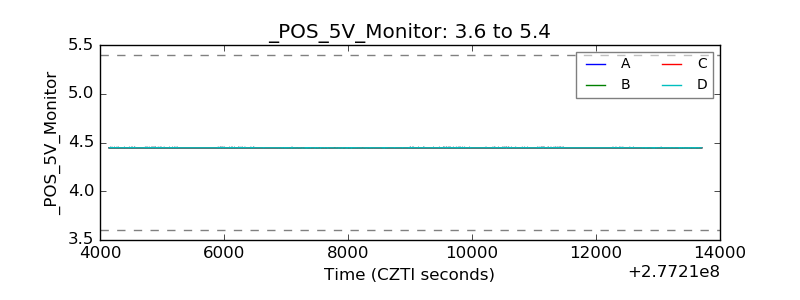 |
| _ROLL_ROT | 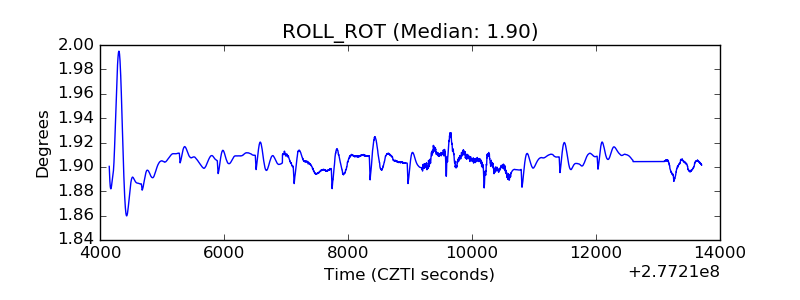 |
| _Roll_DEC |  |
| _Roll_RA | 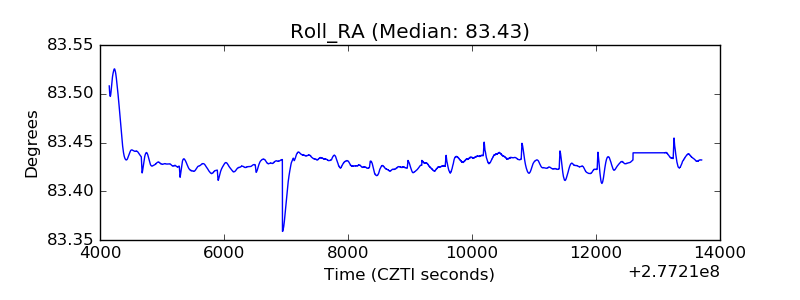 |
| Veto Counter | 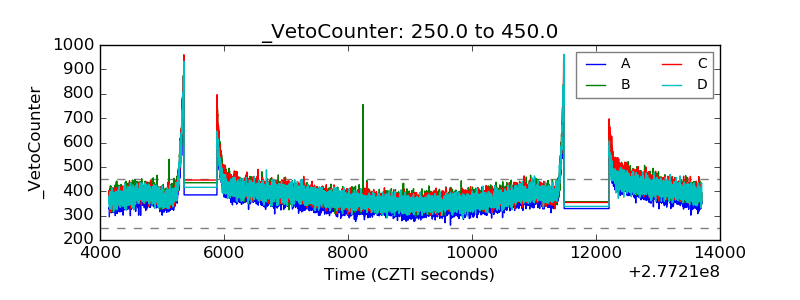 |