| Param | Original file | Final file |
|---|---|---|
| Filename | modeM0/AS1C04_008T01_9000002434_16467cztM0_level2.evt | modeM0/AS1C04_008T01_9000002434_16467cztM0_level2_quad_clean.evt |
| Size (bytes) | 781,176,960 | 160,957,440 |
| Size | 745.0 MB | 153.5 MB |
| Events in quadrant A | 5,858,119 | 1,046,599 |
| Events in quadrant B | 5,876,913 | 1,066,212 |
| Events in quadrant C | 5,454,676 | 1,025,352 |
| Events in quadrant D | 5,743,959 | 996,094 |
| Mode M0 | |||
|---|---|---|---|
| Quadrant | BADHDUFLAG | Total packets | Discarded packets |
| A | 0 | 24304 | 3 |
| B | 0 | 24179 | 2 |
| C | 0 | 22730 | 2 |
| D | 0 | 24266 | 2 |
| Mode SS | |||
|---|---|---|---|
| Quadrant | BADHDUFLAG | Total packets | Discarded packets |
| A | 0 | 216 | 0 |
| B | 0 | 216 | 0 |
| C | 0 | 216 | 0 |
| D | 0 | 216 | 0 |
| Mode M9 | |||
|---|---|---|---|
| Quadrant | BADHDUFLAG | Total packets | Discarded packets |
| A | 0 | 20 | 0 |
| B | 0 | 20 | 0 |
| C | 0 | 20 | 0 |
| D | 0 | 20 | 0 |
| Quadrant | Total seconds | Saturated seconds | Saturation percentage |
|---|---|---|---|
| A | 10708 | 104 | 0.971236% |
| B | 10708 | 132 | 1.232723% |
| C | 10708 | 135 | 1.260740% |
| D | 10708 | 95 | 0.887187% |
Noise dominated data is calculated using 1-second bins in cleaned event files. If a bin has >2000 counts, and if more than 50% of those come from <1% of pixels, then it is considered to be noise-dominated and hence unusable.
| Quadrant | # 1 sec bins | Bins with >0 counts | Bins with >2000 counts | High rate bins dominated by noise | Noise dominated (total time) | Noise dominated (detector-on time) | Marked lightcurve |
|---|---|---|---|---|---|---|---|
| A | 12654 | 10709 | 22 | 22 | 0.17% | 0.21% | 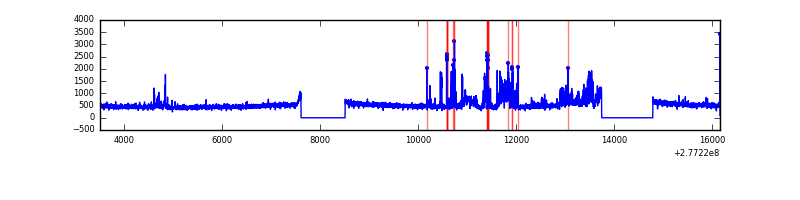 |
| B | 12654 | 10709 | 21 | 21 | 0.17% | 0.20% | 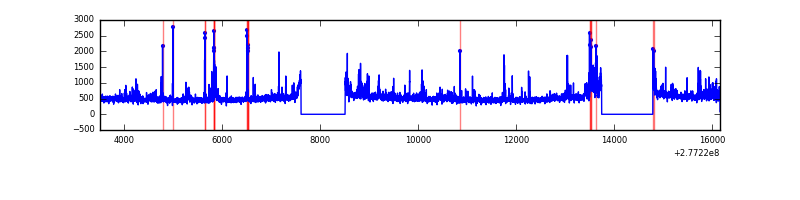 |
| C | 12654 | 10709 | 2 | 2 | 0.02% | 0.02% | 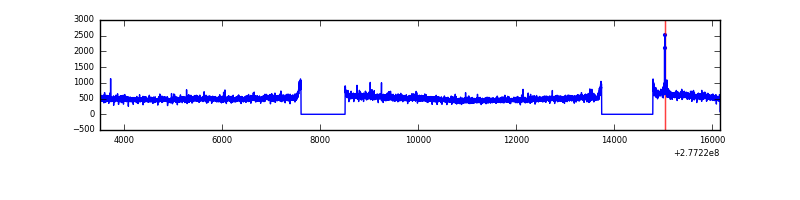 |
| D | 12654 | 10709 | 30 | 30 | 0.24% | 0.28% | 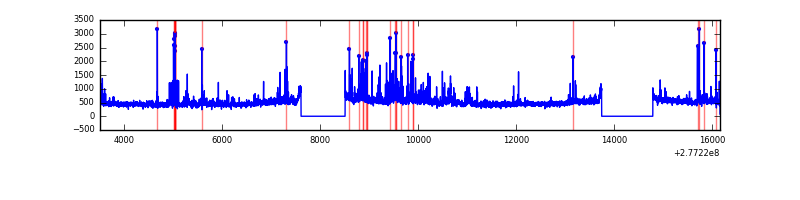 |
Top three noisy pixels from each quadrant. If the there are fewer than three noisy pixels in the level2.evt file, extra rows are filled as -1
| Pixel properties | Quadrant properties | ||||||
|---|---|---|---|---|---|---|---|
| Quadrant | DetID | PixID | Counts | Sigma | Mean | Median | Sigma |
| A | 15 | 174 | 747275 | 2772.58 | 1328 | 1304 | 269.1 |
| A | 0 | 226 | 11801 | 39.01 | 1328 | 1304 | 269.1 |
| A | 12 | 194 | 9514 | 30.51 | 1328 | 1304 | 269.1 |
| B | 4 | 48 | 223837 | 875.16 | 1333 | 1303 | 254.3 |
| B | 15 | 35 | 172212 | 672.13 | 1333 | 1303 | 254.3 |
| B | 4 | 173 | 84020 | 325.3 | 1333 | 1303 | 254.3 |
| C | 14 | 238 | 198596 | 655.22 | 1283 | 1297 | 301.1 |
| C | 3 | 233 | 141980 | 467.2 | 1283 | 1297 | 301.1 |
| C | 7 | 247 | 102521 | 336.16 | 1283 | 1297 | 301.1 |
| D | 12 | 110 | 382615 | 1201.98 | 1296 | 1264 | 317.3 |
| D | 12 | 218 | 205501 | 643.74 | 1296 | 1264 | 317.3 |
| D | 13 | 248 | 117563 | 366.56 | 1296 | 1264 | 317.3 |
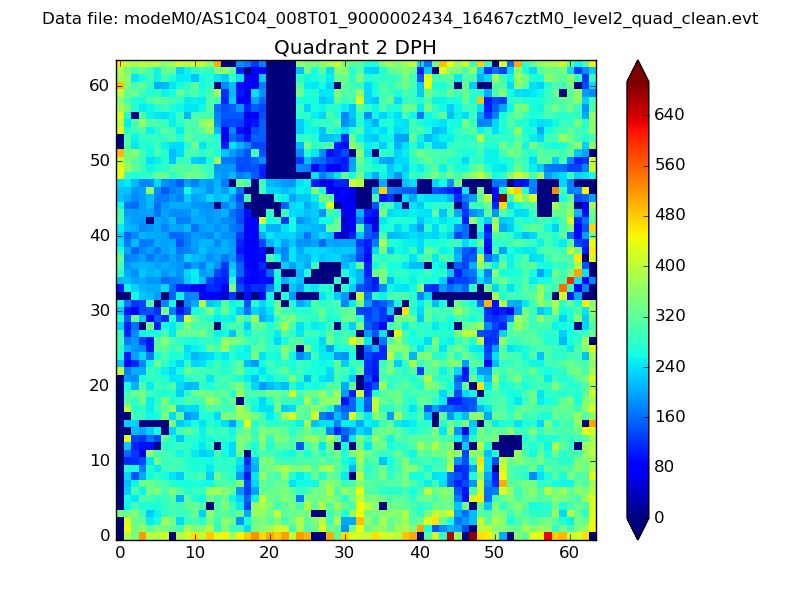
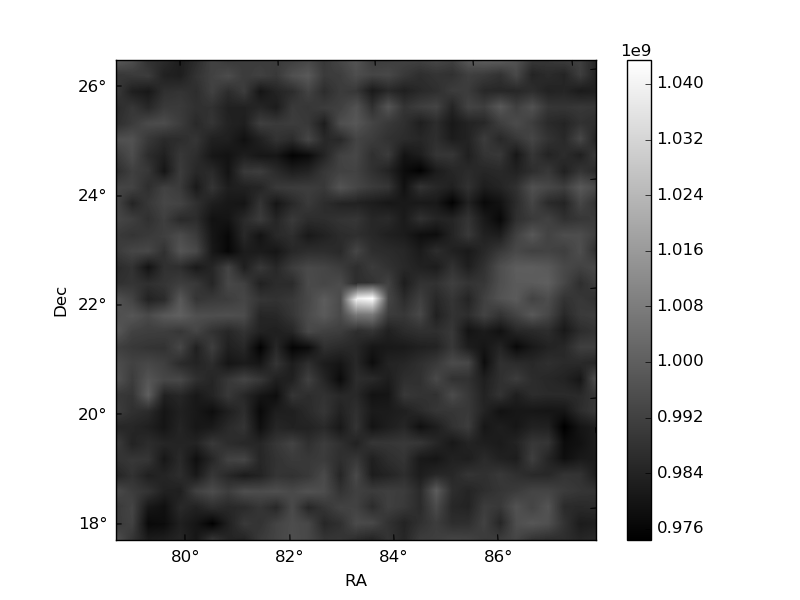
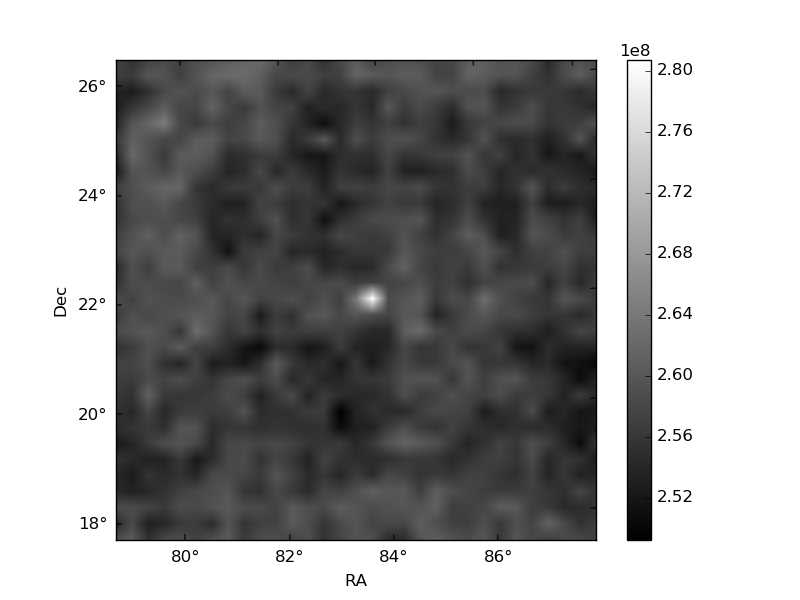
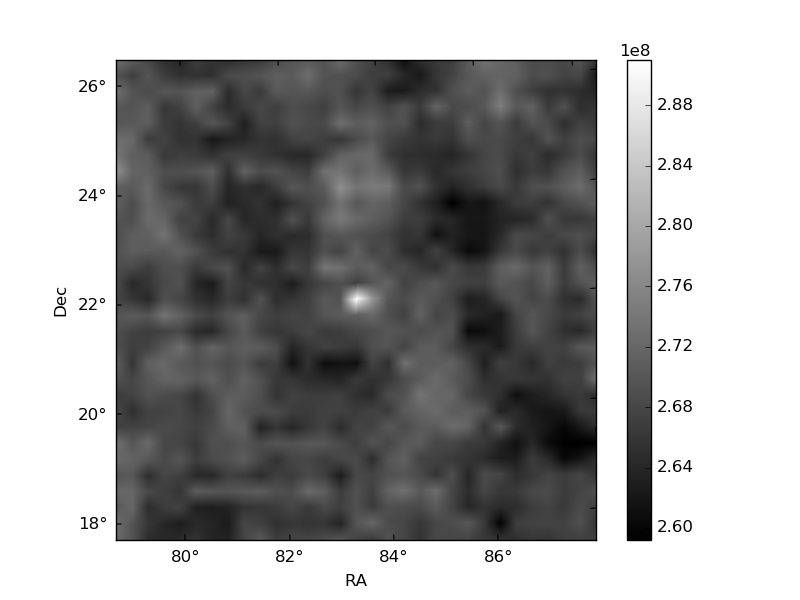
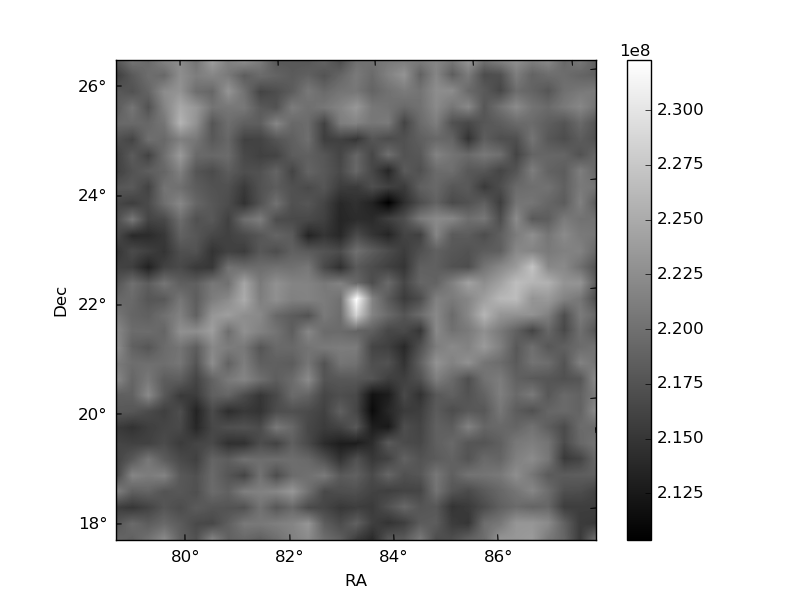
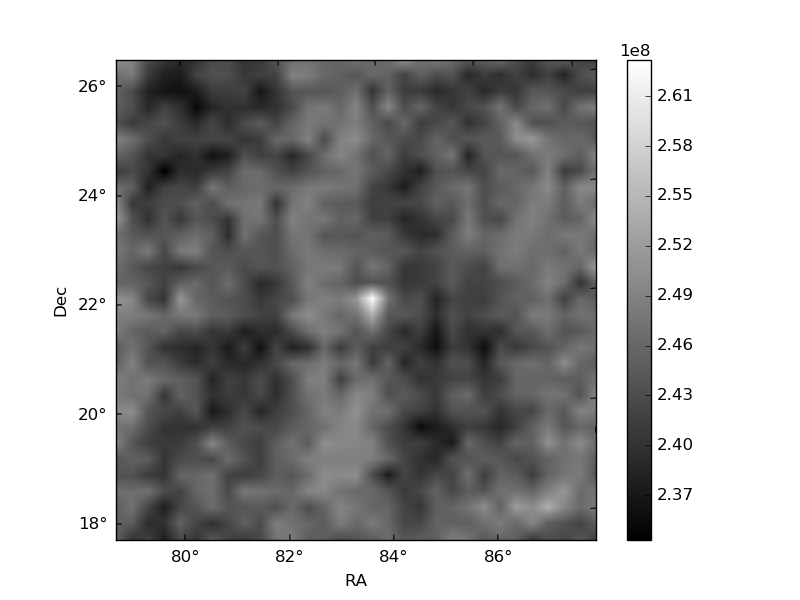
Histogram calculated using DETX and DETY for each event in the final _common_clean file
| Quadrant A | 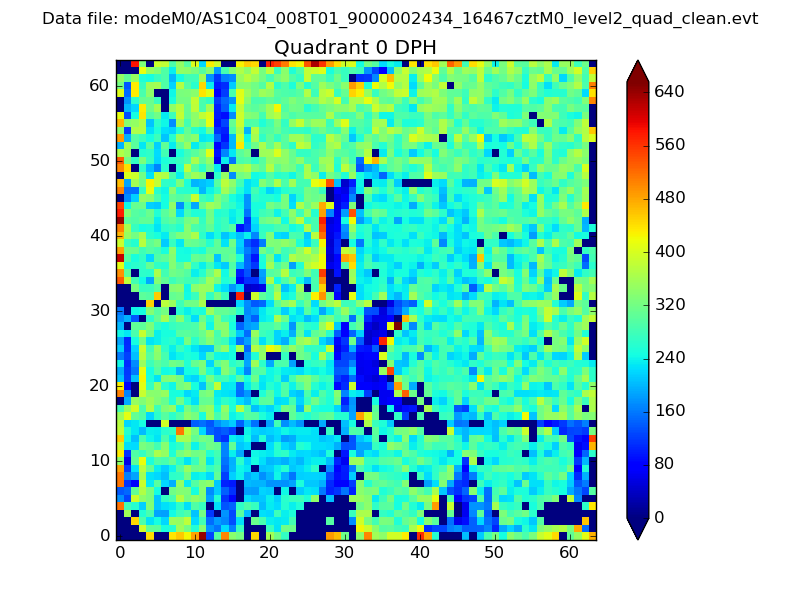 |
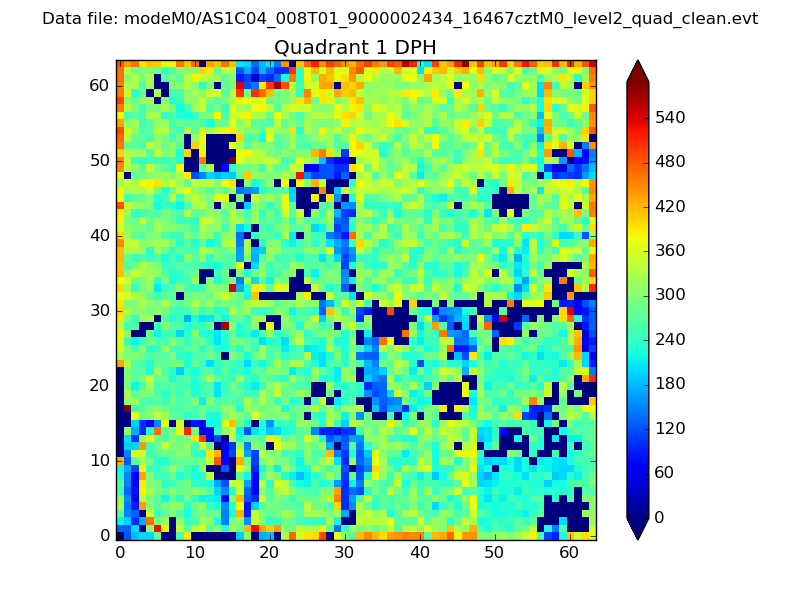 |
Quadrant B |
|---|---|---|---|
| Quadrant D | 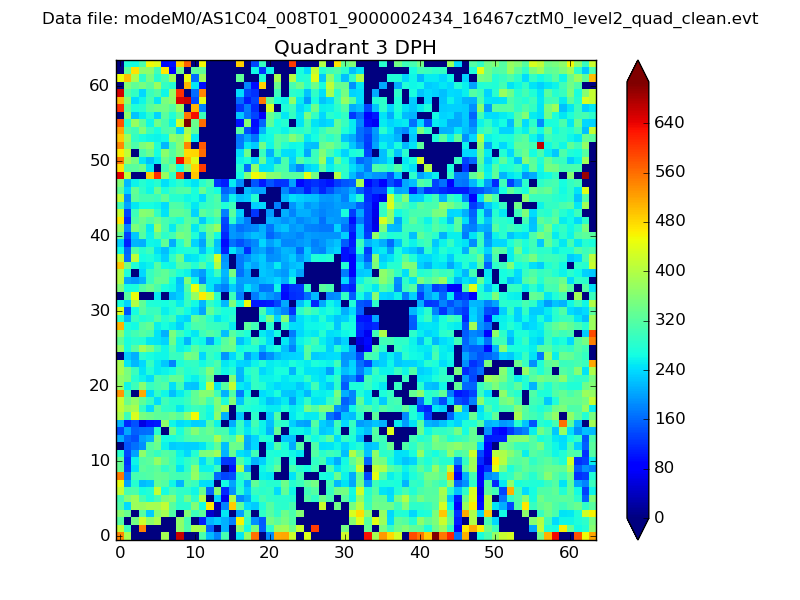 |
 |
Quadrant C |
| Plot type | Count rate plots | Images |
|---|---|---|
| Comparison with Poisson distribution Blue bars denote a histogram of data divided into 1 sec bins. Red curve is a Poisson curve with rate = median count rate of data. |
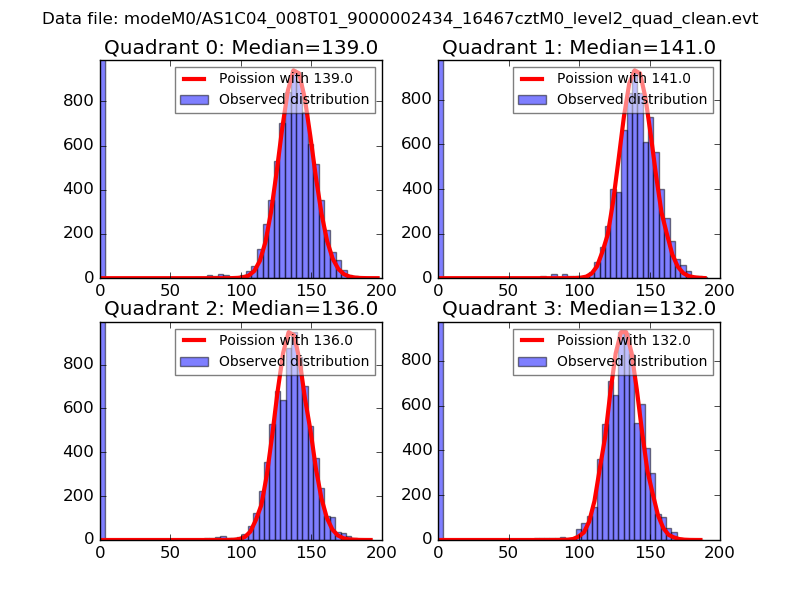 |
 |
| Quadrant-wise count rates Data is divided into 100 sec bins |
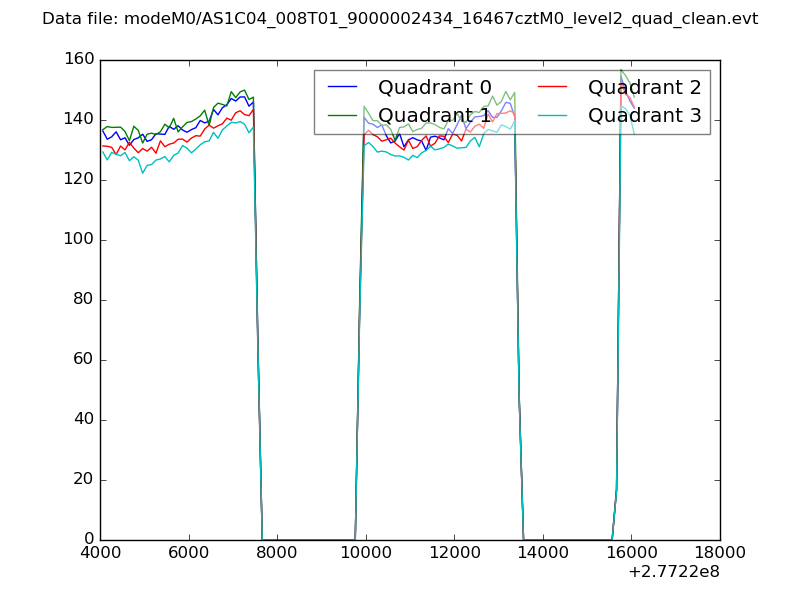 |
|
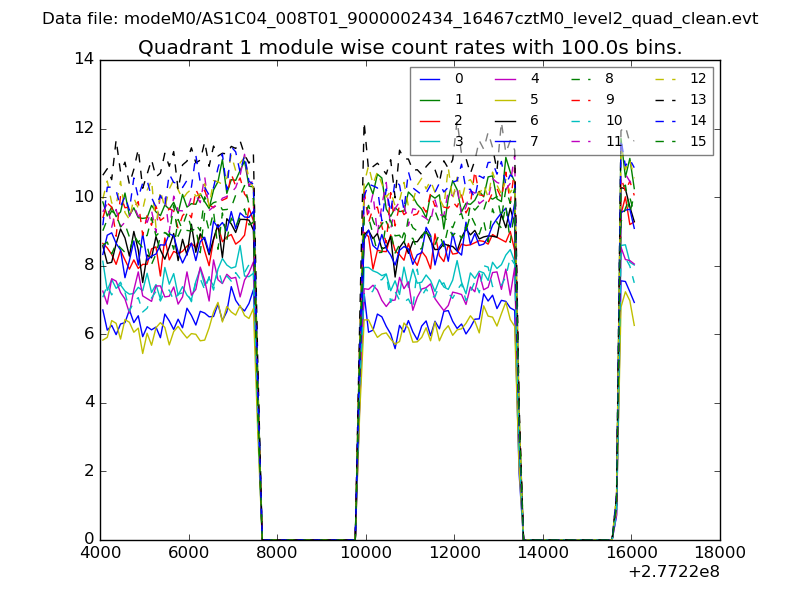
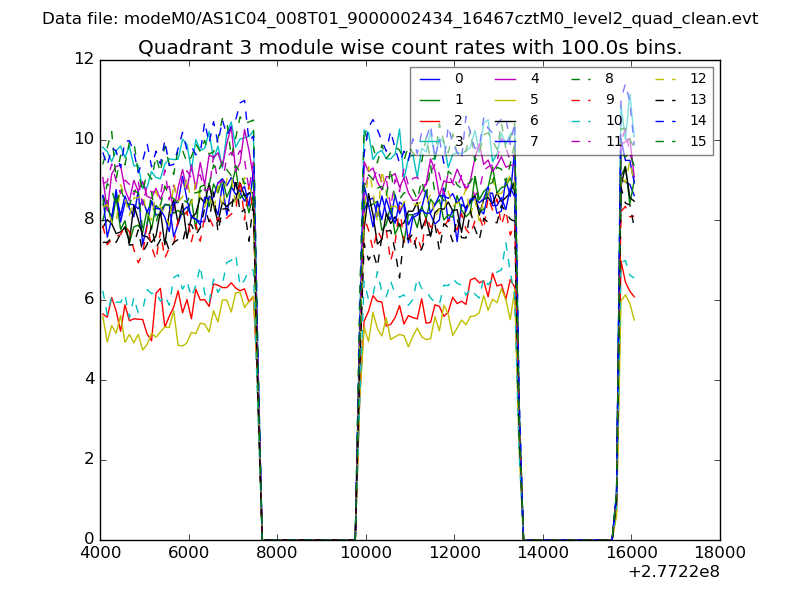
| Module-wise count rates for Quadrant A Data is divided into 100 sec bins |
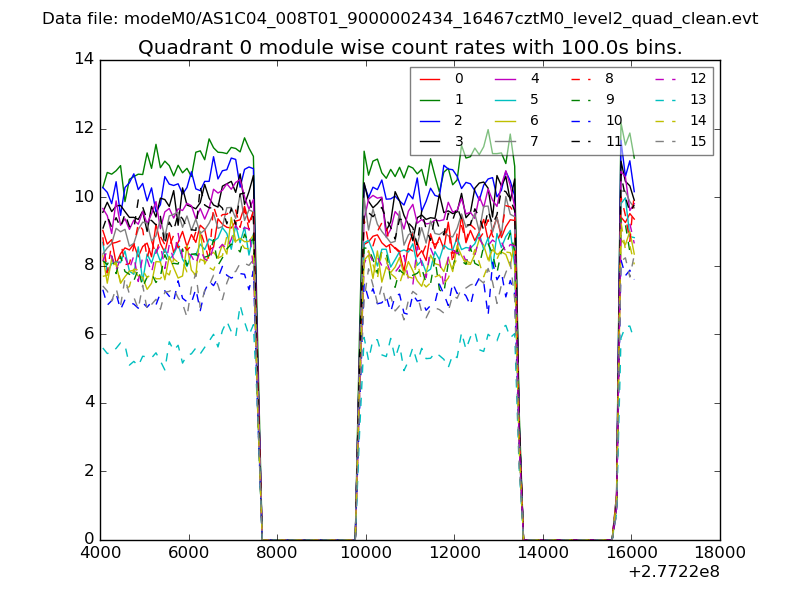 |
 |
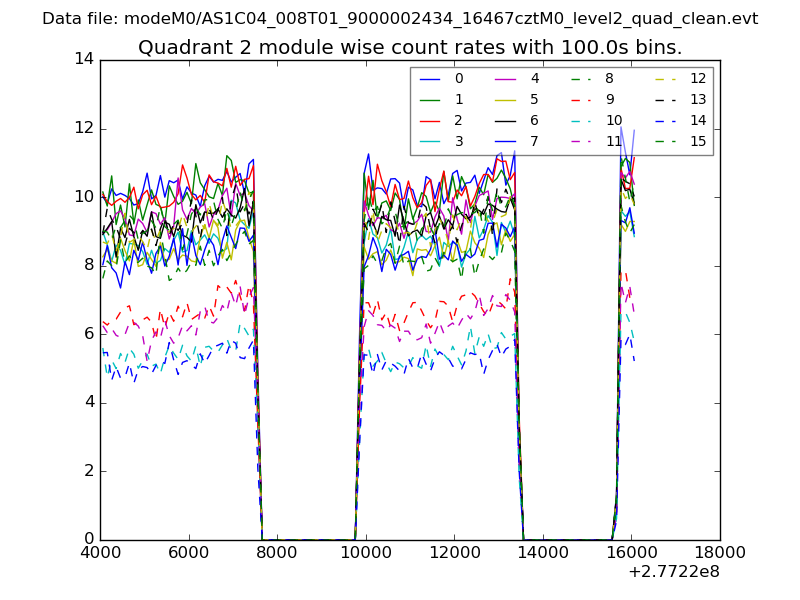
| Module-wise count rates for Quadrant B Data is divided into 100 sec bins |
 |
 |
| Module-wise count rates for Quadrant C Data is divided into 100 sec bins |
 |
 |
| Module-wise count rates for Quadrant D Data is divided into 100 sec bins |
 |
 |
| Parameter | Plot |
|---|---|
| CZT HV Monitor | 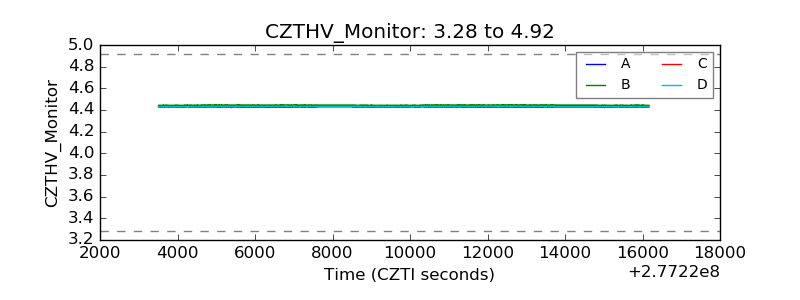 |
| D_VDD | 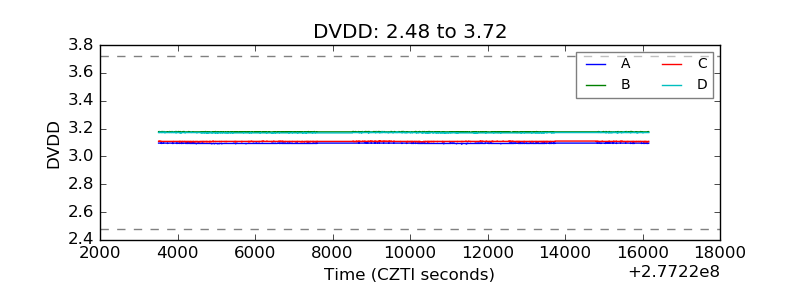 |
| Temperature 1 | 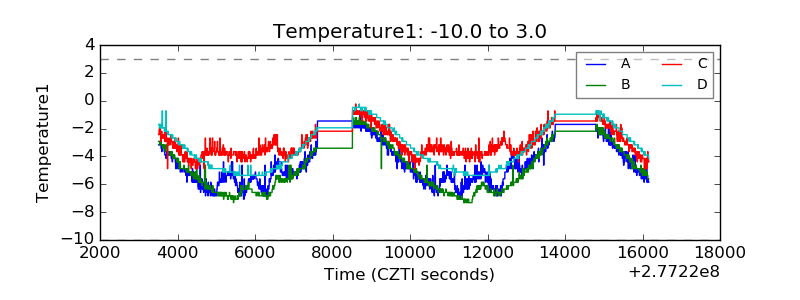 |
| Veto HV Monitor | 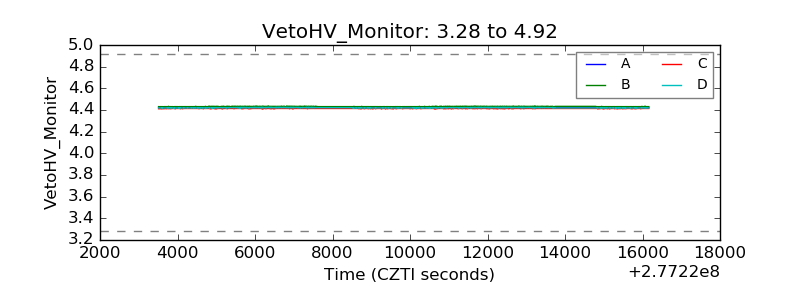 |
| Veto LLD | 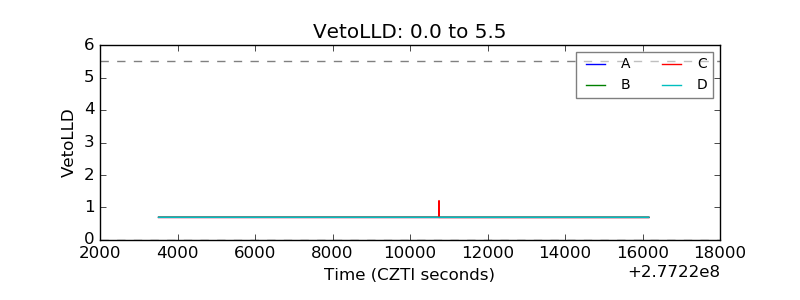 |
| Alpha Counter | 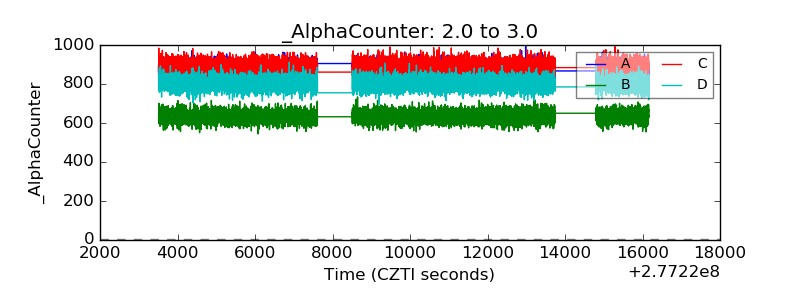 |
| _CPM_Rate | 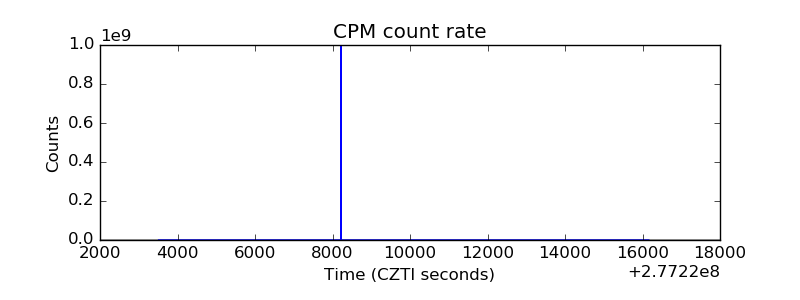 |
| CZT Counter | 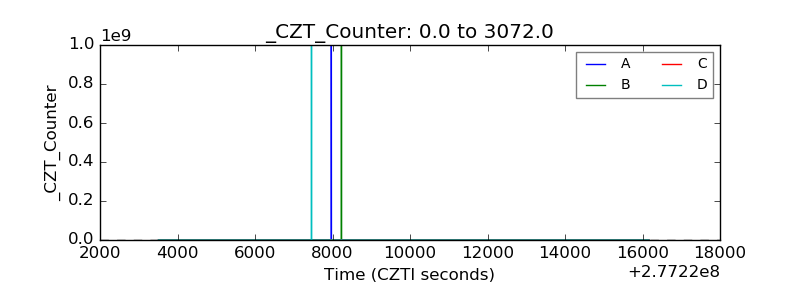 |
| +2.5 Volts monitor | 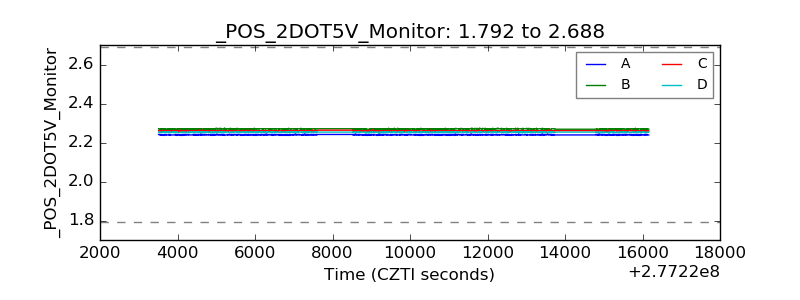 |
| +5 Volts monitor | 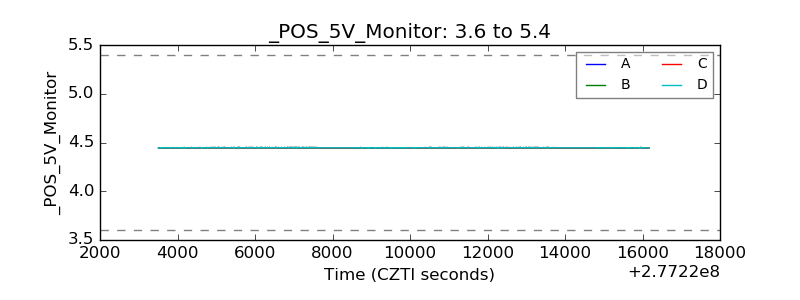 |
| _ROLL_ROT | 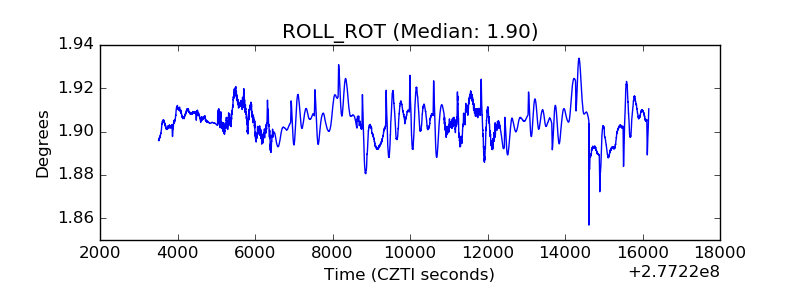 |
| _Roll_DEC |  |
| _Roll_RA | 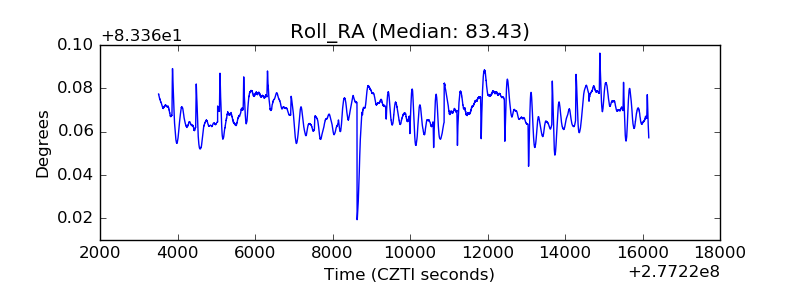 |
| Veto Counter | 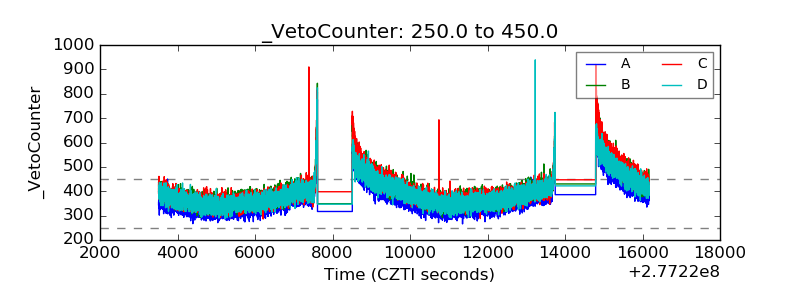 |