| Param | Original file | Final file |
|---|---|---|
| Filename | modeM0/AS1C04_008T01_9000002434_16470cztM0_level2.evt | modeM0/AS1C04_008T01_9000002434_16470cztM0_level2_quad_clean.evt |
| Size (bytes) | 479,661,120 | 110,422,080 |
| Size | 457.4 MB | 105.3 MB |
| Events in quadrant A | 3,597,800 | 731,550 |
| Events in quadrant B | 3,792,366 | 752,894 |
| Events in quadrant C | 3,510,549 | 722,988 |
| Events in quadrant D | 3,197,036 | 695,957 |
| Mode M0 | |||
|---|---|---|---|
| Quadrant | BADHDUFLAG | Total packets | Discarded packets |
| A | 0 | 14669 | 3 |
| B | 0 | 15445 | 2 |
| C | 0 | 14495 | 2 |
| D | 0 | 13603 | 2 |
| Mode SS | |||
|---|---|---|---|
| Quadrant | BADHDUFLAG | Total packets | Discarded packets |
| A | 0 | 128 | 0 |
| B | 0 | 128 | 0 |
| C | 0 | 128 | 0 |
| D | 0 | 128 | 0 |
| Mode M9 | |||
|---|---|---|---|
| Quadrant | BADHDUFLAG | Total packets | Discarded packets |
| A | 0 | 13 | 0 |
| B | 0 | 13 | 0 |
| C | 0 | 13 | 0 |
| D | 0 | 13 | 0 |
| Quadrant | Total seconds | Saturated seconds | Saturation percentage |
|---|---|---|---|
| A | 6320 | 52 | 0.822785% |
| B | 6320 | 108 | 1.708861% |
| C | 6320 | 80 | 1.265823% |
| D | 6320 | 24 | 0.379747% |
Noise dominated data is calculated using 1-second bins in cleaned event files. If a bin has >2000 counts, and if more than 50% of those come from <1% of pixels, then it is considered to be noise-dominated and hence unusable.
| Quadrant | # 1 sec bins | Bins with >0 counts | Bins with >2000 counts | High rate bins dominated by noise | Noise dominated (total time) | Noise dominated (detector-on time) | Marked lightcurve |
|---|---|---|---|---|---|---|---|
| A | 7581 | 6322 | 43 | 43 | 0.57% | 0.68% | 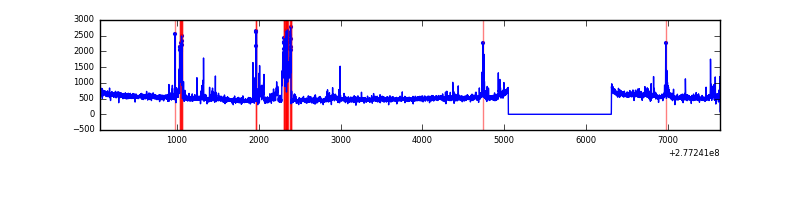 |
| B | 7581 | 6322 | 32 | 32 | 0.42% | 0.51% | 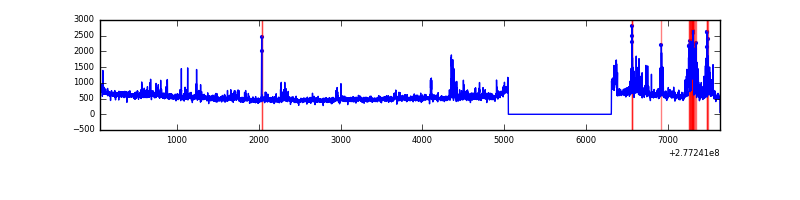 |
| C | 7581 | 6322 | 0 | 0 | 0.00% | 0.00% |  |
| D | 7581 | 6322 | 8 | 8 | 0.11% | 0.13% | 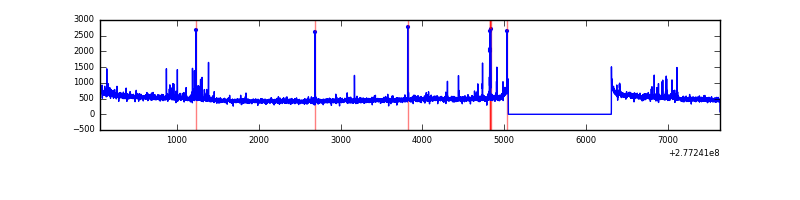 |
Top three noisy pixels from each quadrant. If the there are fewer than three noisy pixels in the level2.evt file, extra rows are filled as -1
| Pixel properties | Quadrant properties | ||||||
|---|---|---|---|---|---|---|---|
| Quadrant | DetID | PixID | Counts | Sigma | Mean | Median | Sigma |
| A | 15 | 174 | 407938 | 2418.6 | 830 | 816 | 168.3 |
| A | 0 | 226 | 7181 | 37.81 | 830 | 816 | 168.3 |
| A | 12 | 194 | 5884 | 30.11 | 830 | 816 | 168.3 |
| B | 4 | 173 | 231082 | 1461.85 | 840 | 823 | 157.5 |
| B | 15 | 35 | 88731 | 558.1 | 840 | 823 | 157.5 |
| B | 3 | 209 | 57706 | 361.13 | 840 | 823 | 157.5 |
| C | 3 | 233 | 172301 | 915.83 | 808 | 818 | 187.2 |
| C | 14 | 238 | 126072 | 668.94 | 808 | 818 | 187.2 |
| C | 7 | 247 | 56124 | 295.37 | 808 | 818 | 187.2 |
| D | 13 | 248 | 38702 | 189.89 | 810 | 787 | 199.7 |
| D | 2 | 120 | 27814 | 135.36 | 810 | 787 | 199.7 |
| D | 2 | 33 | 27259 | 132.58 | 810 | 787 | 199.7 |
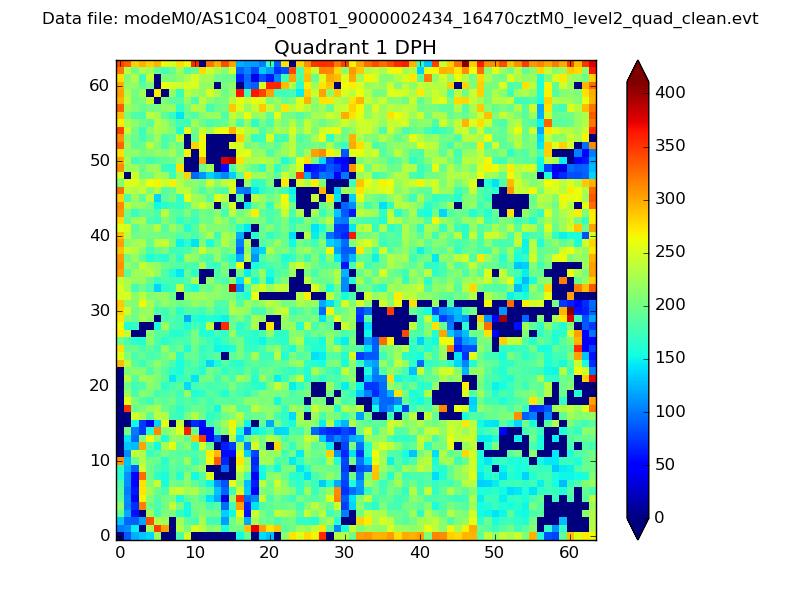
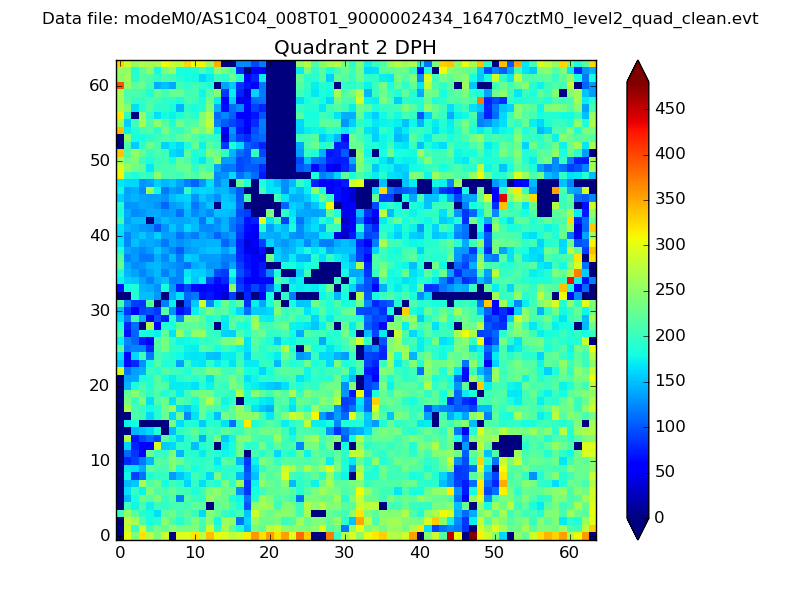
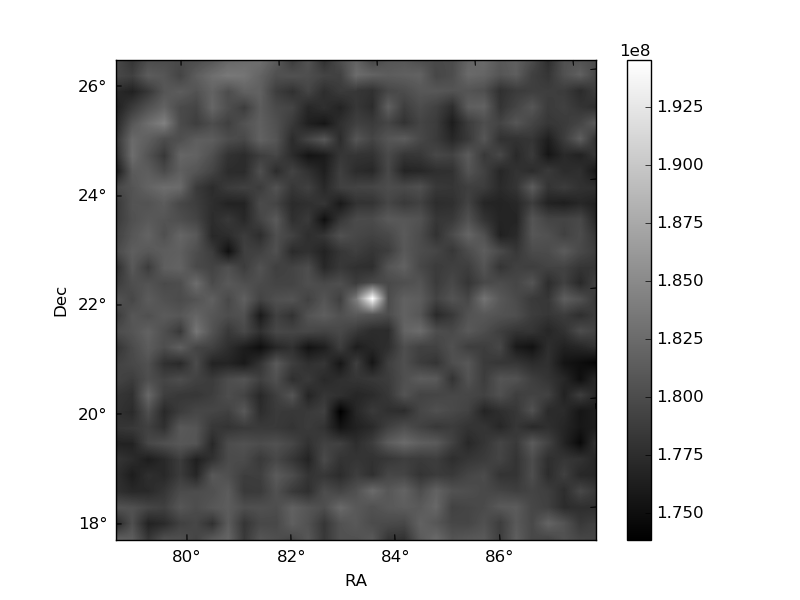
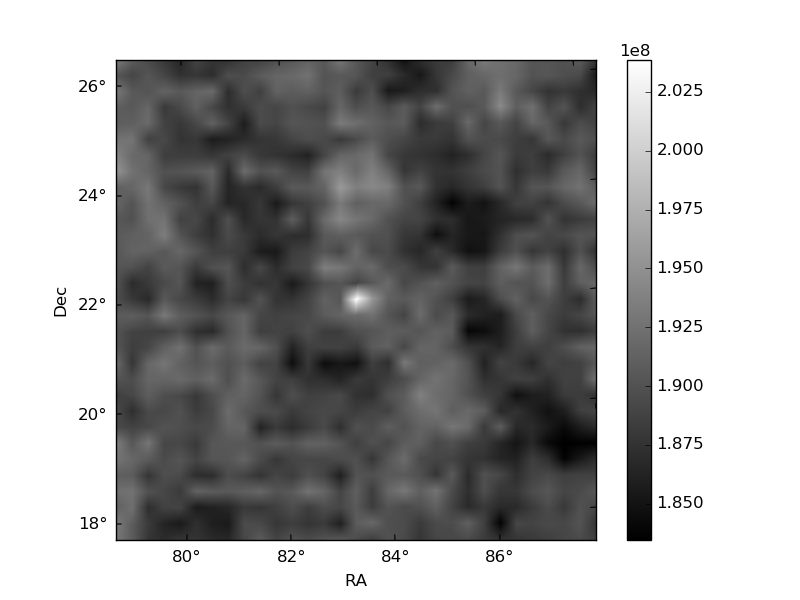
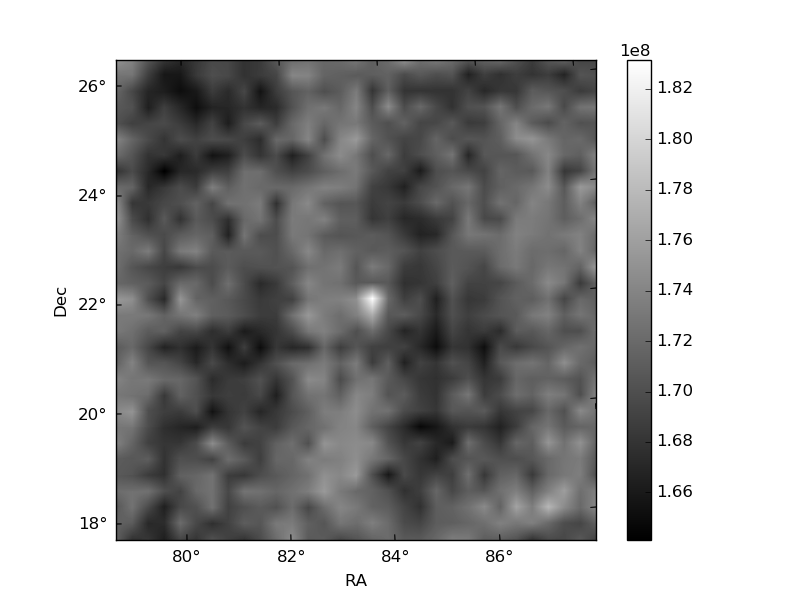
Histogram calculated using DETX and DETY for each event in the final _common_clean file
| Quadrant A | 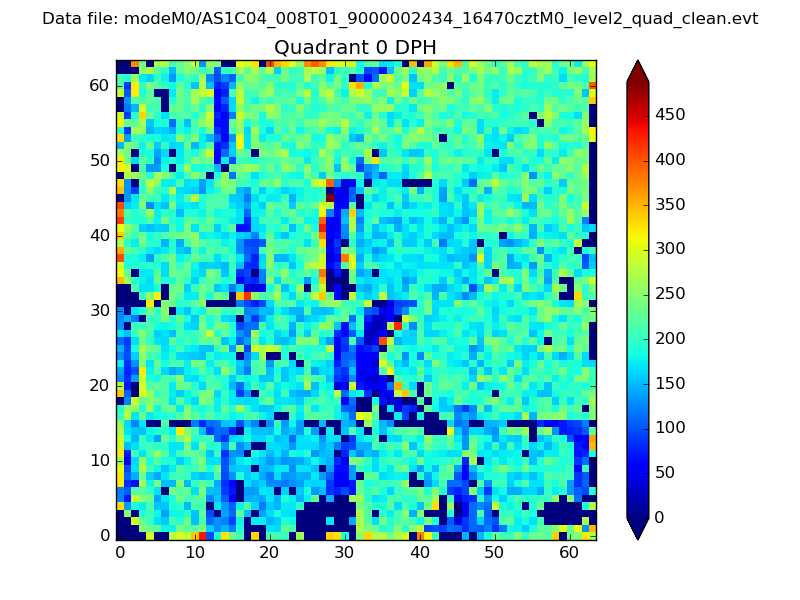 |
 |
Quadrant B |
|---|---|---|---|
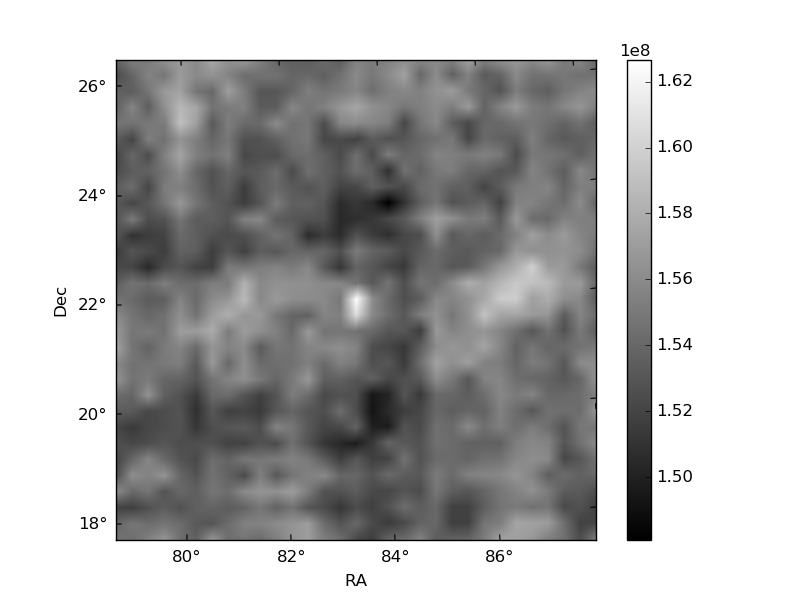
| Quadrant D | 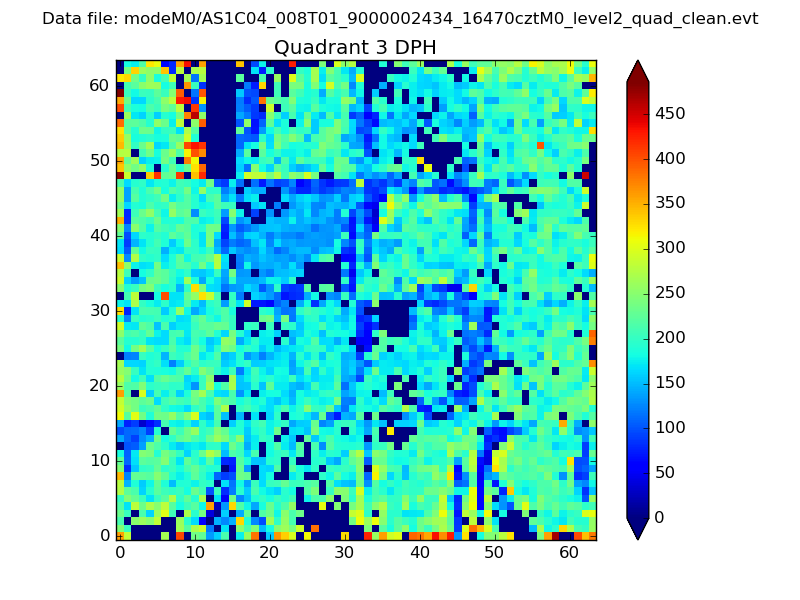 |
 |
Quadrant C |
| Plot type | Count rate plots | Images |
|---|---|---|
| Comparison with Poisson distribution Blue bars denote a histogram of data divided into 1 sec bins. Red curve is a Poisson curve with rate = median count rate of data. |
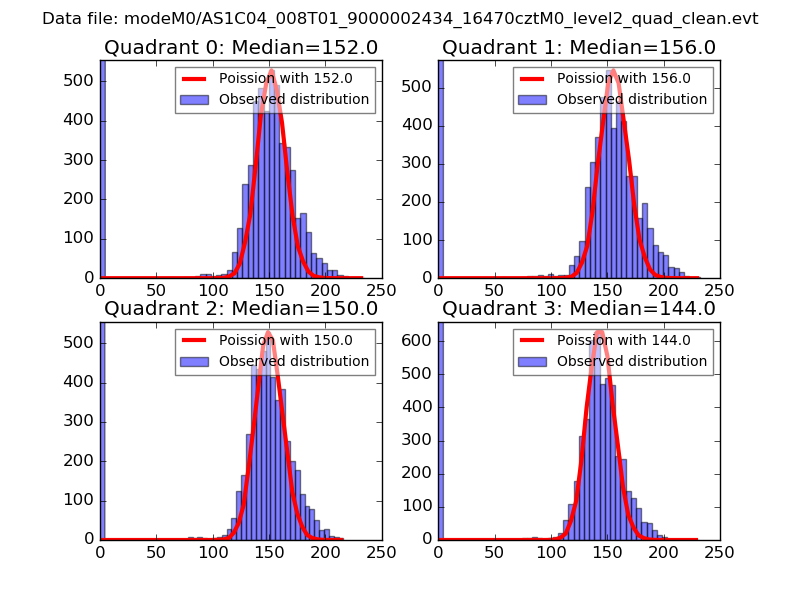 |
 |
| Quadrant-wise count rates Data is divided into 100 sec bins |
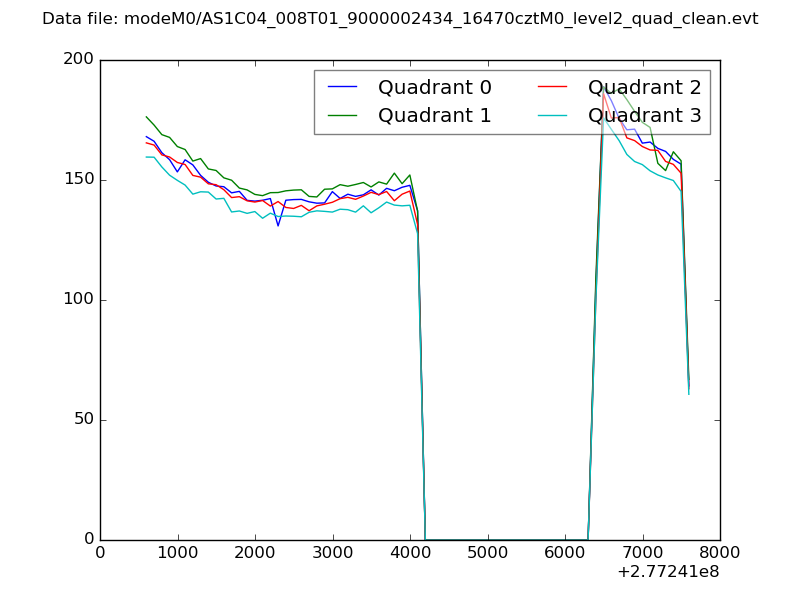 |
|
| Module-wise count rates for Quadrant A Data is divided into 100 sec bins |
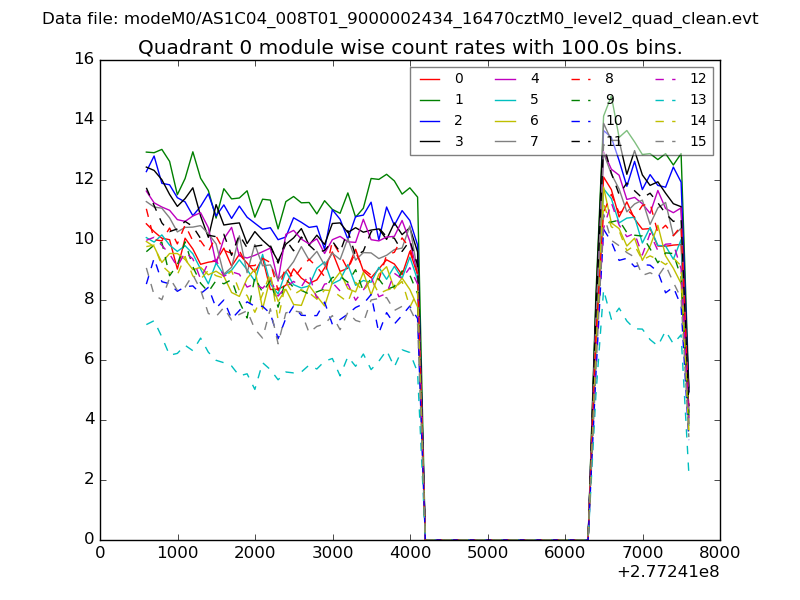 |
 |
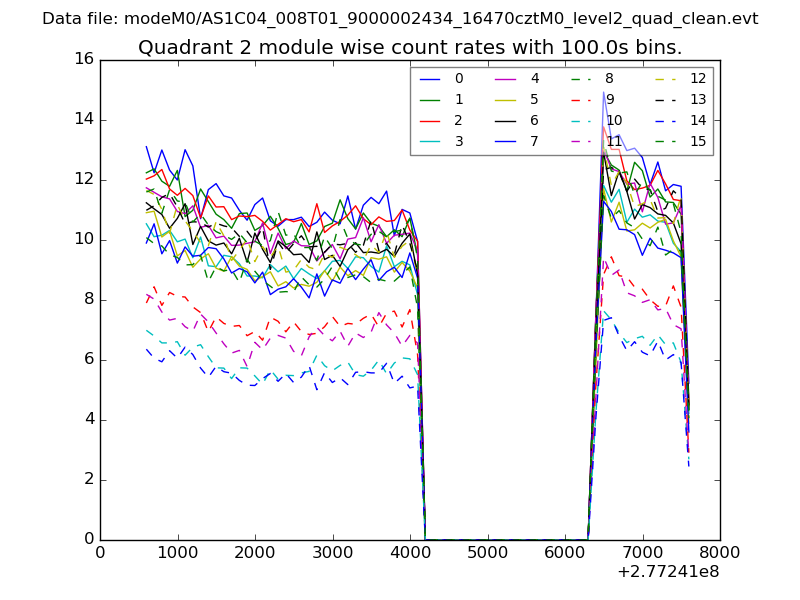
| Module-wise count rates for Quadrant B Data is divided into 100 sec bins |
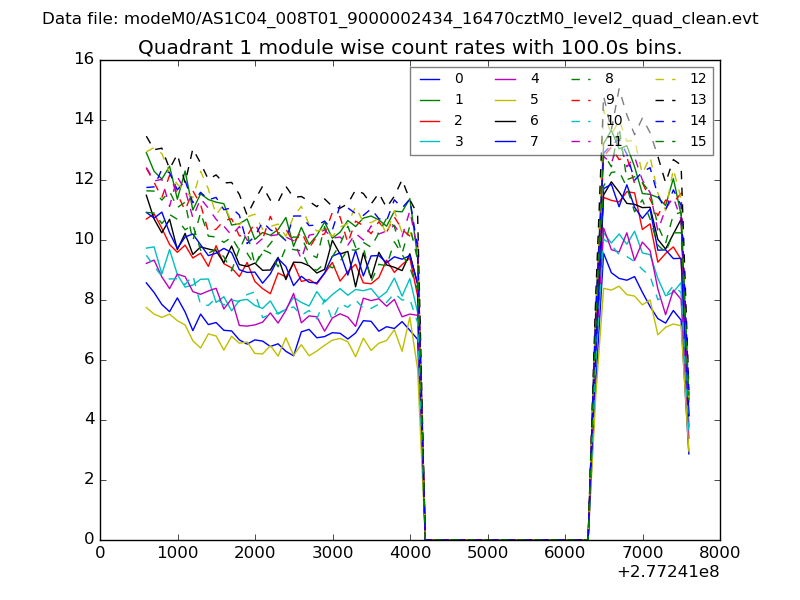 |
 |
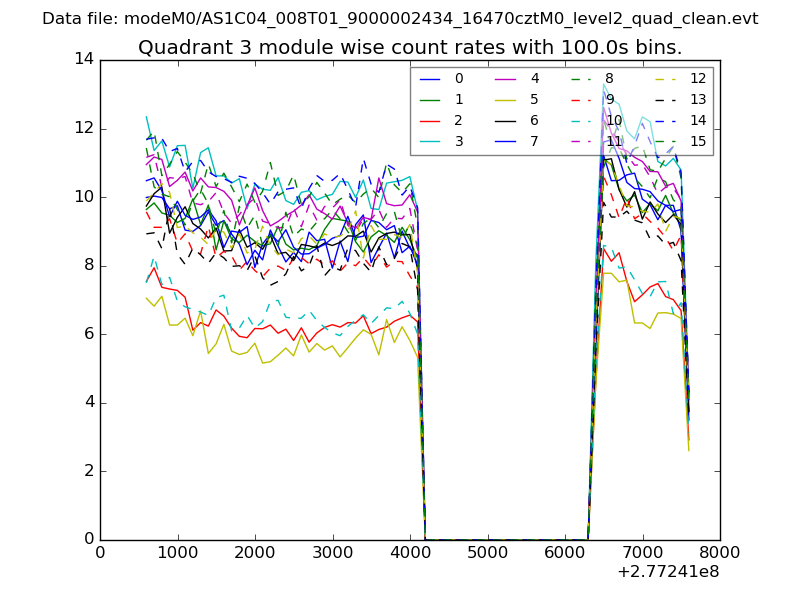
| Module-wise count rates for Quadrant C Data is divided into 100 sec bins |
 |
 |
| Module-wise count rates for Quadrant D Data is divided into 100 sec bins |
 |
 |
| Parameter | Plot |
|---|---|
| CZT HV Monitor | 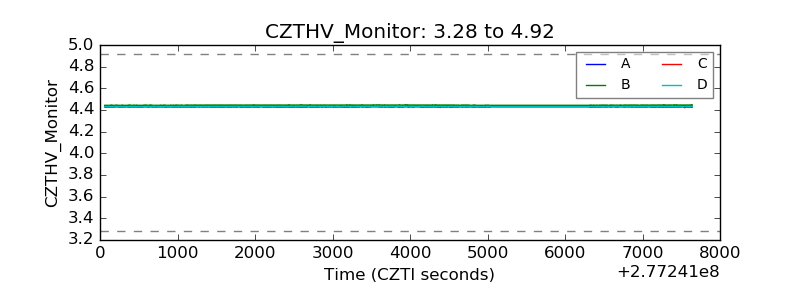 |
| D_VDD | 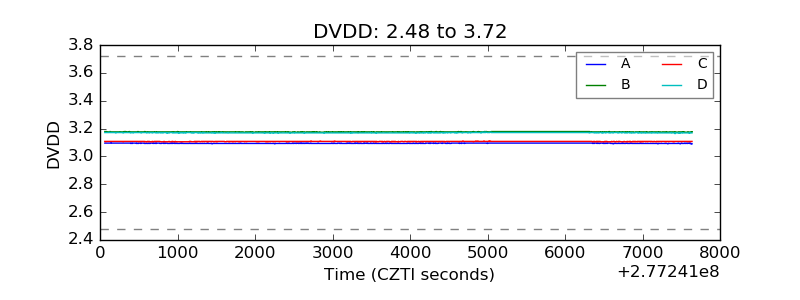 |
| Temperature 1 | 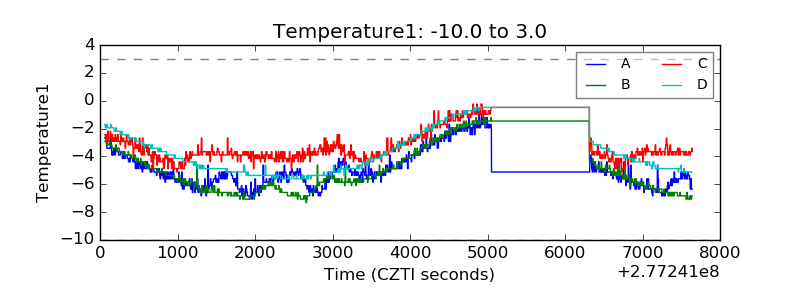 |
| Veto HV Monitor | 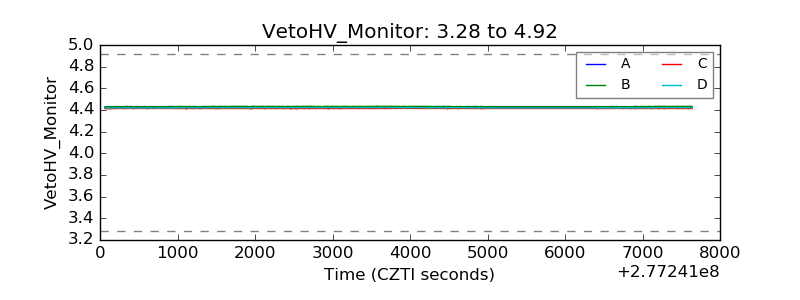 |
| Veto LLD | 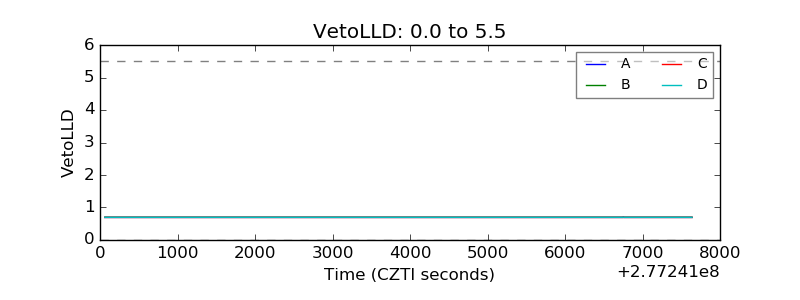 |
| Alpha Counter | 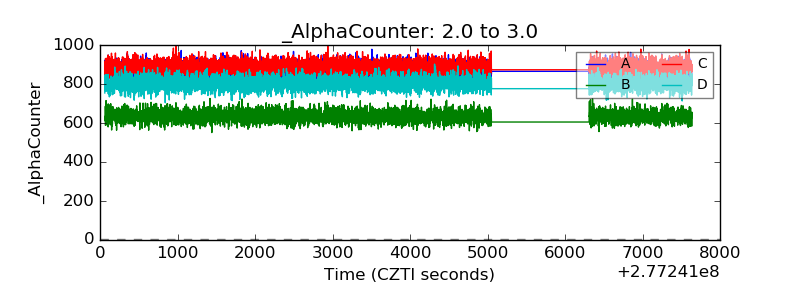 |
| _CPM_Rate | 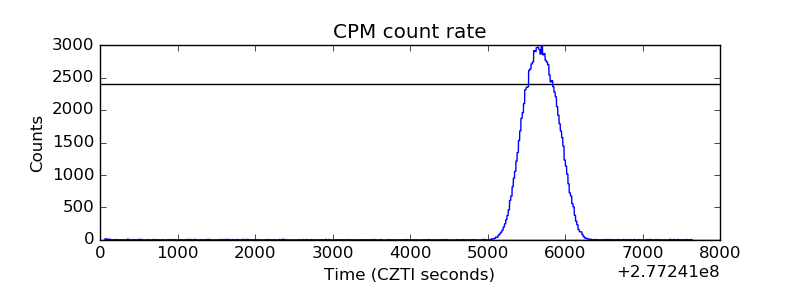 |
| CZT Counter | 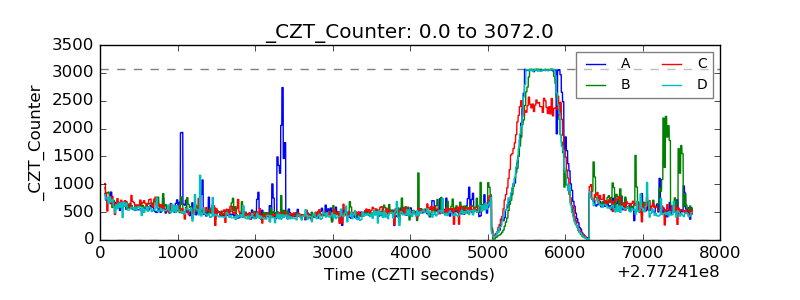 |
| +2.5 Volts monitor |  |
| +5 Volts monitor | 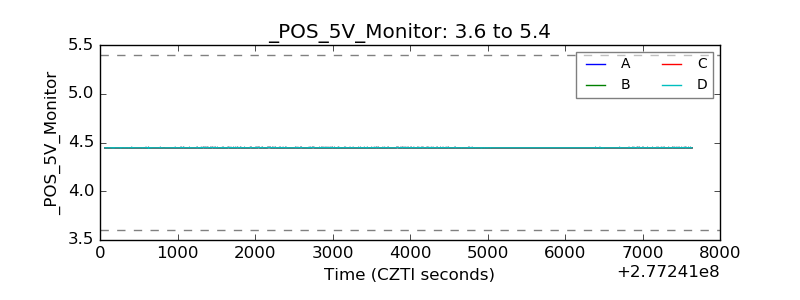 |
| _ROLL_ROT | 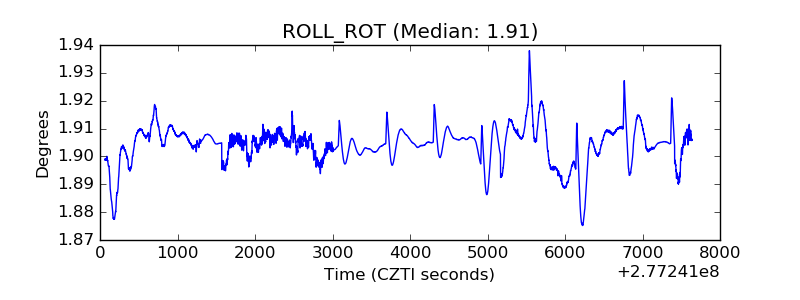 |
| _Roll_DEC | 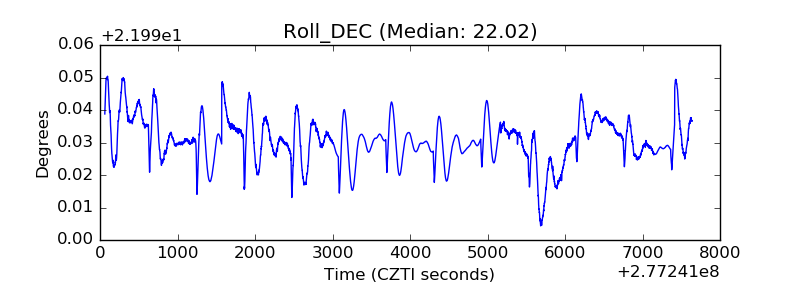 |
| _Roll_RA | 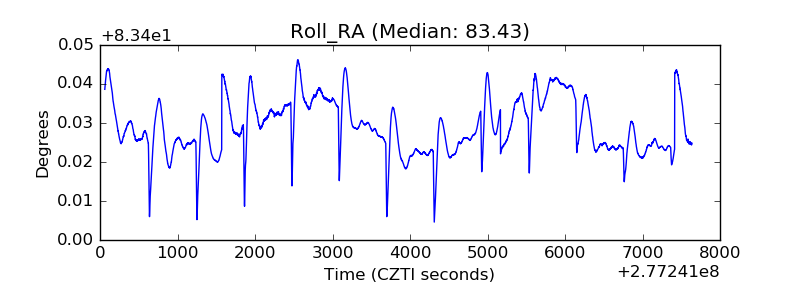 |
| Veto Counter | 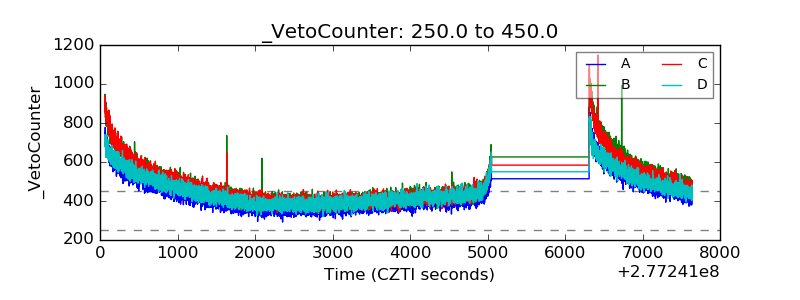 |