| Param | Original file | Final file |
|---|---|---|
| Filename | modeM0/AS1C04_008T01_9000002434_16472cztM0_level2.evt | modeM0/AS1C04_008T01_9000002434_16472cztM0_level2_quad_clean.evt |
| Size (bytes) | 75,821,760 | 19,745,280 |
| Size | 72.3 MB | 18.8 MB |
| Events in quadrant A | 746,290 | 128,290 |
| Events in quadrant B | 517,352 | 145,304 |
| Events in quadrant C | 503,748 | 133,373 |
| Events in quadrant D | 472,697 | 128,547 |
| Mode M0 | |||
|---|---|---|---|
| Quadrant | BADHDUFLAG | Total packets | Discarded packets |
| A | 0 | 2753 | 1 |
| B | 0 | 2078 | 1 |
| C | 0 | 2039 | 1 |
| D | 0 | 1900 | 1 |
| Mode SS | |||
|---|---|---|---|
| Quadrant | BADHDUFLAG | Total packets | Discarded packets |
| A | 0 | 16 | 0 |
| B | 0 | 16 | 0 |
| C | 0 | 16 | 0 |
| D | 0 | 16 | 0 |
| Quadrant | Total seconds | Saturated seconds | Saturation percentage |
|---|---|---|---|
| A | 780 | 103 | 13.205128% |
| B | 780 | 8 | 1.025641% |
| C | 780 | 22 | 2.820513% |
| D | 780 | 5 | 0.641026% |
Noise dominated data is calculated using 1-second bins in cleaned event files. If a bin has >2000 counts, and if more than 50% of those come from <1% of pixels, then it is considered to be noise-dominated and hence unusable.
| Quadrant | # 1 sec bins | Bins with >0 counts | Bins with >2000 counts | High rate bins dominated by noise | Noise dominated (total time) | Noise dominated (detector-on time) | Marked lightcurve |
|---|---|---|---|---|---|---|---|
| A | 781 | 781 | 87 | 87 | 11.14% | 11.14% | 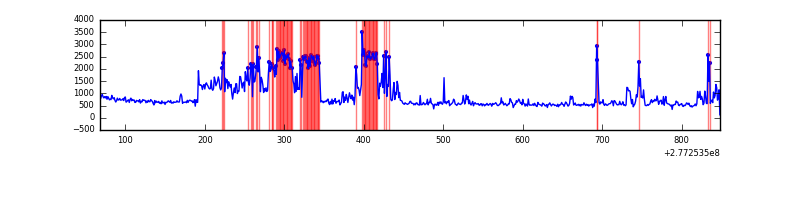 |
| B | 781 | 781 | 2 | 2 | 0.26% | 0.26% | 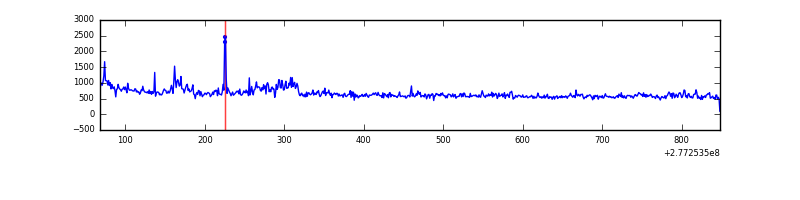 |
| C | 781 | 781 | 1 | 1 | 0.13% | 0.13% | 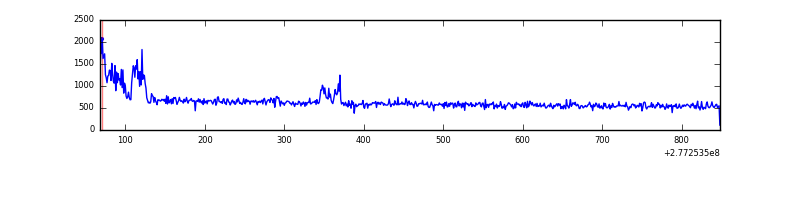 |
| D | 781 | 781 | 5 | 5 | 0.64% | 0.64% | 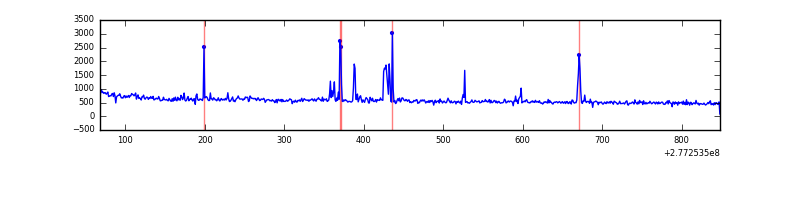 |
Top three noisy pixels from each quadrant. If the there are fewer than three noisy pixels in the level2.evt file, extra rows are filled as -1
| Pixel properties | Quadrant properties | ||||||
|---|---|---|---|---|---|---|---|
| Quadrant | DetID | PixID | Counts | Sigma | Mean | Median | Sigma |
| A | 15 | 174 | 325566 | 13647.71 | 109 | 107 | 23.8 |
| A | 0 | 226 | 991 | 37.07 | 109 | 107 | 23.8 |
| A | 3 | 137 | 722 | 25.79 | 109 | 107 | 23.8 |
| B | 15 | 35 | 19922 | 796.65 | 120 | 117 | 24.9 |
| B | 3 | 209 | 7993 | 316.81 | 120 | 117 | 24.9 |
| B | 4 | 173 | 7780 | 308.24 | 120 | 117 | 24.9 |
| C | 3 | 233 | 40110 | 1420.12 | 113 | 114 | 28.2 |
| C | 14 | 238 | 18181 | 641.5 | 113 | 114 | 28.2 |
| C | 7 | 247 | 2934 | 100.13 | 113 | 114 | 28.2 |
| D | 2 | 120 | 21574 | 738.04 | 111 | 108 | 29.1 |
| D | 8 | 195 | 10718 | 364.79 | 111 | 108 | 29.1 |
| D | 1 | 52 | 9114 | 309.64 | 111 | 108 | 29.1 |
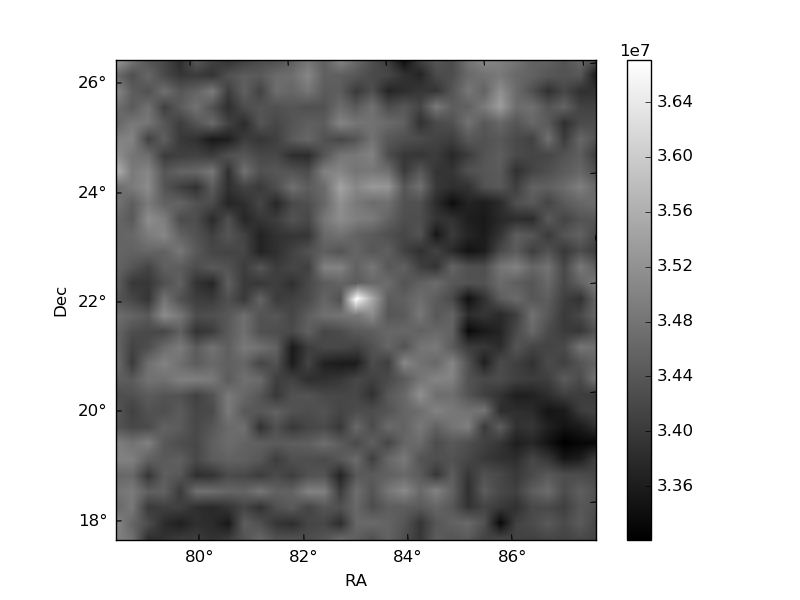
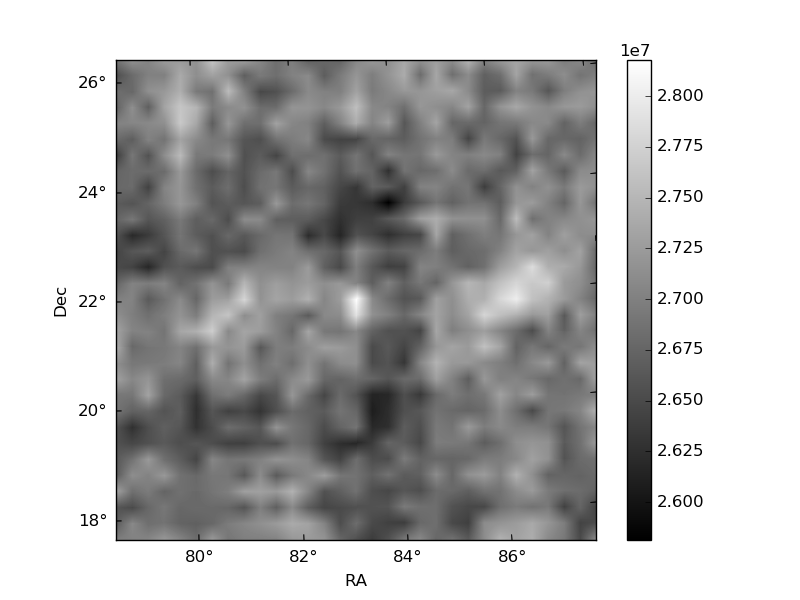
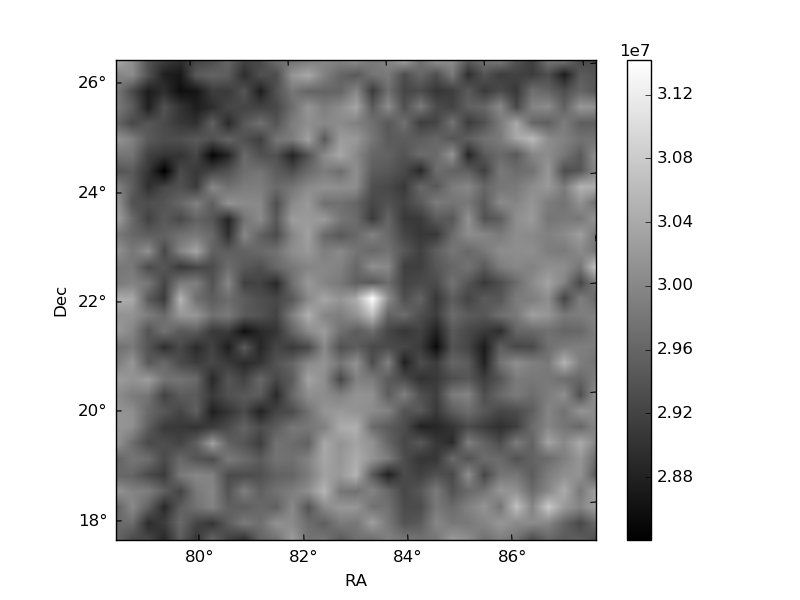
Histogram calculated using DETX and DETY for each event in the final _common_clean file
| Quadrant A | 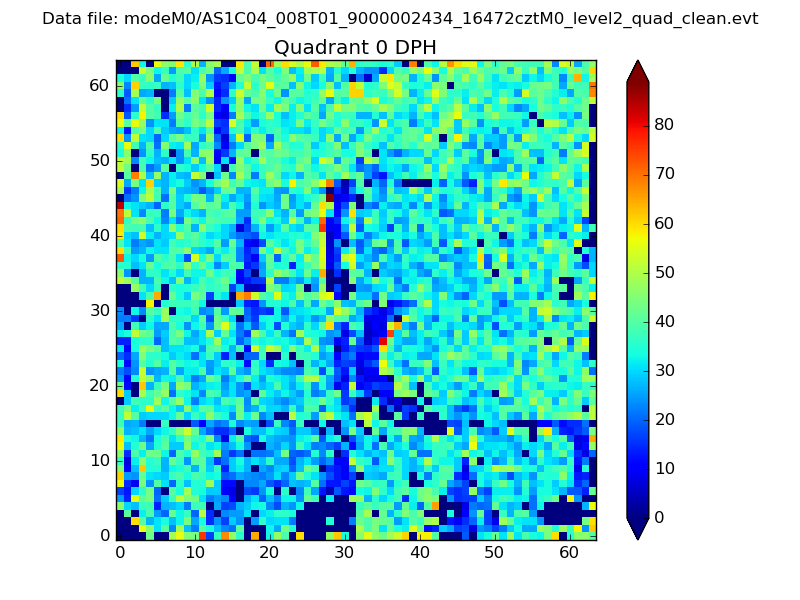 |
 |
Quadrant B |
|---|---|---|---|
| Quadrant D | 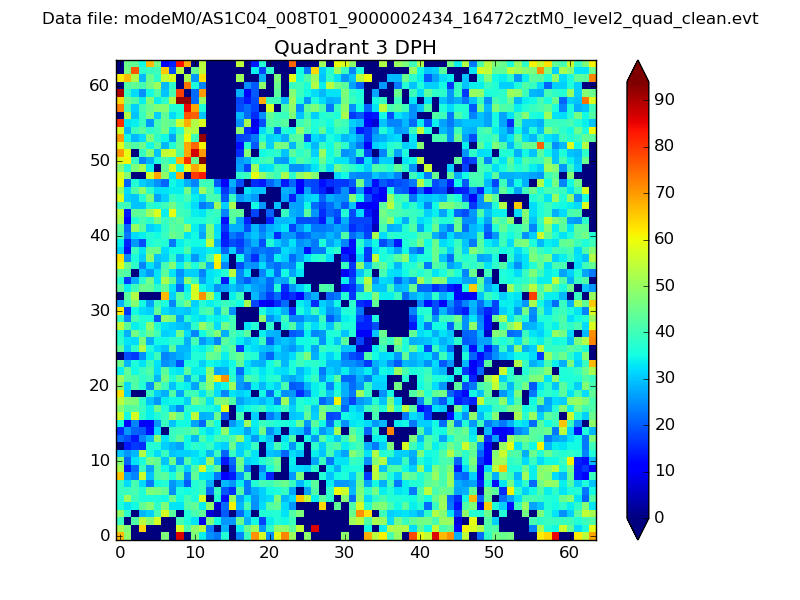 |
 |
Quadrant C |
| Plot type | Count rate plots | Images |
|---|---|---|
| Comparison with Poisson distribution Blue bars denote a histogram of data divided into 1 sec bins. Red curve is a Poisson curve with rate = median count rate of data. |
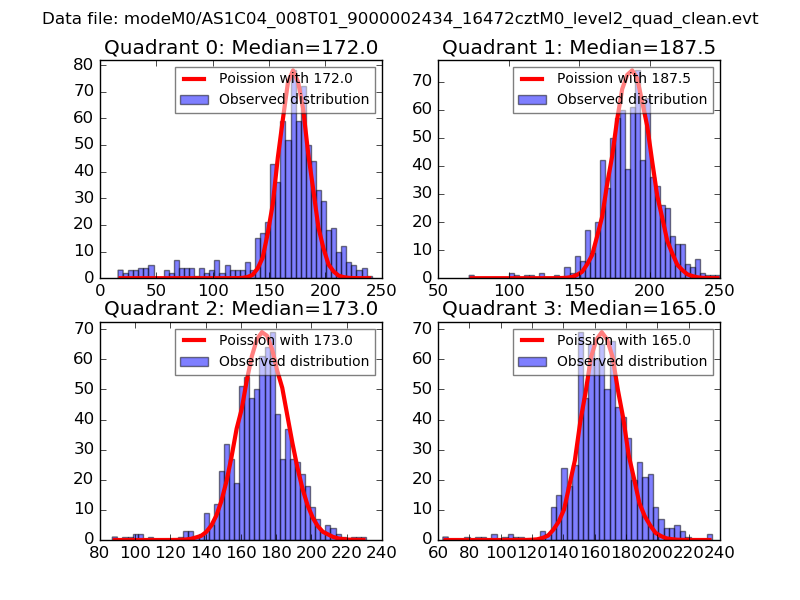 |
 |
| Quadrant-wise count rates Data is divided into 100 sec bins |
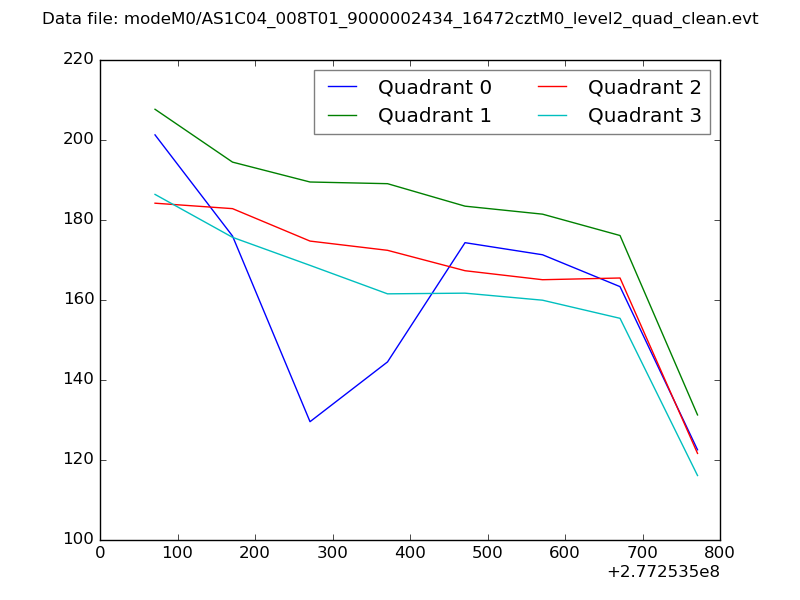 |
|
| Module-wise count rates for Quadrant A Data is divided into 100 sec bins |
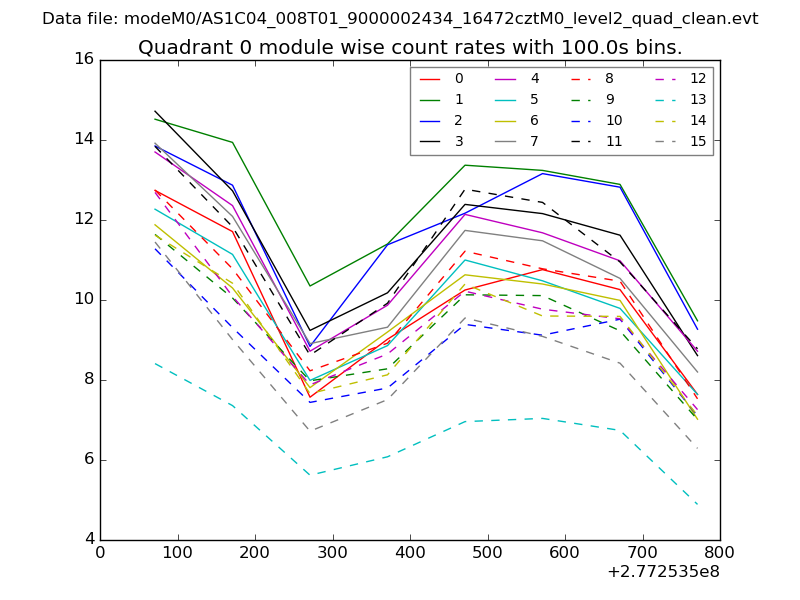 |
 |
| Module-wise count rates for Quadrant B Data is divided into 100 sec bins |
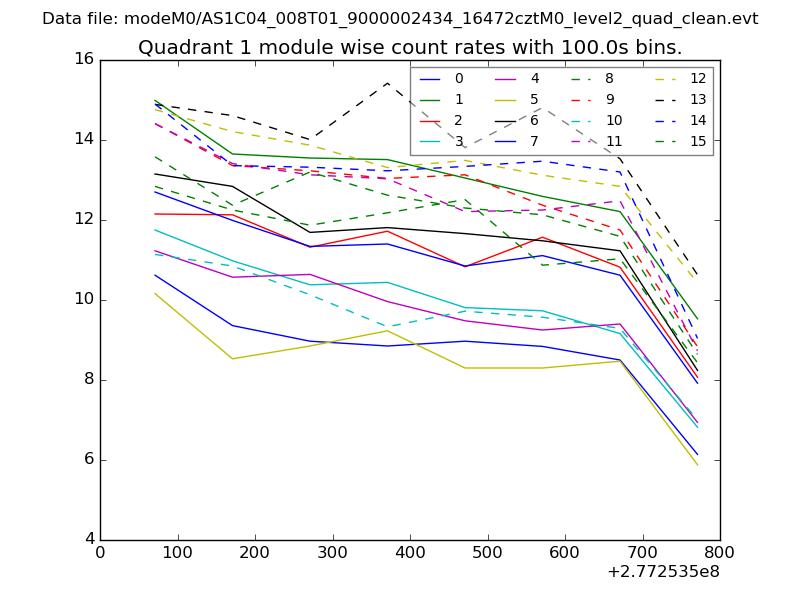 |
 |
| Module-wise count rates for Quadrant C Data is divided into 100 sec bins |
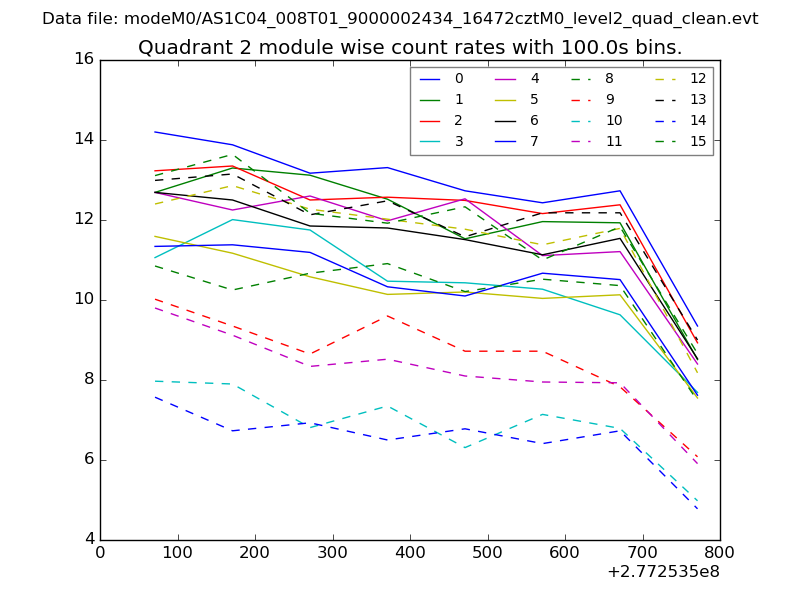 |
 |
| Module-wise count rates for Quadrant D Data is divided into 100 sec bins |
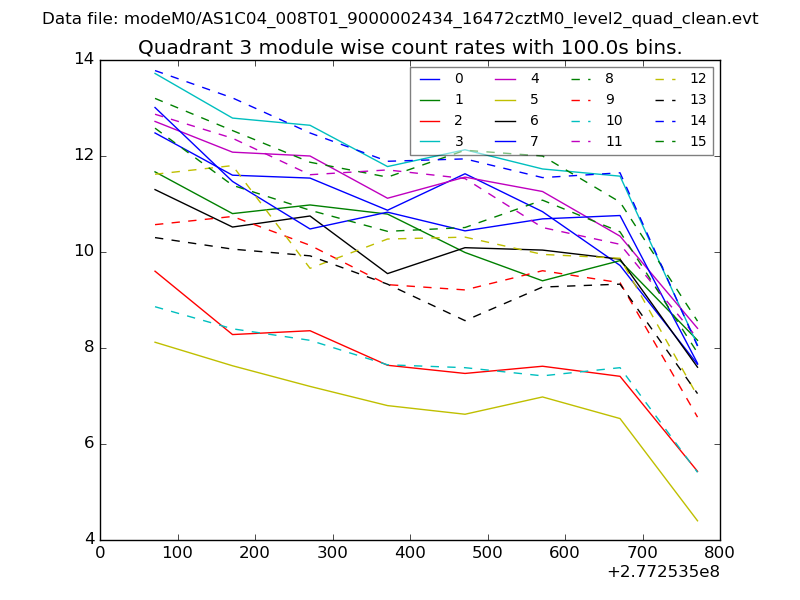 |
 |
| Parameter | Plot |
|---|---|
| CZT HV Monitor | 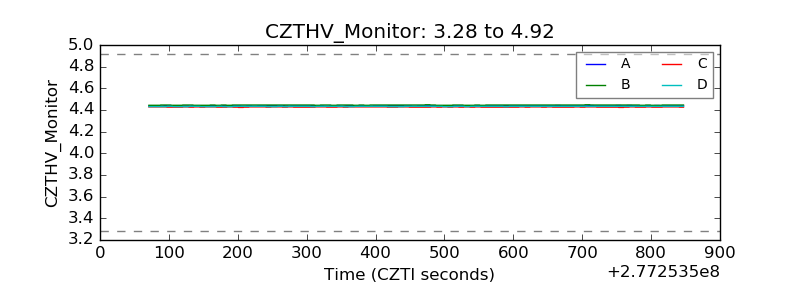 |
| D_VDD | 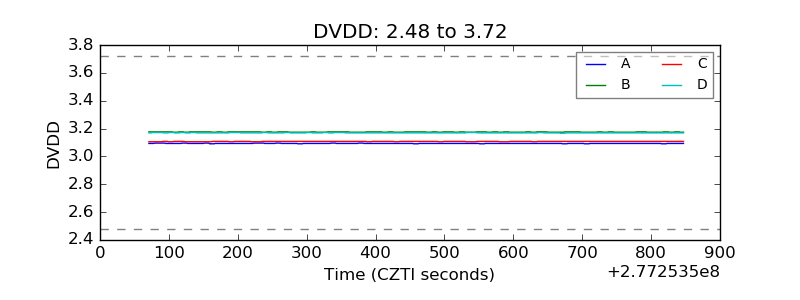 |
| Temperature 1 | 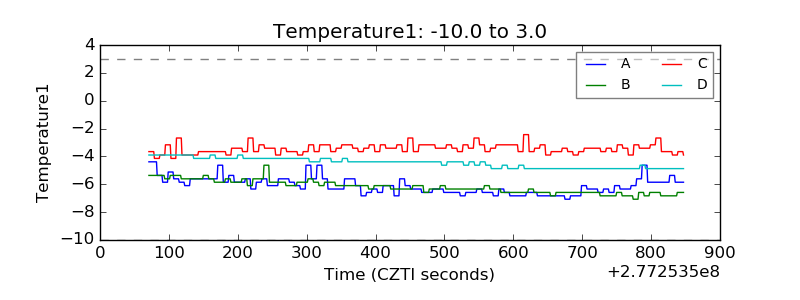 |
| Veto HV Monitor | 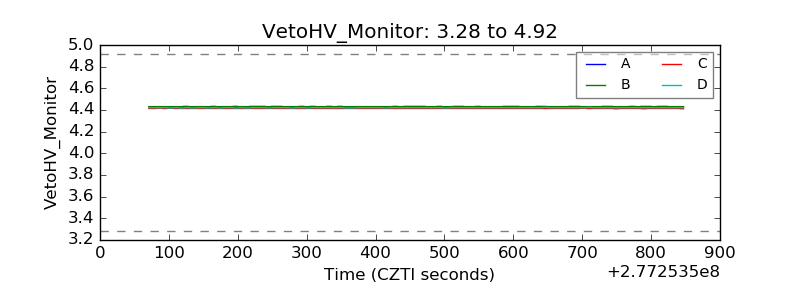 |
| Veto LLD |  |
| Alpha Counter | 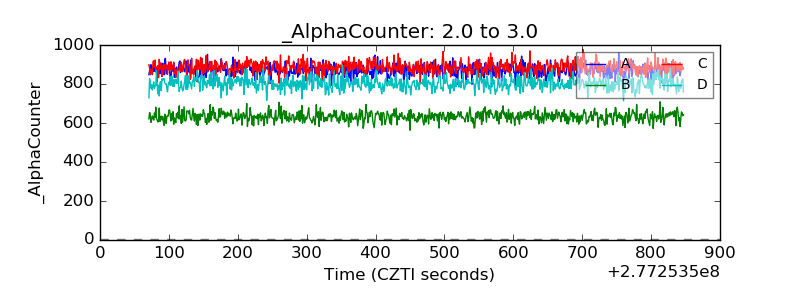 |
| _CPM_Rate | 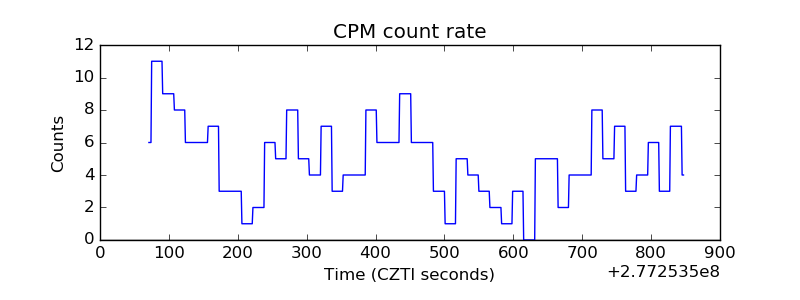 |
| CZT Counter | 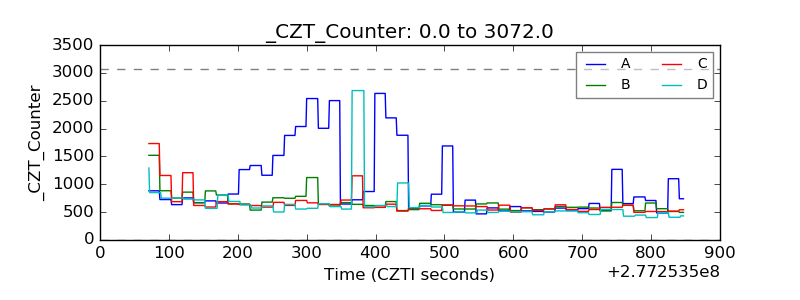 |
| +2.5 Volts monitor |  |
| +5 Volts monitor | 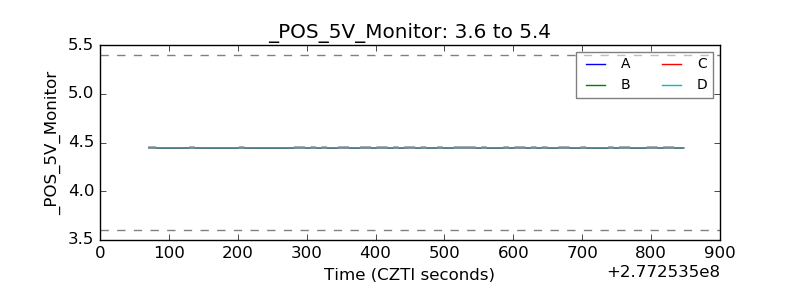 |
| _ROLL_ROT | 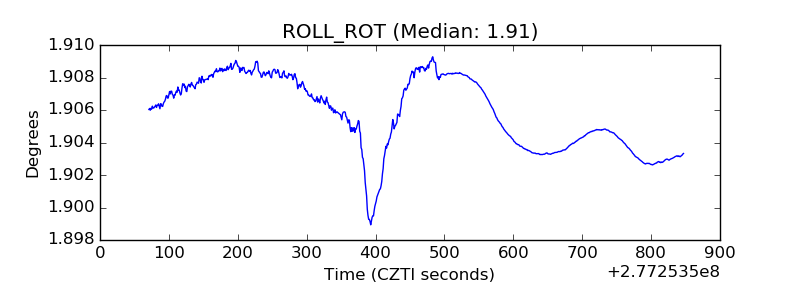 |
| _Roll_DEC | 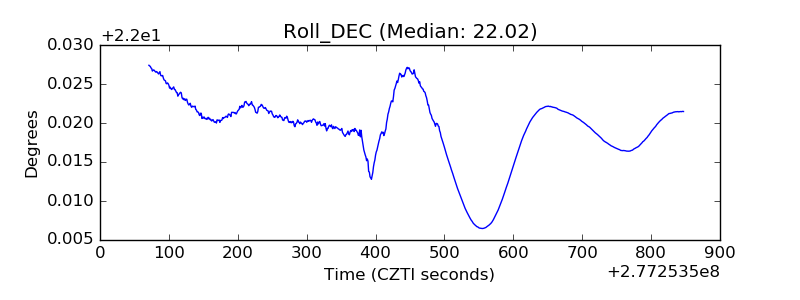 |
| _Roll_RA | 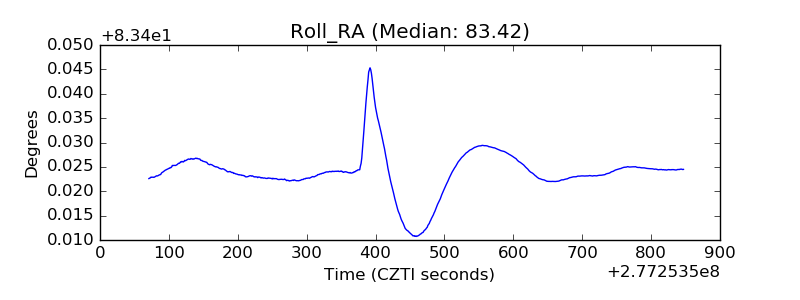 |
| Veto Counter | 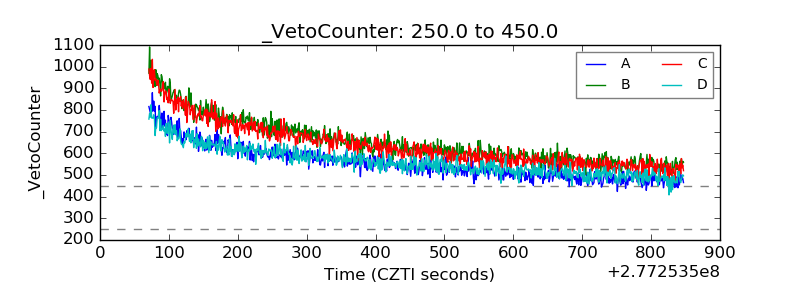 |