| Param | Original file | Final file |
|---|---|---|
| Filename | modeM0/AS1A05_108T01_9000002438cztM0_level2.fits | modeM0/AS1A05_108T01_9000002438cztM0_level2_quad_clean.evt |
| Size (bytes) | 707,797,440 | 632,505,600 |
| Size | 675.0 MB | 603.2 MB |
| Events in quadrant A | 4,223,616 | 3,513,215 |
| Events in quadrant B | 4,152,780 | 3,724,320 |
| Events in quadrant C | 4,235,112 | 3,531,099 |
| Events in quadrant D | 3,704,842 | 3,268,113 |
| Mode M9 | |||
|---|---|---|---|
| Quadrant | BADHDUFLAG | Total packets | Discarded packets |
| A | 0 | 116 | 0 |
| B | 0 | 116 | 0 |
| C | 0 | 116 | 0 |
| D | 0 | 116 | 0 |
| Mode SS | |||
|---|---|---|---|
| Quadrant | BADHDUFLAG | Total packets | Discarded packets |
| A | 0 | 1520 | 0 |
| B | 0 | 1520 | 0 |
| C | 0 | 1520 | 0 |
| D | 0 | 1520 | 0 |
| Mode M0 | |||
|---|---|---|---|
| Quadrant | BADHDUFLAG | Total packets | Discarded packets |
| A | 0 | 177086 | 0 |
| B | 0 | 165163 | 0 |
| C | 0 | 166820 | 0 |
| D | 0 | 158263 | 0 |
| Quadrant | Total seconds | Saturated seconds | Saturation percentage |
|---|---|---|---|
| A | 74642 | 3344 | 4.480051% |
| B | 74642 | 1287 | 1.724230% |
| C | 74643 | 1473 | 1.973393% |
| D | 74641 | 859 | 1.150842% |
Noise dominated data is calculated using 1-second bins in cleaned event files. If a bin has >2000 counts, and if more than 50% of those come from <1% of pixels, then it is considered to be noise-dominated and hence unusable.
| Quadrant | # 1 sec bins | Bins with >0 counts | Bins with >2000 counts | High rate bins dominated by noise | Noise dominated (total time) | Noise dominated (detector-on time) | Marked lightcurve |
|---|---|---|---|---|---|---|---|
| A | 86194 | 74619 | 0 | 0 | 0.00% | 0.00% | 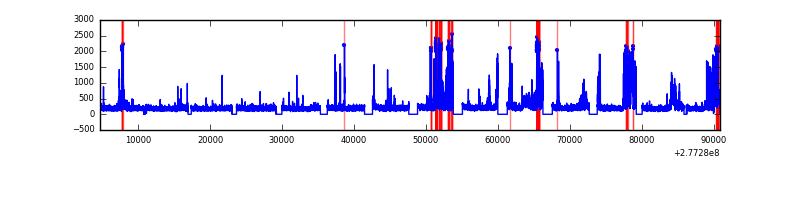 |
| B | 86194 | 74631 | 0 | 0 | 0.00% | 0.00% | 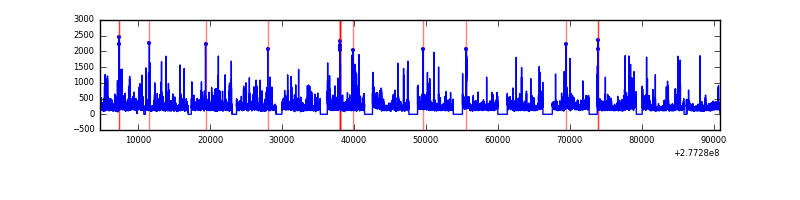 |
| C | 86193 | 74629 | 0 | 0 | 0.00% | 0.00% |  |
| D | 86194 | 74633 | 0 | 0 | 0.00% | 0.00% | 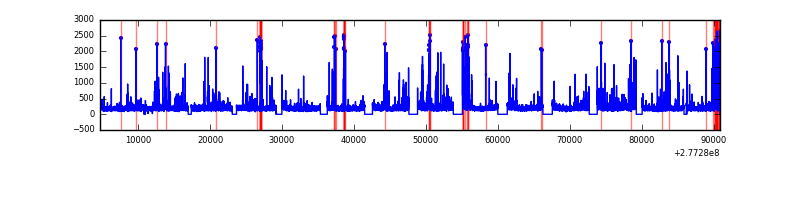 |
Top three noisy pixels from each quadrant. If the there are fewer than three noisy pixels in the level2.evt file, extra rows are filled as -1
| Pixel properties | Quadrant properties | ||||||
|---|---|---|---|---|---|---|---|
| Quadrant | DetID | PixID | Counts | Sigma | Mean | Median | Sigma |
| A | 0 | 29 | 4009 | 10.87 | 1098 | 1025 | 274.5 |
| A | 7 | 110 | 3476 | 8.93 | 1098 | 1025 | 274.5 |
| A | 0 | 30 | 3217 | 7.99 | 1098 | 1025 | 274.5 |
| B | 2 | 9 | 3303 | 10.49 | 1098 | 1046 | 215.2 |
| B | 2 | 8 | 2853 | 8.4 | 1098 | 1046 | 215.2 |
| B | 5 | 128 | 2770 | 8.01 | 1098 | 1046 | 215.2 |
| C | 1 | 80 | 3175 | 7.43 | 1116 | 1037 | 287.9 |
| C | 1 | 81 | 3145 | 7.32 | 1116 | 1037 | 287.9 |
| C | 12 | 241 | 3031 | 6.93 | 1116 | 1037 | 287.9 |
| D | 6 | 231 | 2769 | 6.51 | 1054 | 959 | 277.9 |
| D | 3 | 14 | 2697 | 6.25 | 1054 | 959 | 277.9 |
| D | 1 | 19 | 2633 | 6.02 | 1054 | 959 | 277.9 |
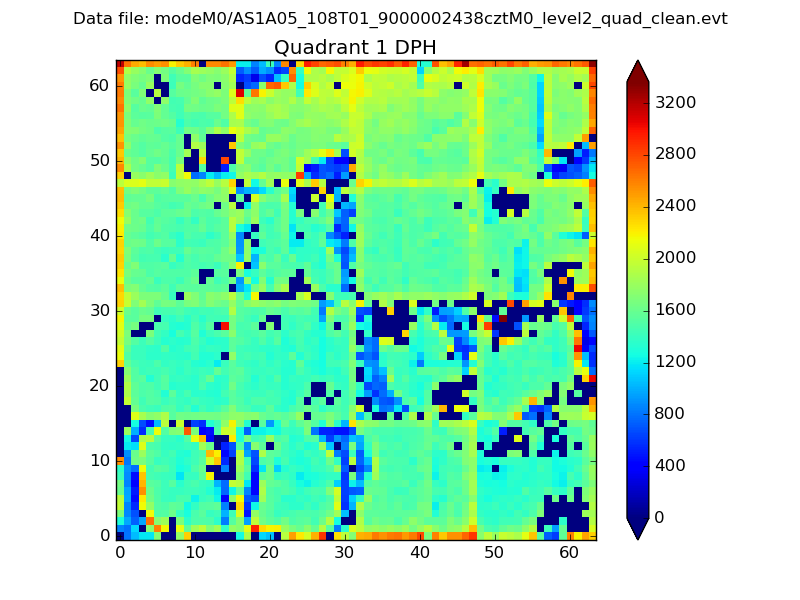
Histogram calculated using DETX and DETY for each event in the final _common_clean file
| Quadrant A |  |
 |
Quadrant B |
|---|---|---|---|
| Quadrant D |  |
 |
Quadrant C |
| Plot type | Count rate plots | Images |
|---|---|---|
| Comparison with Poisson distribution Blue bars denote a histogram of data divided into 1 sec bins. Red curve is a Poisson curve with rate = median count rate of data. |
 |
 |
| Quadrant-wise count rates Data is divided into 100 sec bins |
 |
|
| Module-wise count rates for Quadrant A Data is divided into 100 sec bins |
 |
 |
| Module-wise count rates for Quadrant B Data is divided into 100 sec bins |
 |
 |
| Module-wise count rates for Quadrant C Data is divided into 100 sec bins |
 |
 |
| Module-wise count rates for Quadrant D Data is divided into 100 sec bins |
 |
 |
| Parameter | Plot |
|---|---|
| CZT HV Monitor |  |
| D_VDD |  |
| Temperature 1 |  |
| Veto HV Monitor |  |
| Veto LLD |  |
| Alpha Counter |  |
| _CPM_Rate |  |
| CZT Counter |  |
| +2.5 Volts monitor |  |
| +5 Volts monitor |  |
| _ROLL_ROT |  |
| _Roll_DEC |  |
| _Roll_RA |  |
| Veto Counter |  |