| Param | Original file | Final file |
|---|---|---|
| Filename | modeM0/AS1A05_108T01_9000002438_16477cztM0_level2.evt | modeM0/AS1A05_108T01_9000002438_16477cztM0_level2_quad_clean.evt |
| Size (bytes) | 540,149,760 | 75,559,680 |
| Size | 515.1 MB | 72.1 MB |
| Events in quadrant A | 3,993,209 | 437,930 |
| Events in quadrant B | 4,205,706 | 448,147 |
| Events in quadrant C | 4,060,116 | 432,569 |
| Events in quadrant D | 3,574,226 | 431,572 |
| Mode M9 | |||
|---|---|---|---|
| Quadrant | BADHDUFLAG | Total packets | Discarded packets |
| A | 0 | 2 | 0 |
| B | 0 | 2 | 0 |
| C | 0 | 2 | 0 |
| D | 0 | 2 | 0 |
| Mode SS | |||
|---|---|---|---|
| Quadrant | BADHDUFLAG | Total packets | Discarded packets |
| A | 0 | 156 | 0 |
| B | 0 | 156 | 0 |
| C | 0 | 156 | 0 |
| D | 0 | 156 | 0 |
| Mode M0 | |||
|---|---|---|---|
| Quadrant | BADHDUFLAG | Total packets | Discarded packets |
| A | 0 | 17054 | 8 |
| B | 0 | 17421 | 5 |
| C | 0 | 16768 | 5 |
| D | 0 | 16227 | 7 |
| Quadrant | Total seconds | Saturated seconds | Saturation percentage |
|---|---|---|---|
| A | 7732 | 322 | 4.164511% |
| B | 7732 | 314 | 4.061045% |
| C | 7733 | 295 | 3.814820% |
| D | 7731 | 193 | 2.496443% |
Noise dominated data is calculated using 1-second bins in cleaned event files. If a bin has >2000 counts, and if more than 50% of those come from <1% of pixels, then it is considered to be noise-dominated and hence unusable.
| Quadrant | # 1 sec bins | Bins with >0 counts | Bins with >2000 counts | High rate bins dominated by noise | Noise dominated (total time) | Noise dominated (detector-on time) | Marked lightcurve |
|---|---|---|---|---|---|---|---|
| A | 7950 | 7734 | 73 | 73 | 0.92% | 0.94% | 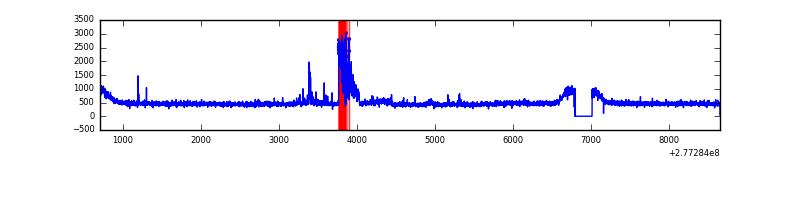 |
| B | 7950 | 7735 | 19 | 19 | 0.24% | 0.25% | 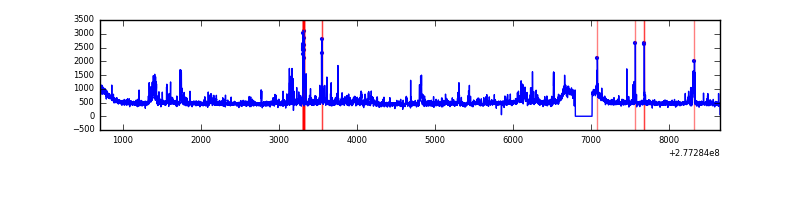 |
| C | 7950 | 7734 | 0 | 0 | 0.00% | 0.00% | 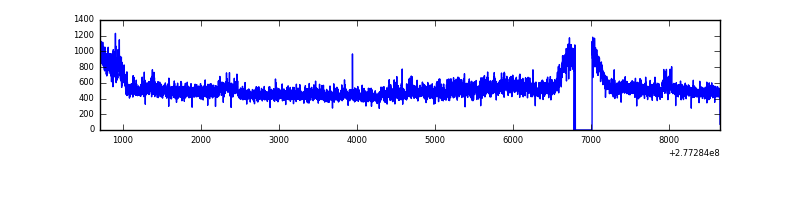 |
| D | 7950 | 7735 | 7 | 7 | 0.09% | 0.09% | 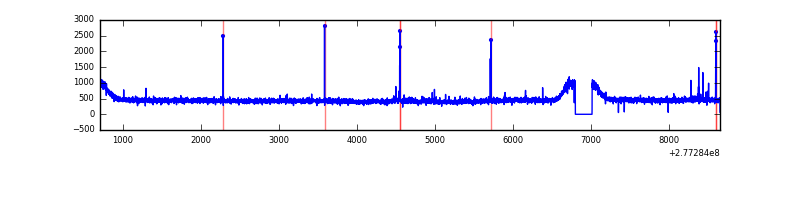 |
Top three noisy pixels from each quadrant. If the there are fewer than three noisy pixels in the level2.evt file, extra rows are filled as -1
| Pixel properties | Quadrant properties | ||||||
|---|---|---|---|---|---|---|---|
| Quadrant | DetID | PixID | Counts | Sigma | Mean | Median | Sigma |
| A | 15 | 174 | 357136 | 1858.24 | 939 | 914 | 191.7 |
| A | 15 | 190 | 13114 | 63.64 | 939 | 914 | 191.7 |
| A | 0 | 226 | 8117 | 37.57 | 939 | 914 | 191.7 |
| B | 4 | 48 | 129571 | 697.64 | 943 | 916 | 184.4 |
| B | 3 | 209 | 108731 | 584.63 | 943 | 916 | 184.4 |
| B | 10 | 16 | 97205 | 522.13 | 943 | 916 | 184.4 |
| C | 3 | 233 | 201293 | 932.08 | 910 | 914 | 215.0 |
| C | 7 | 247 | 165685 | 766.44 | 910 | 914 | 215.0 |
| C | 14 | 238 | 137292 | 634.37 | 910 | 914 | 215.0 |
| D | 10 | 70 | 40127 | 171.58 | 928 | 900 | 228.6 |
| D | 2 | 234 | 31061 | 131.93 | 928 | 900 | 228.6 |
| D | 13 | 168 | 26075 | 110.12 | 928 | 900 | 228.6 |
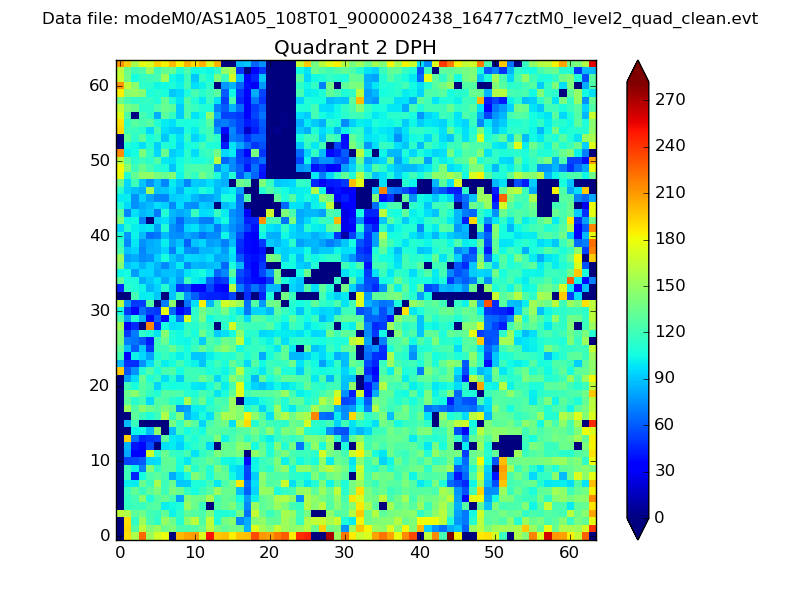
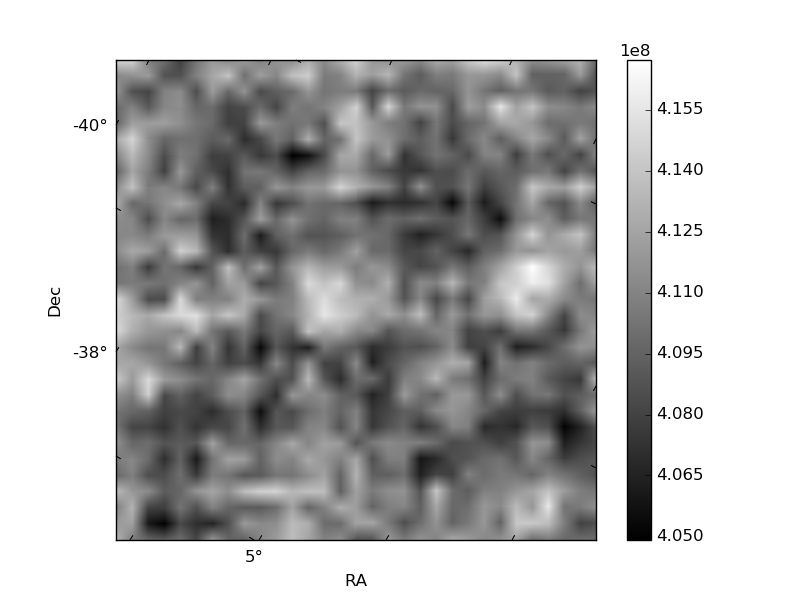
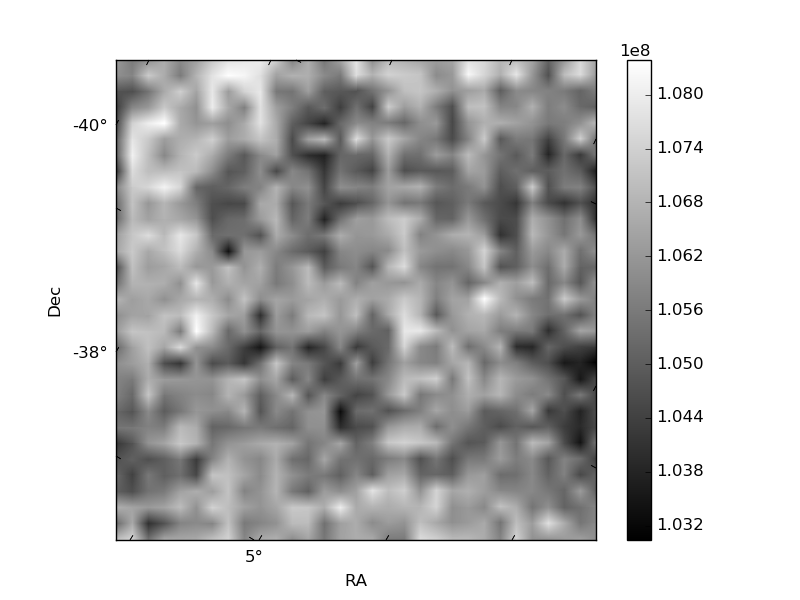
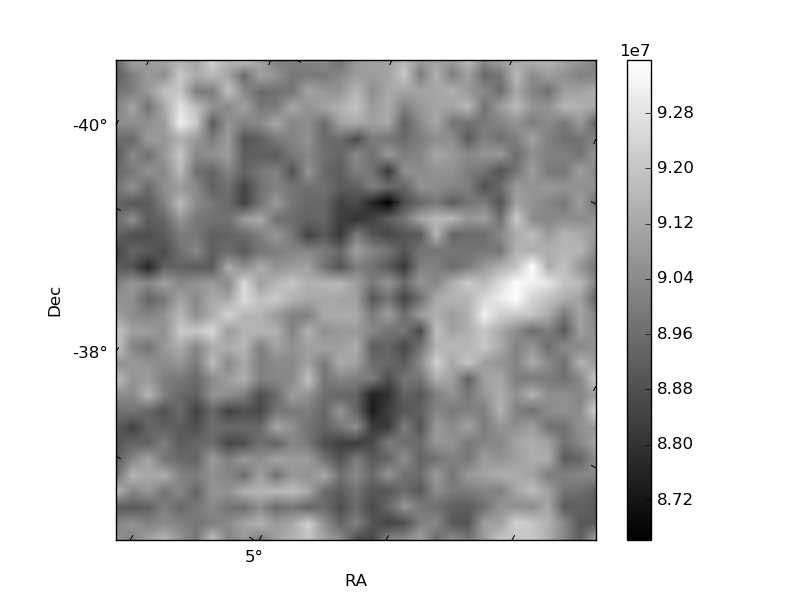
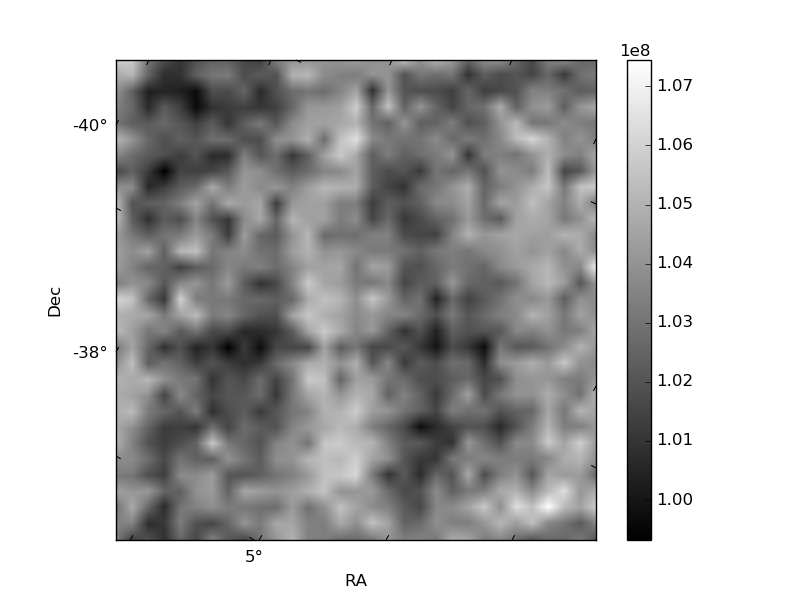
Histogram calculated using DETX and DETY for each event in the final _common_clean file
| Quadrant A | 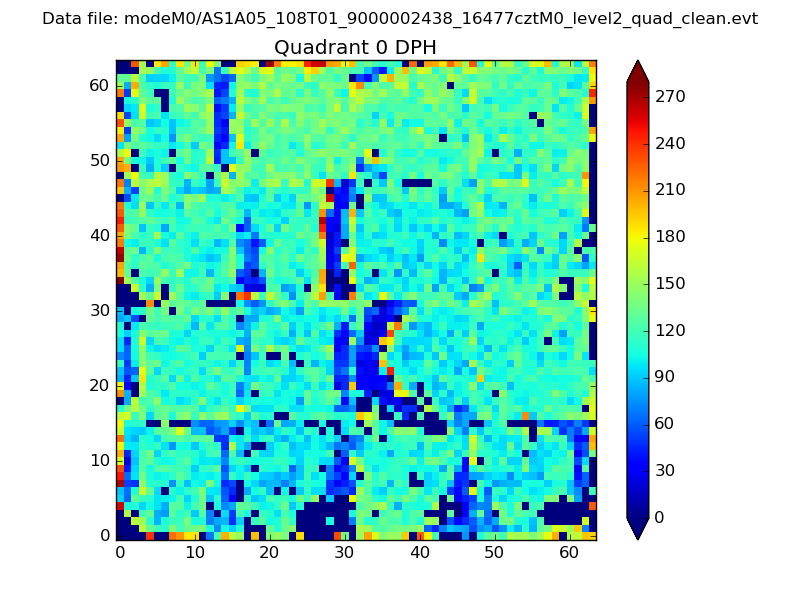 |
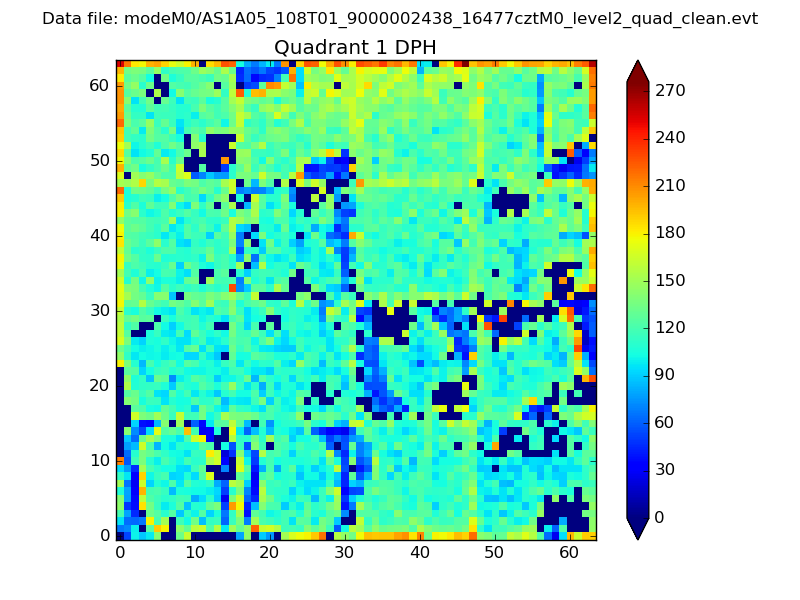 |
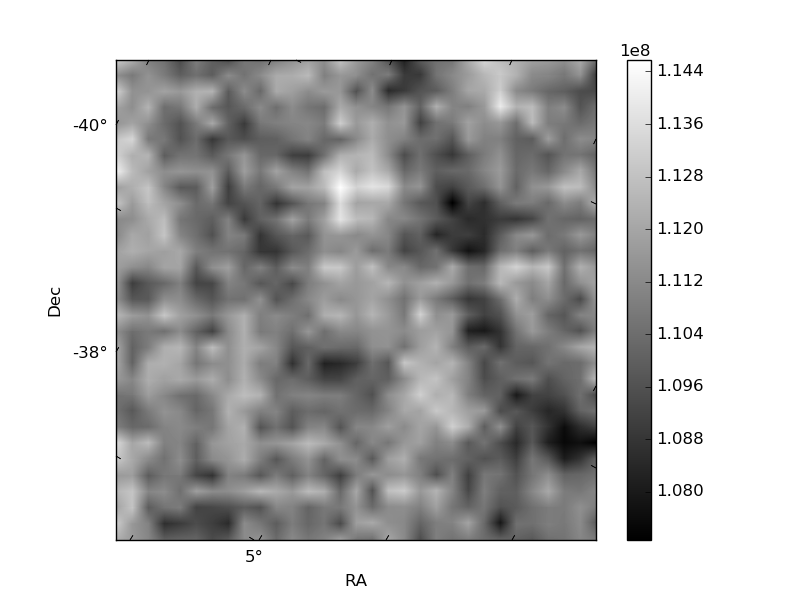
Quadrant B |
|---|---|---|---|
| Quadrant D | 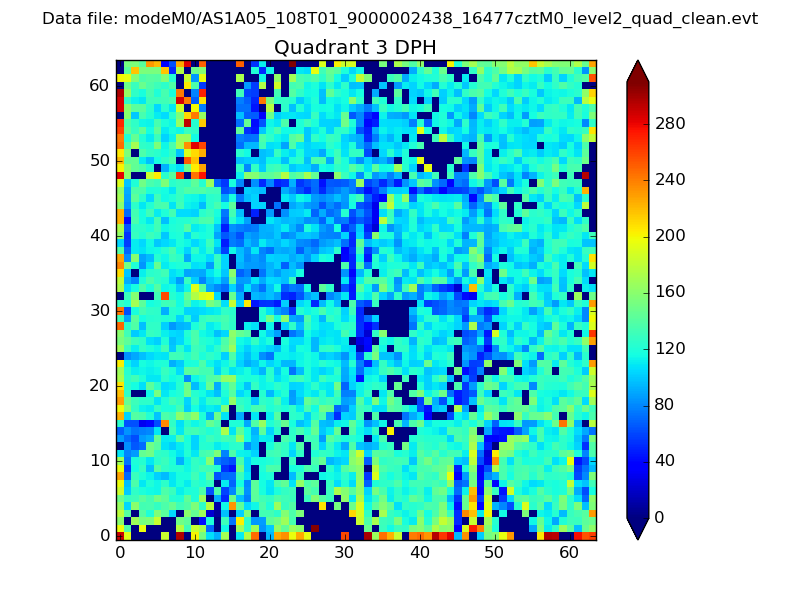 |
 |
Quadrant C |
| Plot type | Count rate plots | Images |
|---|---|---|
| Comparison with Poisson distribution Blue bars denote a histogram of data divided into 1 sec bins. Red curve is a Poisson curve with rate = median count rate of data. |
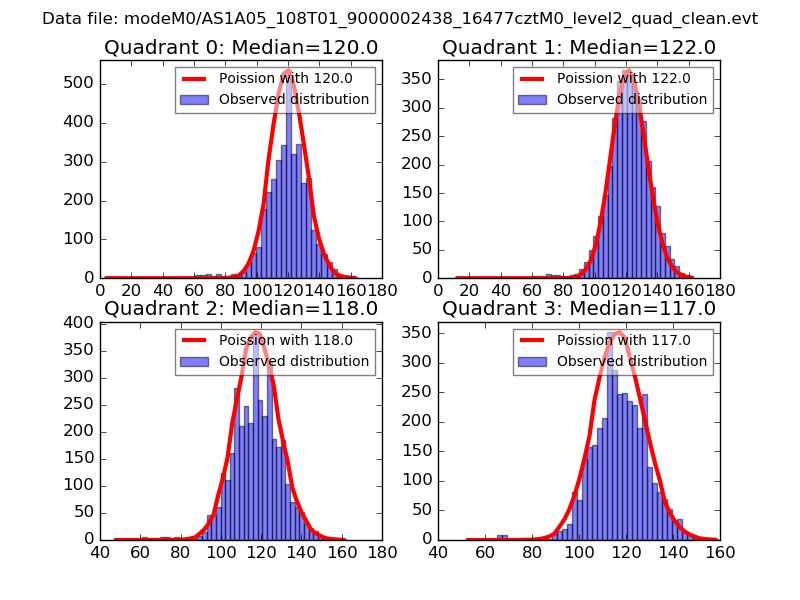 |
 |
| Quadrant-wise count rates Data is divided into 100 sec bins |
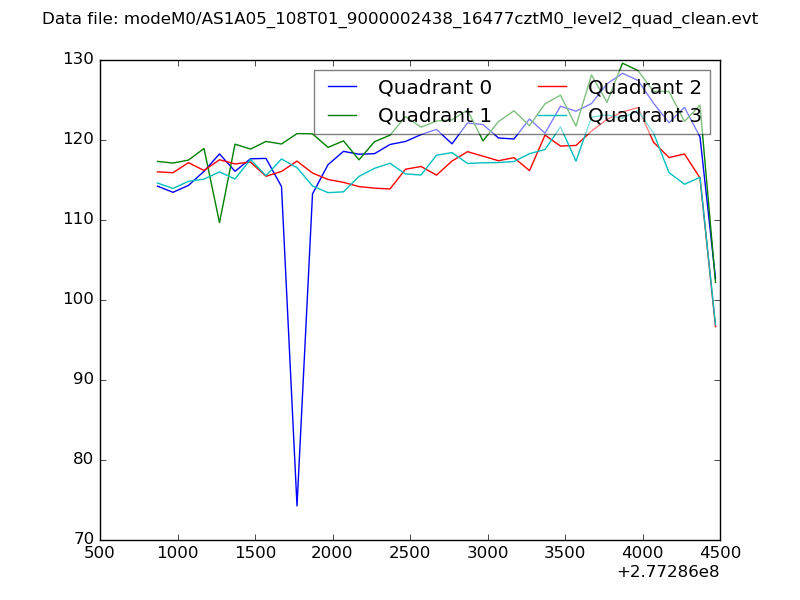 |
|
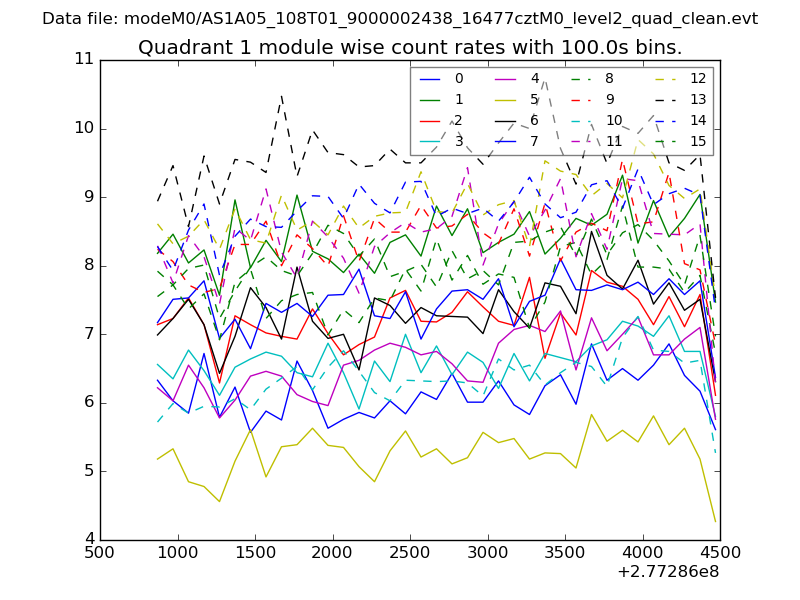
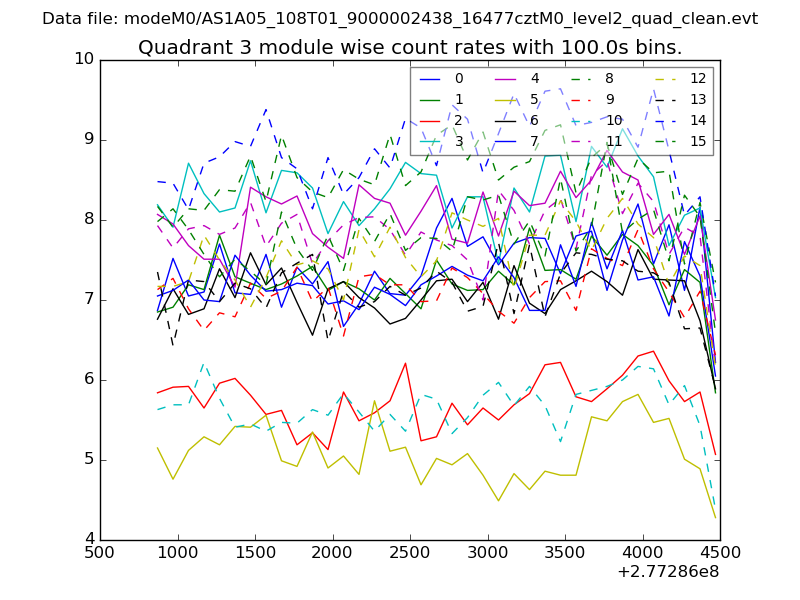
| Module-wise count rates for Quadrant A Data is divided into 100 sec bins |
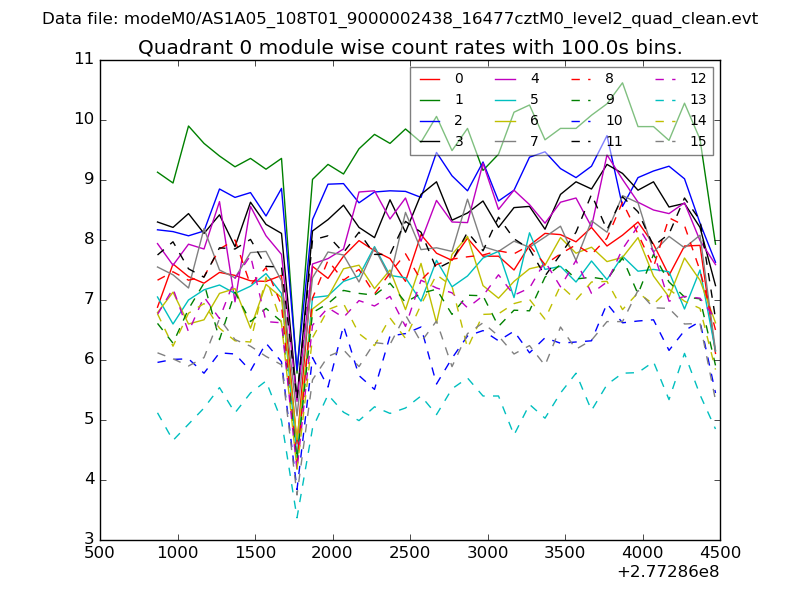 |
 |
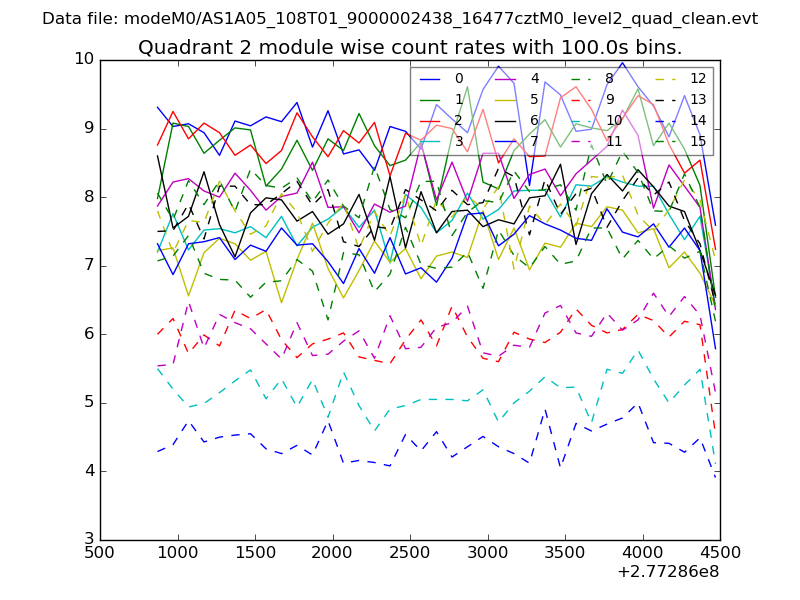
| Module-wise count rates for Quadrant B Data is divided into 100 sec bins |
 |
 |
| Module-wise count rates for Quadrant C Data is divided into 100 sec bins |
 |
 |
| Module-wise count rates for Quadrant D Data is divided into 100 sec bins |
 |
 |
| Parameter | Plot |
|---|---|
| CZT HV Monitor | 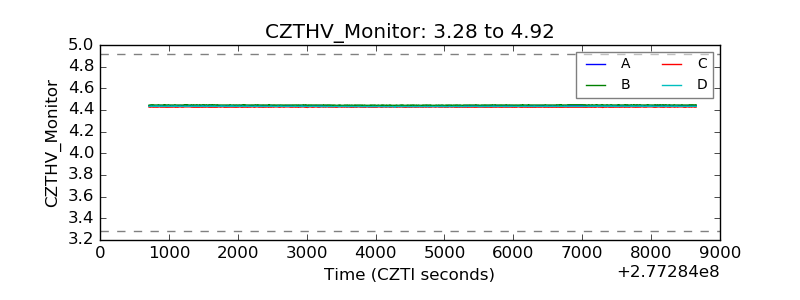 |
| D_VDD | 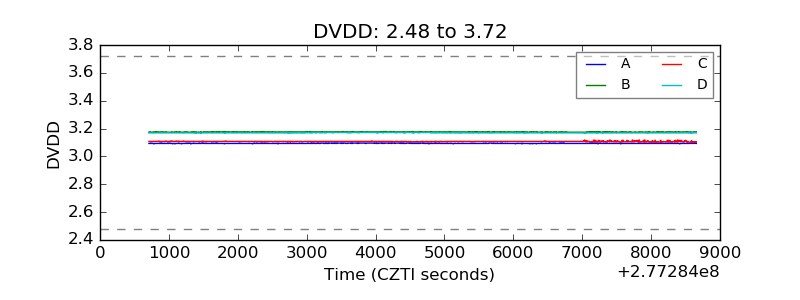 |
| Temperature 1 | 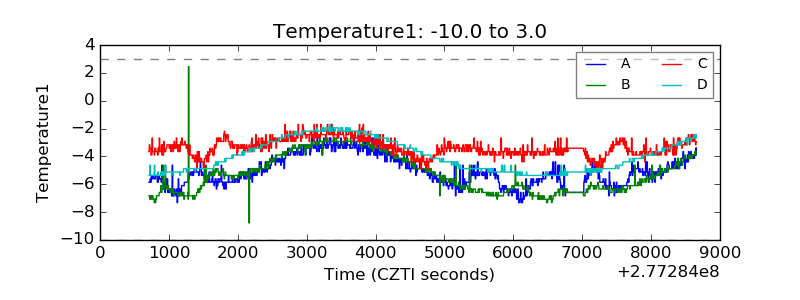 |
| Veto HV Monitor | 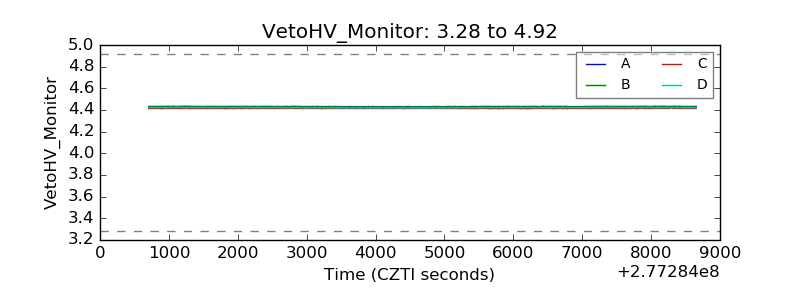 |
| Veto LLD | 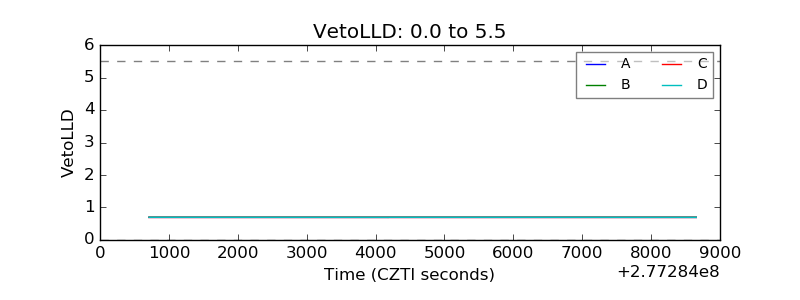 |
| Alpha Counter | 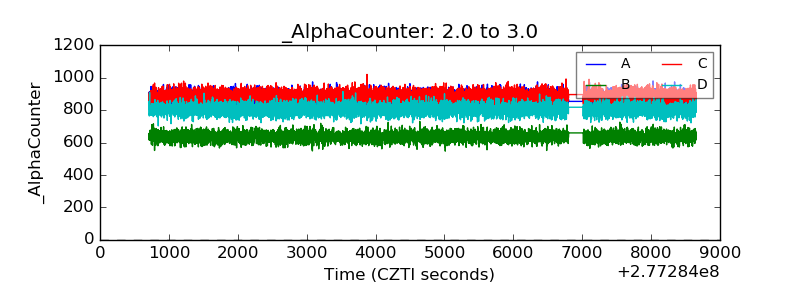 |
| _CPM_Rate | 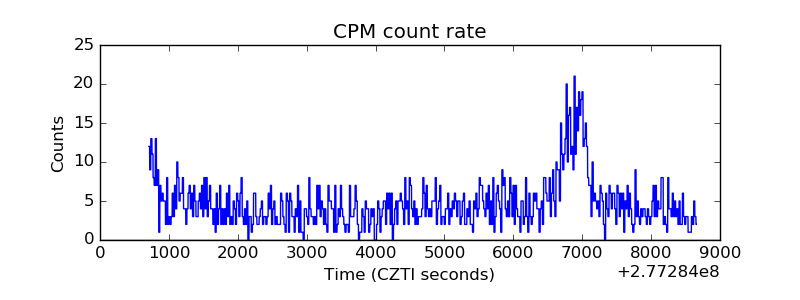 |
| CZT Counter | 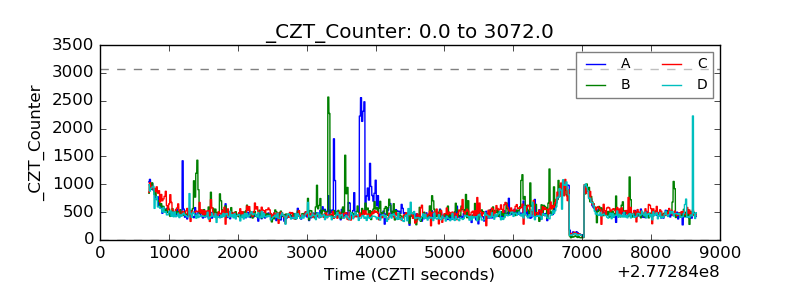 |
| +2.5 Volts monitor |  |
| +5 Volts monitor |  |
| _ROLL_ROT | 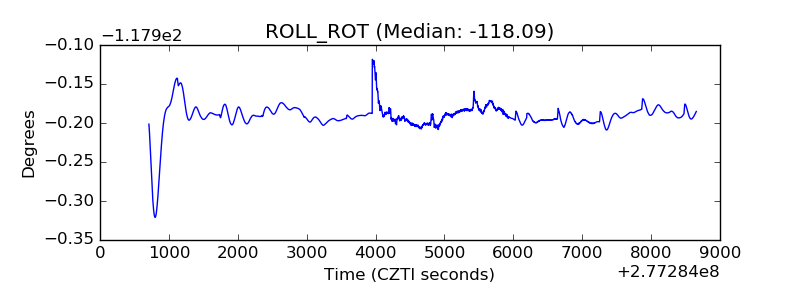 |
| _Roll_DEC |  |
| _Roll_RA | 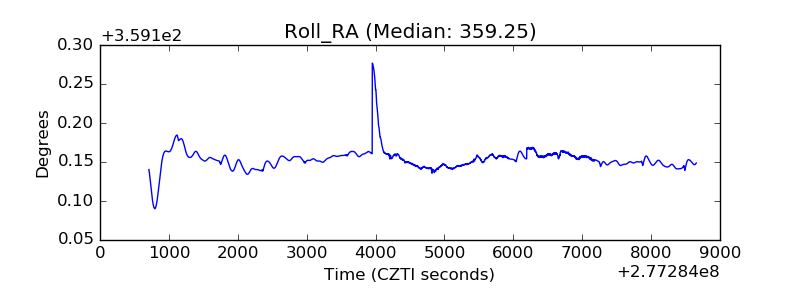 |
| Veto Counter | 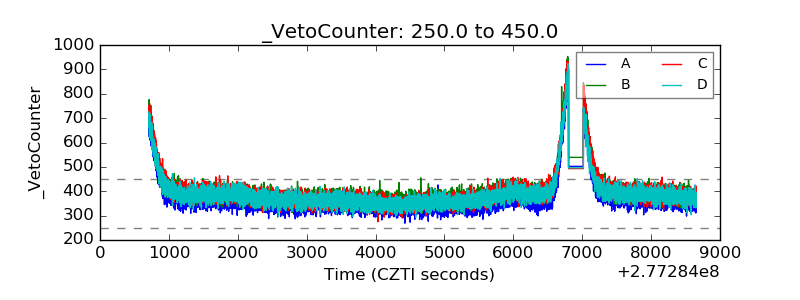 |