| Param | Original file | Final file |
|---|---|---|
| Filename | modeM0/AS1A05_108T01_9000002438_16480cztM0_level2.evt | modeM0/AS1A05_108T01_9000002438_16480cztM0_level2_quad_clean.evt |
| Size (bytes) | 1,301,754,240 | 240,030,720 |
| Size | 1.2 GB | 228.9 MB |
| Events in quadrant A | 8,998,680 | 1,503,919 |
| Events in quadrant B | 10,180,535 | 1,520,194 |
| Events in quadrant C | 9,892,058 | 1,465,794 |
| Events in quadrant D | 9,050,589 | 1,454,617 |
| Mode M9 | |||
|---|---|---|---|
| Quadrant | BADHDUFLAG | Total packets | Discarded packets |
| A | 0 | 21 | 0 |
| B | 0 | 21 | 0 |
| C | 0 | 21 | 0 |
| D | 0 | 21 | 0 |
| Mode SS | |||
|---|---|---|---|
| Quadrant | BADHDUFLAG | Total packets | Discarded packets |
| A | 0 | 392 | 0 |
| B | 0 | 392 | 0 |
| C | 0 | 392 | 0 |
| D | 0 | 392 | 0 |
| Mode M0 | |||
|---|---|---|---|
| Quadrant | BADHDUFLAG | Total packets | Discarded packets |
| A | 0 | 39787 | 5 |
| B | 0 | 42512 | 4 |
| C | 0 | 41144 | 4 |
| D | 0 | 40581 | 4 |
| Quadrant | Total seconds | Saturated seconds | Saturation percentage |
|---|---|---|---|
| A | 19253 | 441 | 2.290552% |
| B | 19253 | 553 | 2.872280% |
| C | 19253 | 553 | 2.872280% |
| D | 19253 | 393 | 2.041240% |
Noise dominated data is calculated using 1-second bins in cleaned event files. If a bin has >2000 counts, and if more than 50% of those come from <1% of pixels, then it is considered to be noise-dominated and hence unusable.
| Quadrant | # 1 sec bins | Bins with >0 counts | Bins with >2000 counts | High rate bins dominated by noise | Noise dominated (total time) | Noise dominated (detector-on time) | Marked lightcurve |
|---|---|---|---|---|---|---|---|
| A | 21279 | 19254 | 4 | 4 | 0.02% | 0.02% | 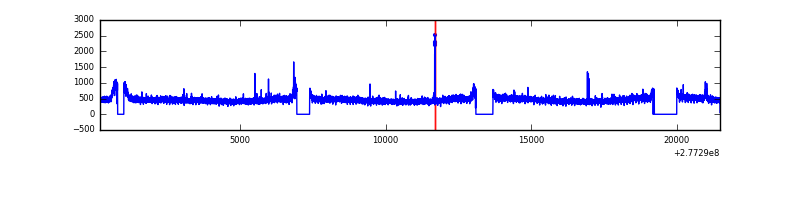 |
| B | 21279 | 19254 | 27 | 27 | 0.13% | 0.14% | 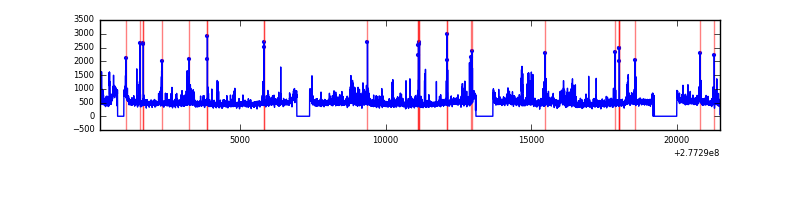 |
| C | 21279 | 19255 | 0 | 0 | 0.00% | 0.00% | 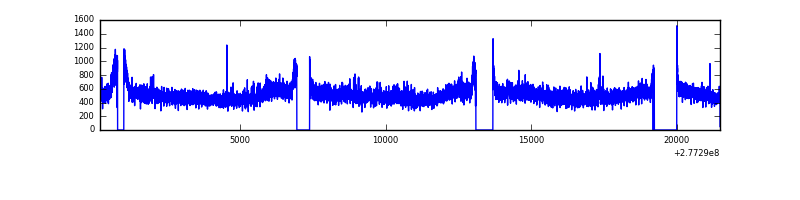 |
| D | 21279 | 19255 | 49 | 49 | 0.23% | 0.25% | 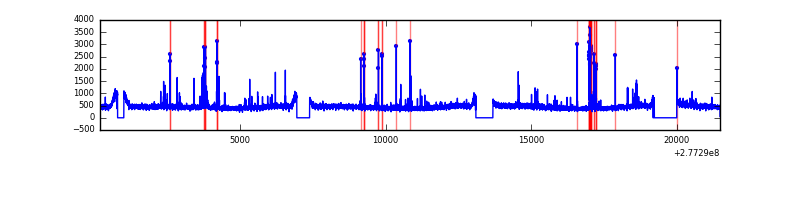 |
Top three noisy pixels from each quadrant. If the there are fewer than three noisy pixels in the level2.evt file, extra rows are filled as -1
| Pixel properties | Quadrant properties | ||||||
|---|---|---|---|---|---|---|---|
| Quadrant | DetID | PixID | Counts | Sigma | Mean | Median | Sigma |
| A | 15 | 174 | 100609 | 210.29 | 2312 | 2254 | 467.7 |
| A | 0 | 226 | 20312 | 38.61 | 2312 | 2254 | 467.7 |
| A | 3 | 137 | 17384 | 32.35 | 2312 | 2254 | 467.7 |
| B | 15 | 35 | 252258 | 560.69 | 2304 | 2238 | 445.9 |
| B | 4 | 48 | 215213 | 477.61 | 2304 | 2238 | 445.9 |
| B | 3 | 209 | 208041 | 461.53 | 2304 | 2238 | 445.9 |
| C | 7 | 247 | 457026 | 866.59 | 2218 | 2229 | 524.8 |
| C | 3 | 233 | 448143 | 849.66 | 2218 | 2229 | 524.8 |
| C | 14 | 238 | 335411 | 634.86 | 2218 | 2229 | 524.8 |
| D | 10 | 70 | 275171 | 493.52 | 2257 | 2182 | 553.1 |
| D | 13 | 168 | 122738 | 217.95 | 2257 | 2182 | 553.1 |
| D | 1 | 52 | 100513 | 177.77 | 2257 | 2182 | 553.1 |
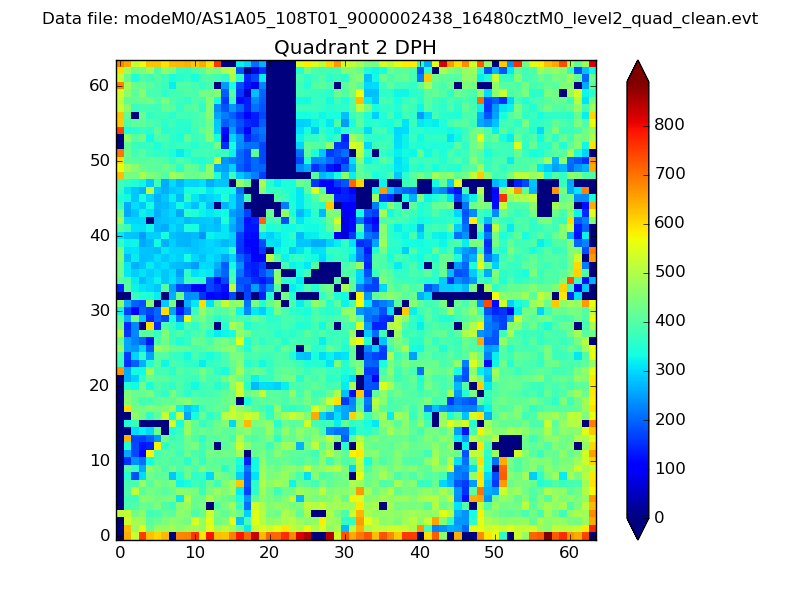
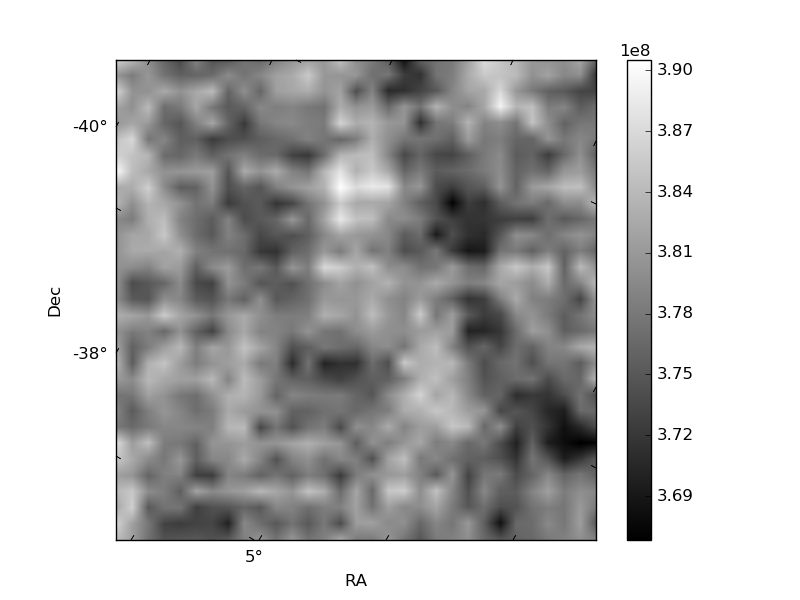
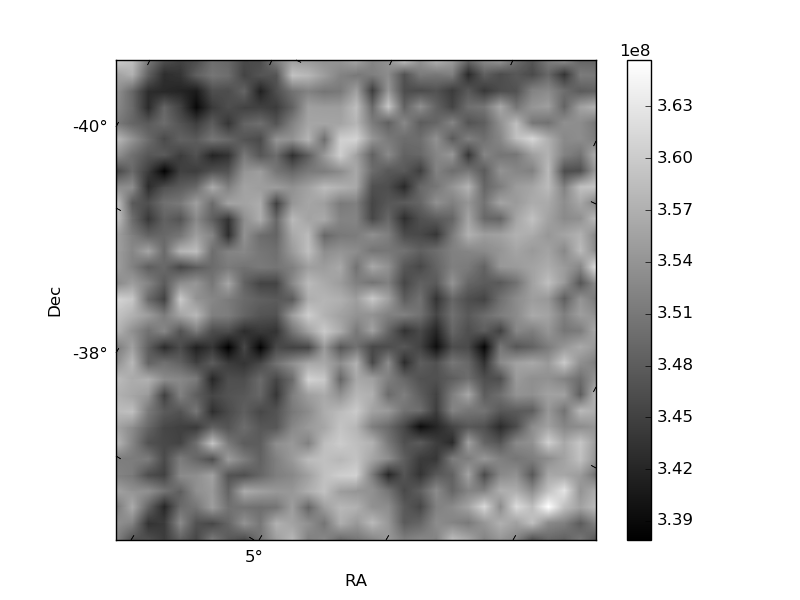
Histogram calculated using DETX and DETY for each event in the final _common_clean file
| Quadrant A | 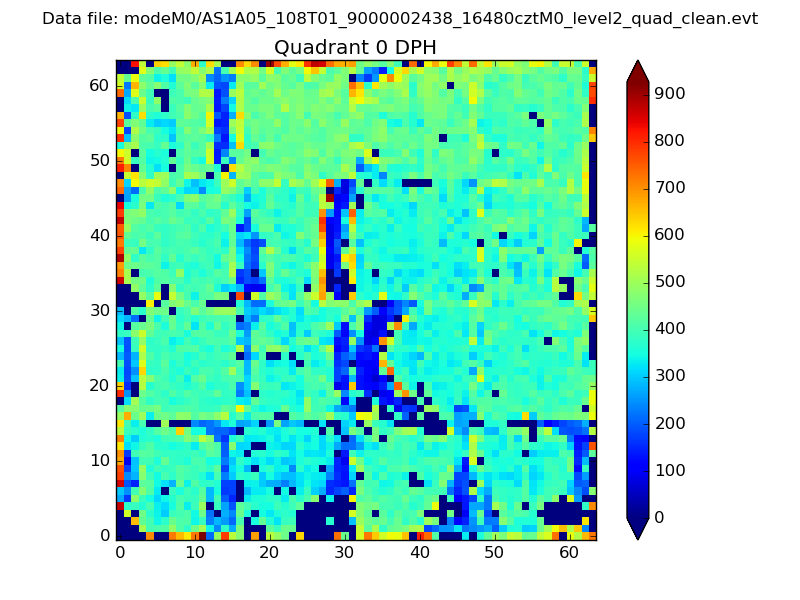 |
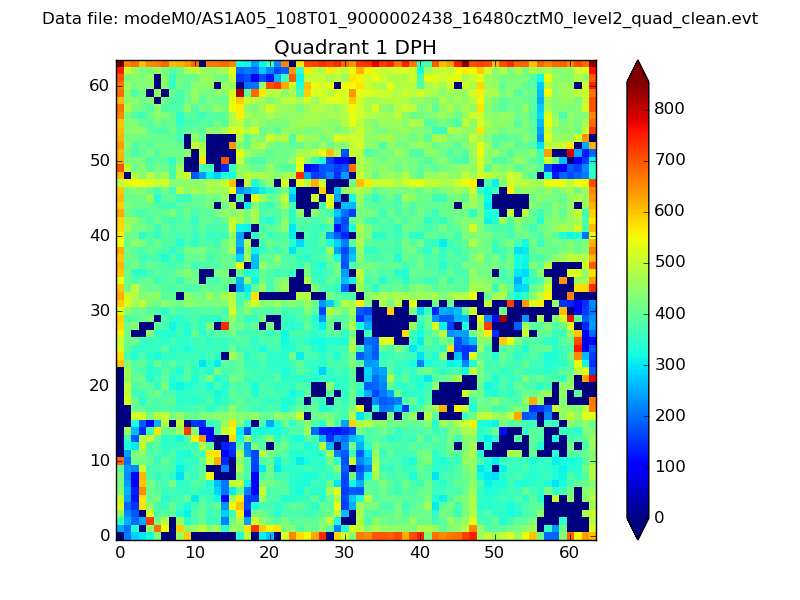 |
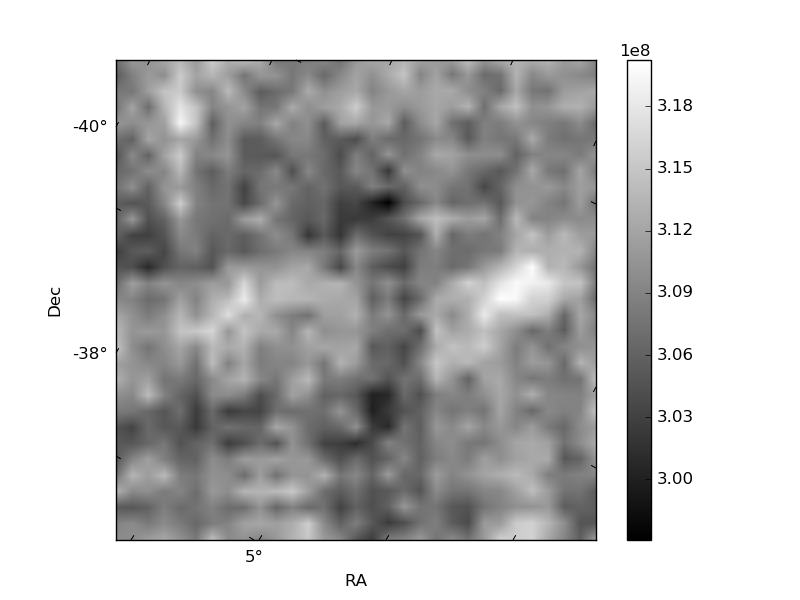
Quadrant B |
|---|---|---|---|
| Quadrant D | 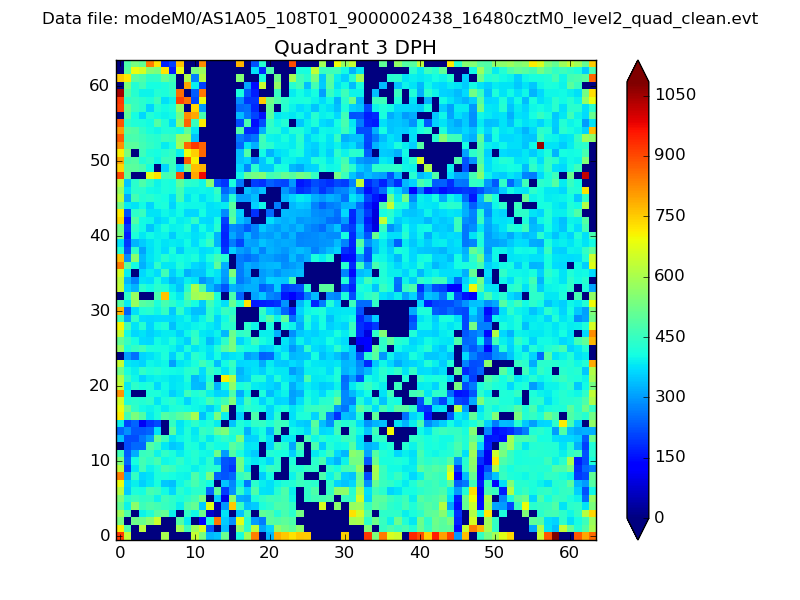 |
 |
Quadrant C |
| Plot type | Count rate plots | Images |
|---|---|---|
| Comparison with Poisson distribution Blue bars denote a histogram of data divided into 1 sec bins. Red curve is a Poisson curve with rate = median count rate of data. |
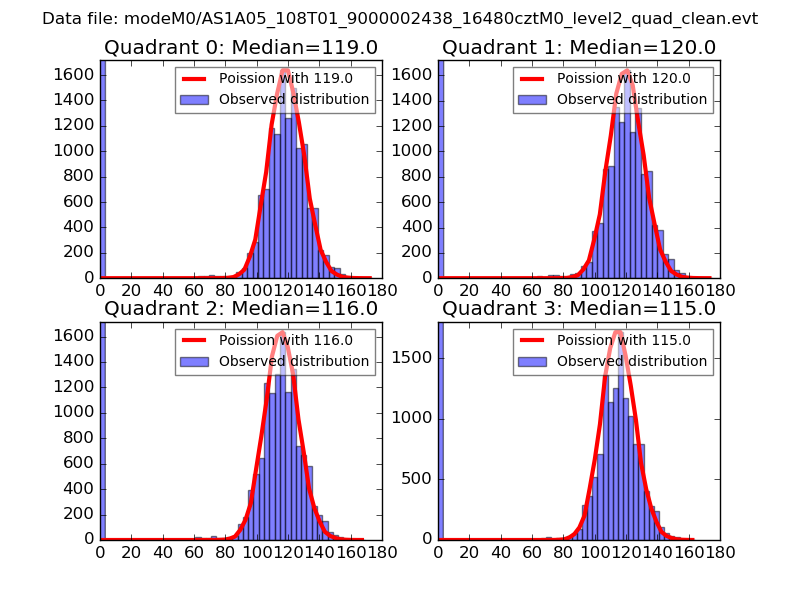 |
 |
| Quadrant-wise count rates Data is divided into 100 sec bins |
 |
|
| Module-wise count rates for Quadrant A Data is divided into 100 sec bins |
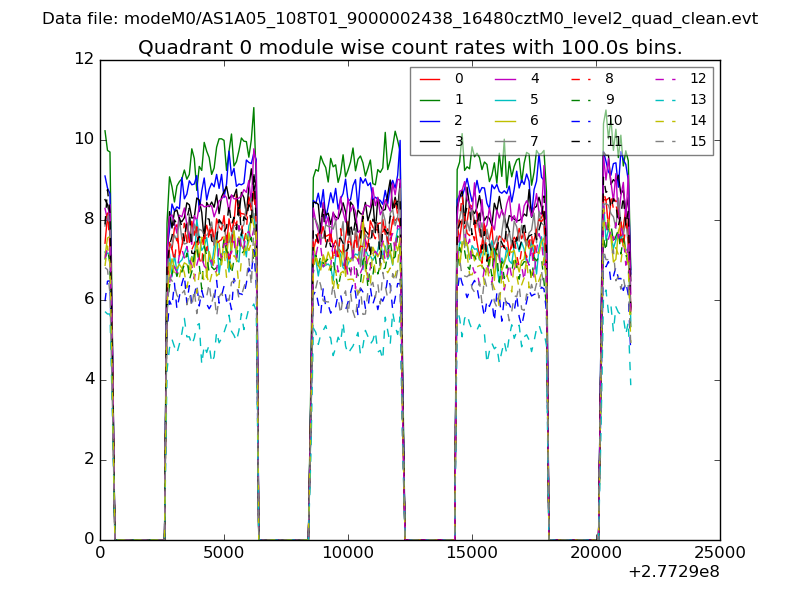 |
 |
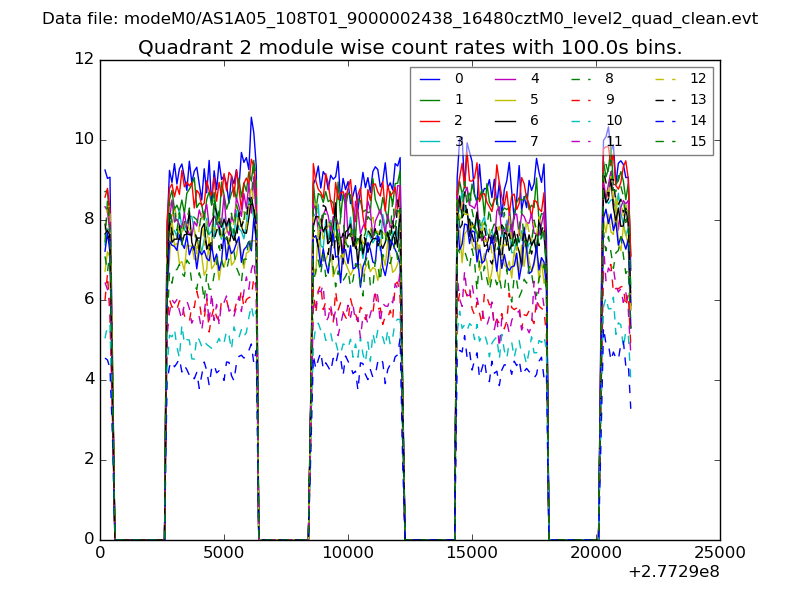
| Module-wise count rates for Quadrant B Data is divided into 100 sec bins |
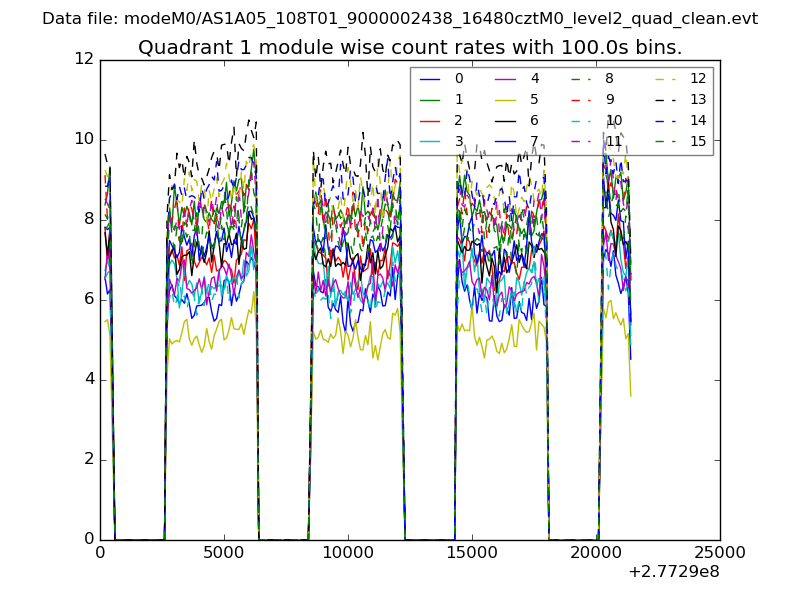 |
 |
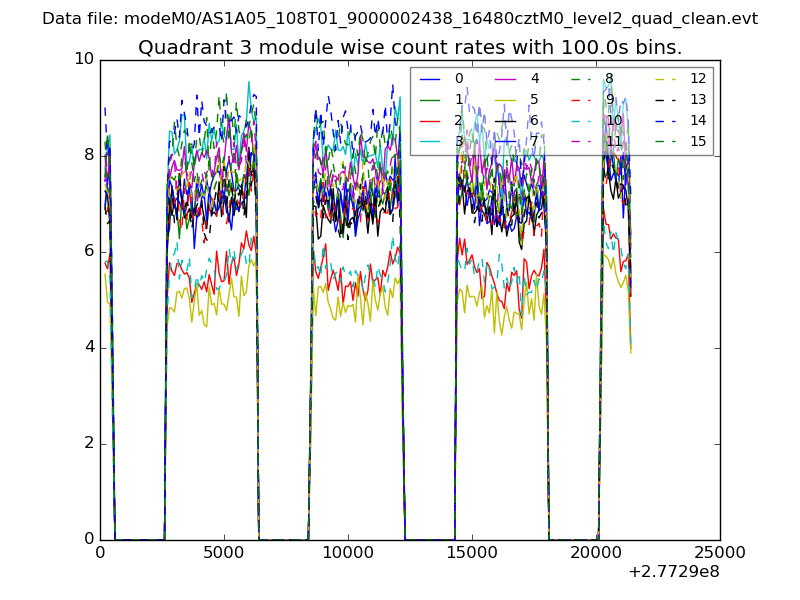
| Module-wise count rates for Quadrant C Data is divided into 100 sec bins |
 |
 |
| Module-wise count rates for Quadrant D Data is divided into 100 sec bins |
 |
 |
| Parameter | Plot |
|---|---|
| CZT HV Monitor | 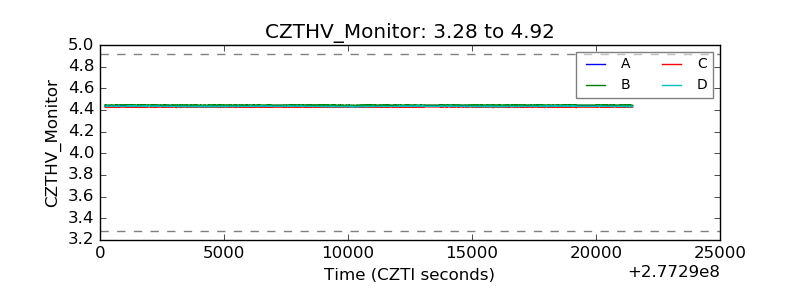 |
| D_VDD | 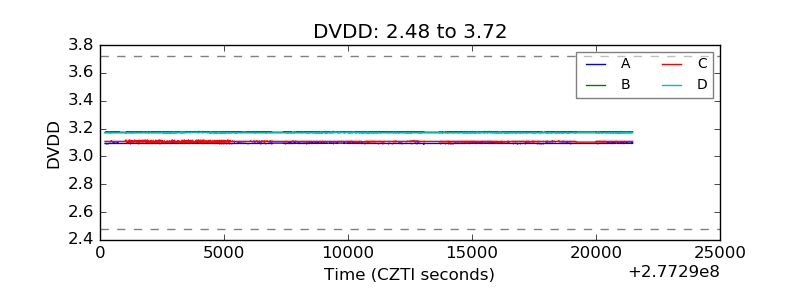 |
| Temperature 1 |  |
| Veto HV Monitor | 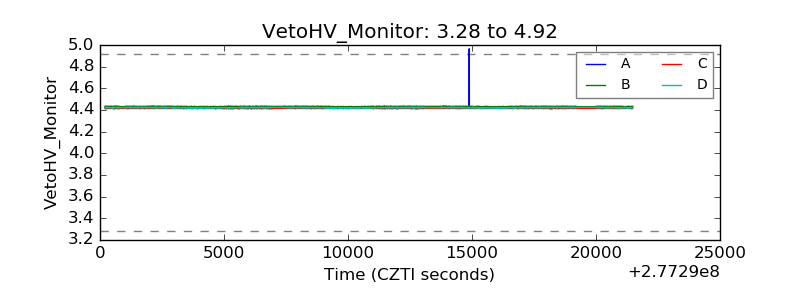 |
| Veto LLD | 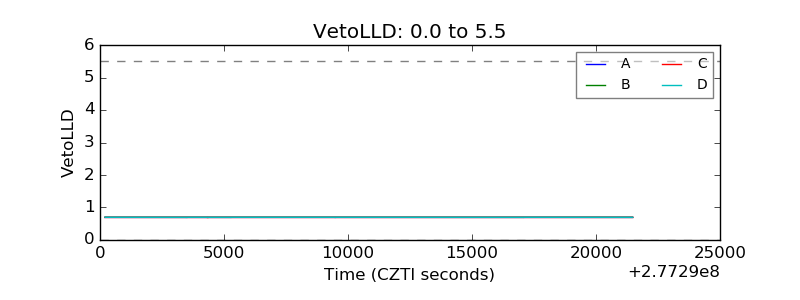 |
| Alpha Counter | 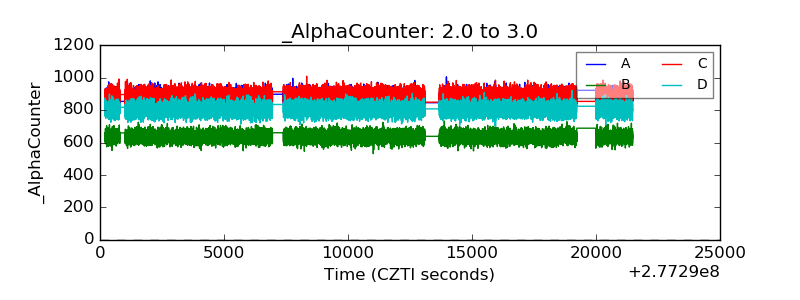 |
| _CPM_Rate | 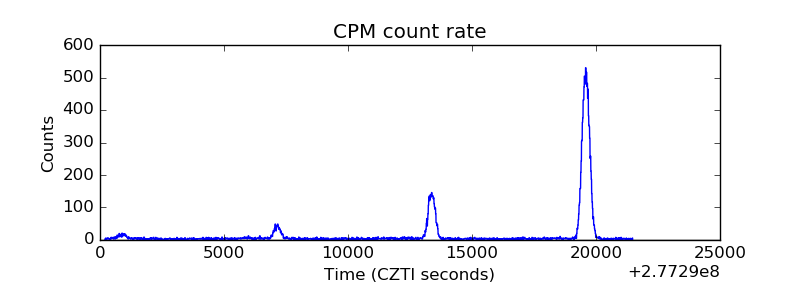 |
| CZT Counter | 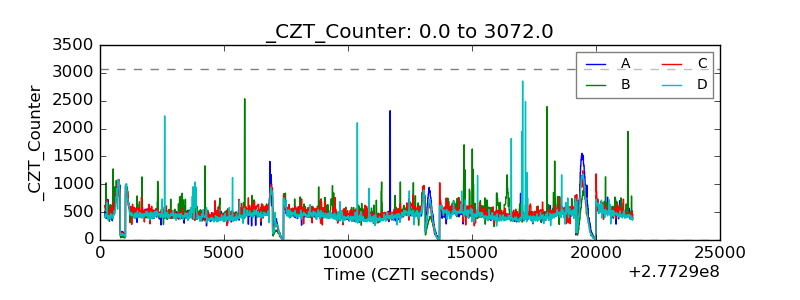 |
| +2.5 Volts monitor |  |
| +5 Volts monitor |  |
| _ROLL_ROT | 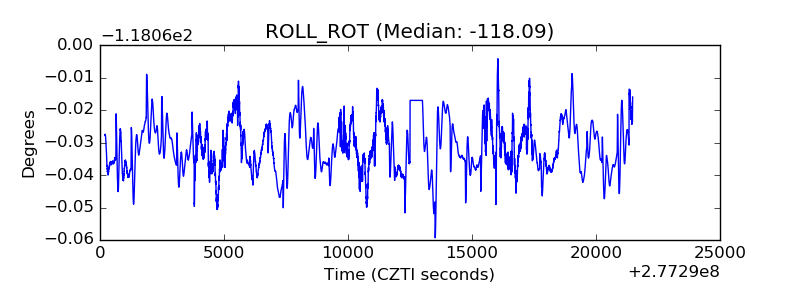 |
| _Roll_DEC | 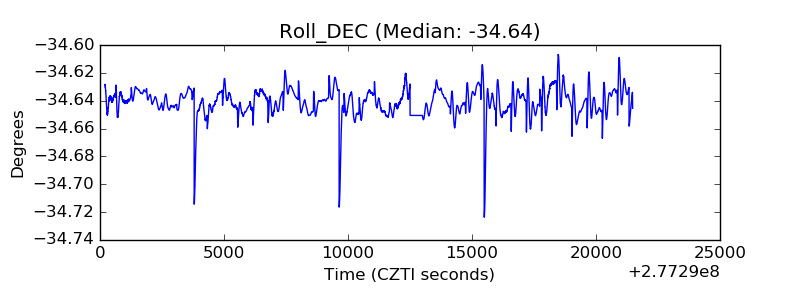 |
| _Roll_RA |  |
| Veto Counter | 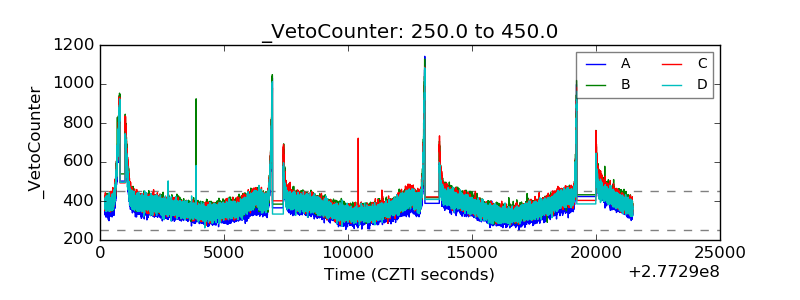 |