| Param | Original file | Final file |
|---|---|---|
| Filename | modeM0/AS1A05_108T01_9000002438_16481cztM0_level2.evt | modeM0/AS1A05_108T01_9000002438_16481cztM0_level2_quad_clean.evt |
| Size (bytes) | 427,541,760 | 94,055,040 |
| Size | 407.7 MB | 89.7 MB |
| Events in quadrant A | 2,974,733 | 611,581 |
| Events in quadrant B | 3,302,714 | 621,662 |
| Events in quadrant C | 3,415,307 | 588,112 |
| Events in quadrant D | 2,824,115 | 584,495 |
| Mode M9 | |||
|---|---|---|---|
| Quadrant | BADHDUFLAG | Total packets | Discarded packets |
| A | 0 | 10 | 0 |
| B | 0 | 10 | 0 |
| C | 0 | 10 | 0 |
| D | 0 | 10 | 0 |
| Mode SS | |||
|---|---|---|---|
| Quadrant | BADHDUFLAG | Total packets | Discarded packets |
| A | 0 | 128 | 0 |
| B | 0 | 128 | 0 |
| C | 0 | 128 | 0 |
| D | 0 | 128 | 0 |
| Mode M0 | |||
|---|---|---|---|
| Quadrant | BADHDUFLAG | Total packets | Discarded packets |
| A | 0 | 13173 | 2 |
| B | 0 | 13940 | 1 |
| C | 0 | 14392 | 1 |
| D | 0 | 13051 | 1 |
| Quadrant | Total seconds | Saturated seconds | Saturation percentage |
|---|---|---|---|
| A | 6344 | 50 | 0.788146% |
| B | 6344 | 68 | 1.071879% |
| C | 6344 | 99 | 1.560530% |
| D | 6344 | 33 | 0.520177% |
Noise dominated data is calculated using 1-second bins in cleaned event files. If a bin has >2000 counts, and if more than 50% of those come from <1% of pixels, then it is considered to be noise-dominated and hence unusable.
| Quadrant | # 1 sec bins | Bins with >0 counts | Bins with >2000 counts | High rate bins dominated by noise | Noise dominated (total time) | Noise dominated (detector-on time) | Marked lightcurve |
|---|---|---|---|---|---|---|---|
| A | 7315 | 6345 | 3 | 3 | 0.04% | 0.05% | 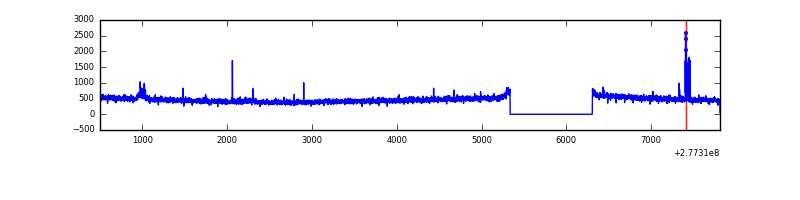 |
| B | 7315 | 6345 | 5 | 5 | 0.07% | 0.08% | 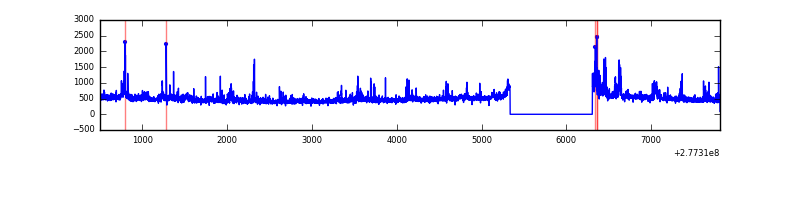 |
| C | 7315 | 6345 | 4 | 4 | 0.05% | 0.06% | 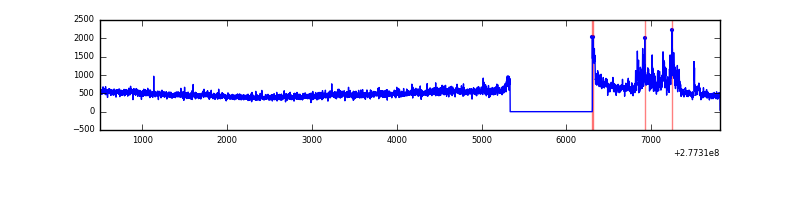 |
| D | 7315 | 6345 | 7 | 7 | 0.10% | 0.11% | 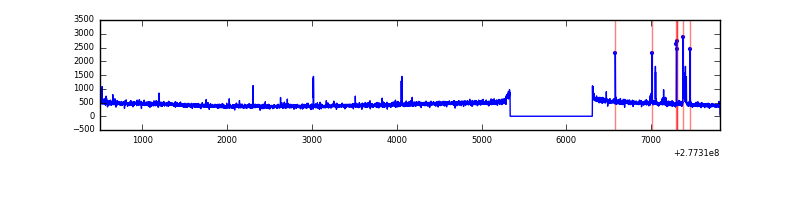 |
Top three noisy pixels from each quadrant. If the there are fewer than three noisy pixels in the level2.evt file, extra rows are filled as -1
| Pixel properties | Quadrant properties | ||||||
|---|---|---|---|---|---|---|---|
| Quadrant | DetID | PixID | Counts | Sigma | Mean | Median | Sigma |
| A | 15 | 174 | 77762 | 502.82 | 754 | 737 | 153.2 |
| A | 0 | 226 | 6633 | 38.49 | 754 | 737 | 153.2 |
| A | 3 | 137 | 5633 | 31.96 | 754 | 737 | 153.2 |
| B | 4 | 48 | 131646 | 903.95 | 752 | 734 | 144.8 |
| B | 15 | 35 | 76650 | 524.2 | 752 | 734 | 144.8 |
| B | 3 | 209 | 50298 | 342.24 | 752 | 734 | 144.8 |
| C | 3 | 233 | 418146 | 2483.68 | 711 | 714 | 168.1 |
| C | 7 | 247 | 116515 | 689.01 | 711 | 714 | 168.1 |
| C | 14 | 238 | 109378 | 646.54 | 711 | 714 | 168.1 |
| D | 2 | 33 | 45093 | 248.85 | 724 | 699 | 178.4 |
| D | 2 | 234 | 28488 | 155.77 | 724 | 699 | 178.4 |
| D | 1 | 52 | 10918 | 57.28 | 724 | 699 | 178.4 |
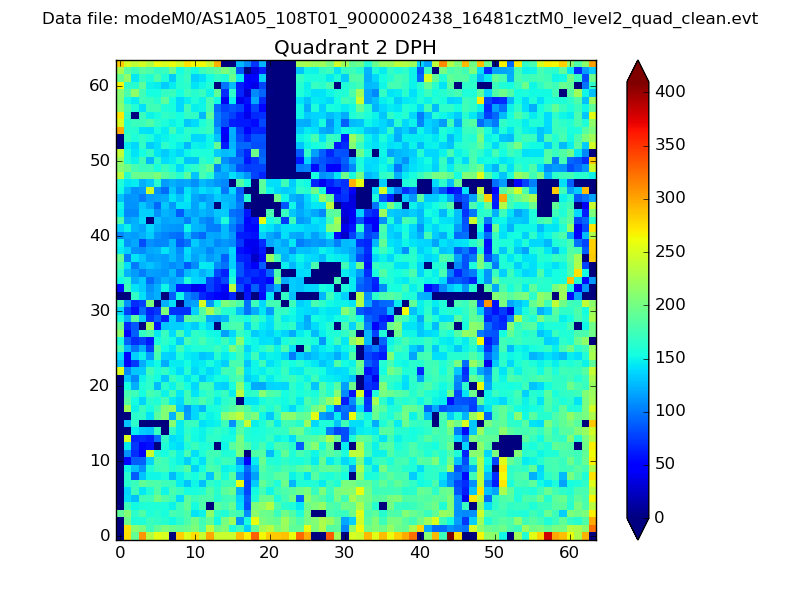
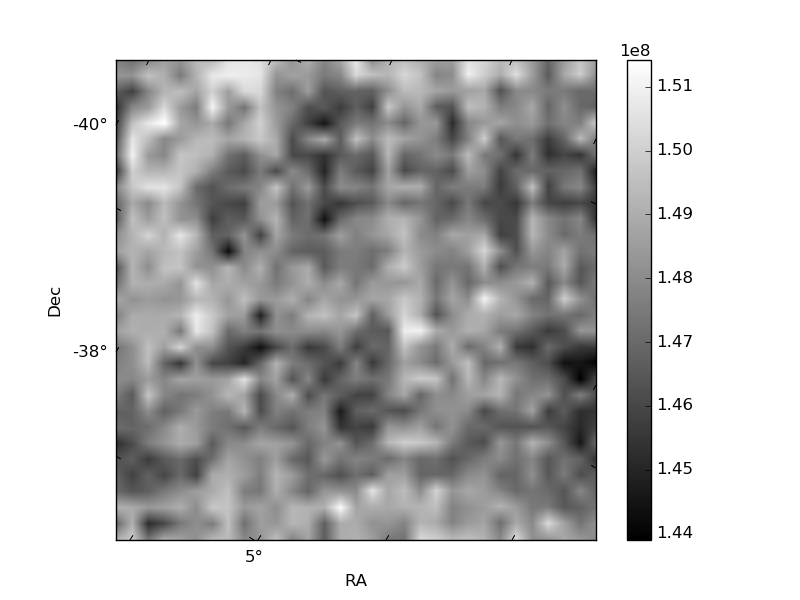
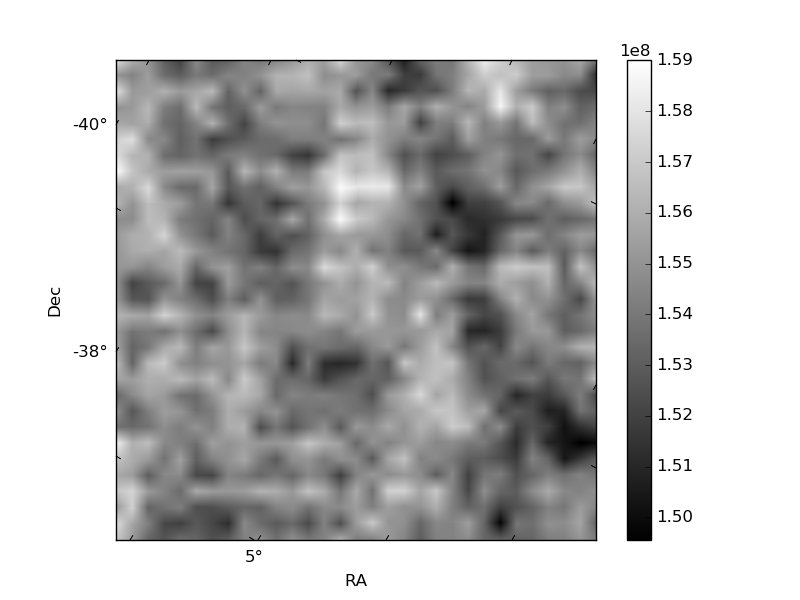
Histogram calculated using DETX and DETY for each event in the final _common_clean file
| Quadrant A | 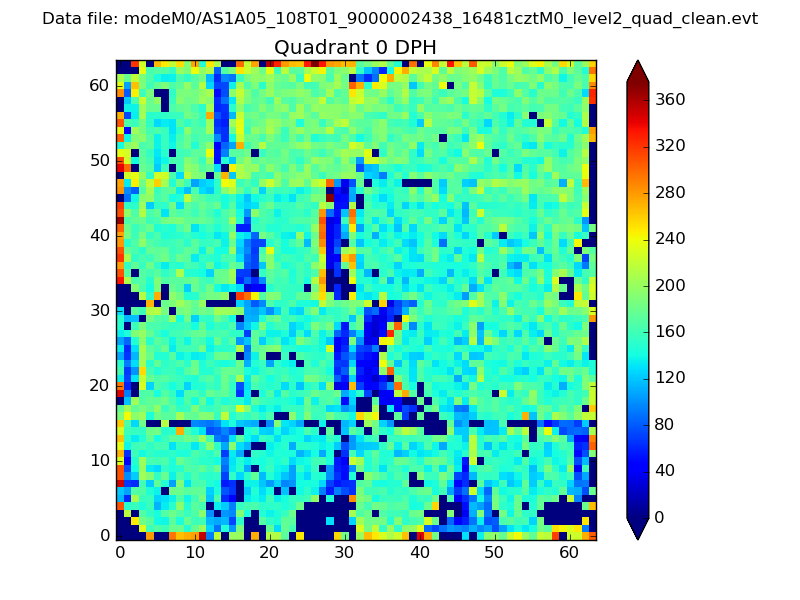 |
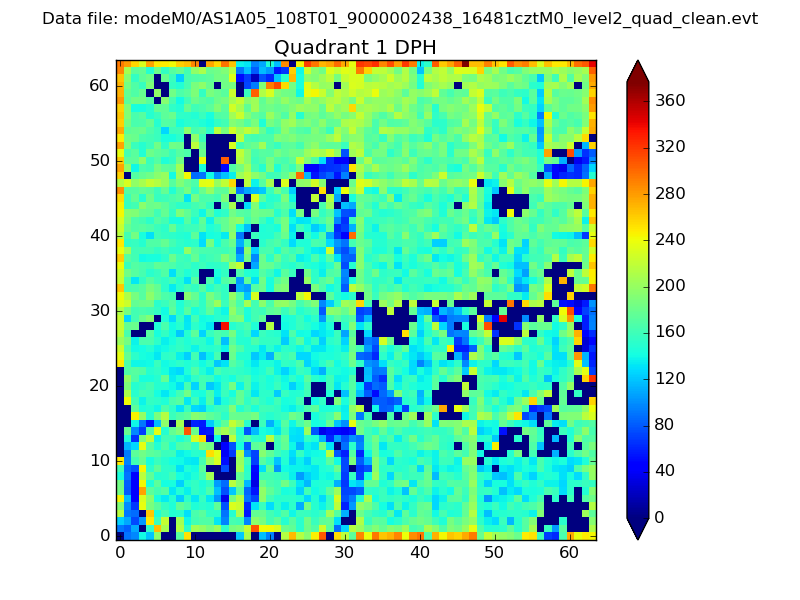 |
Quadrant B |
|---|---|---|---|
| Quadrant D | 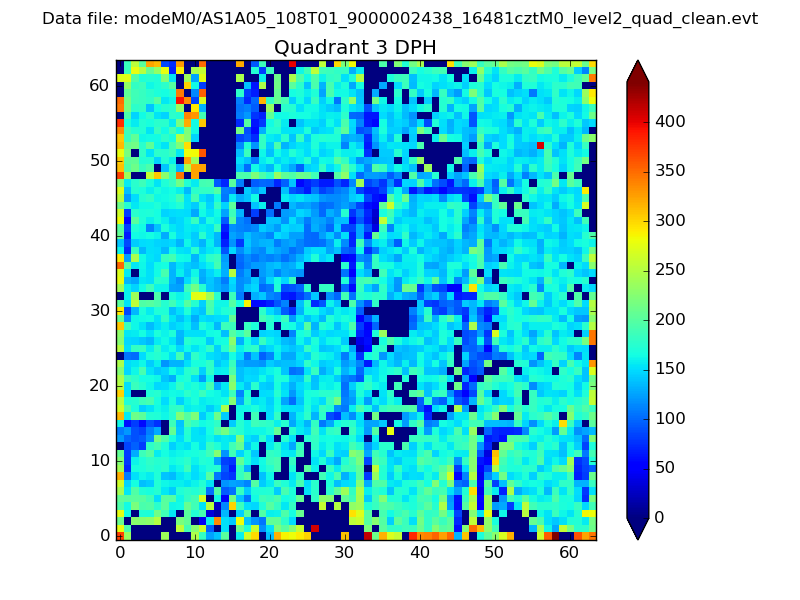 |
 |
Quadrant C |
| Plot type | Count rate plots | Images |
|---|---|---|
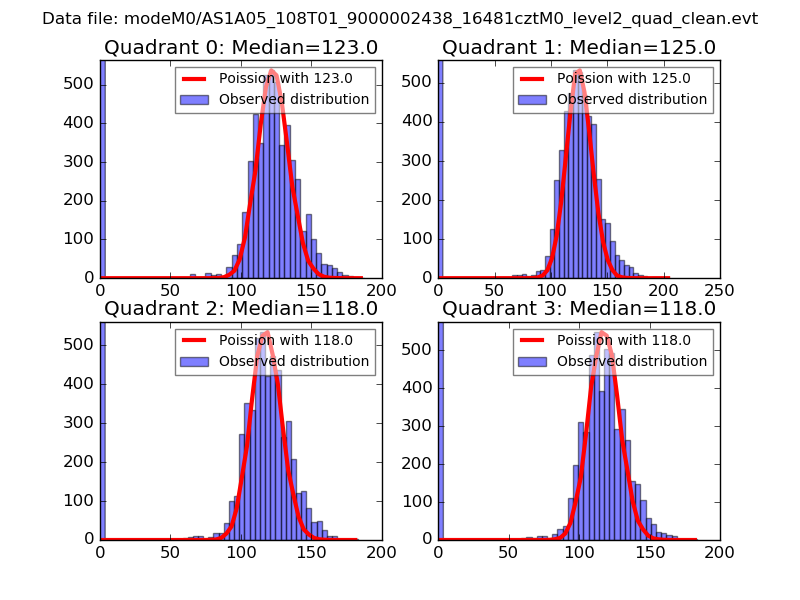
| Comparison with Poisson distribution Blue bars denote a histogram of data divided into 1 sec bins. Red curve is a Poisson curve with rate = median count rate of data. |
 |
 |
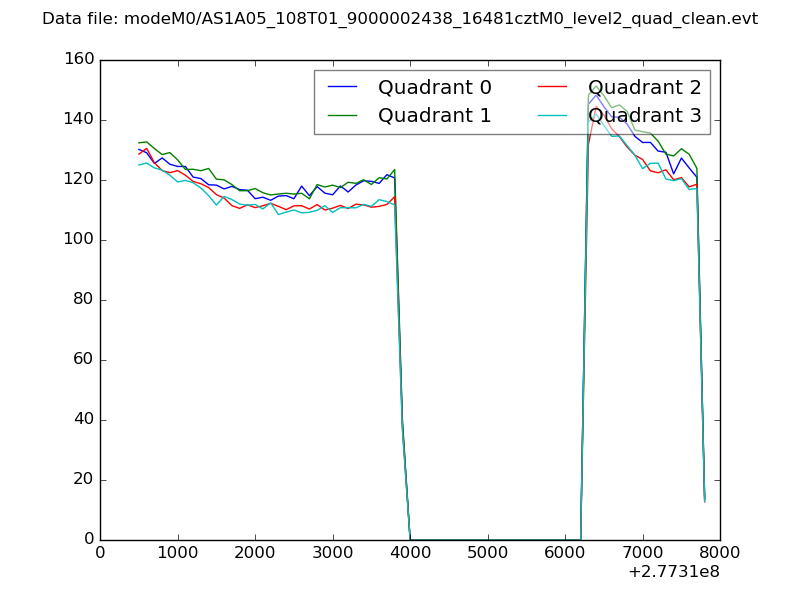
| Quadrant-wise count rates Data is divided into 100 sec bins |
 |
|
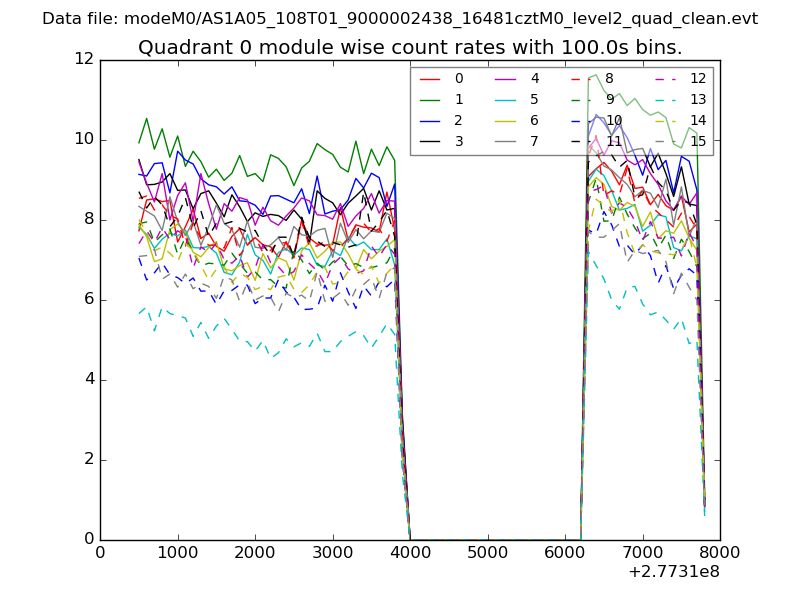
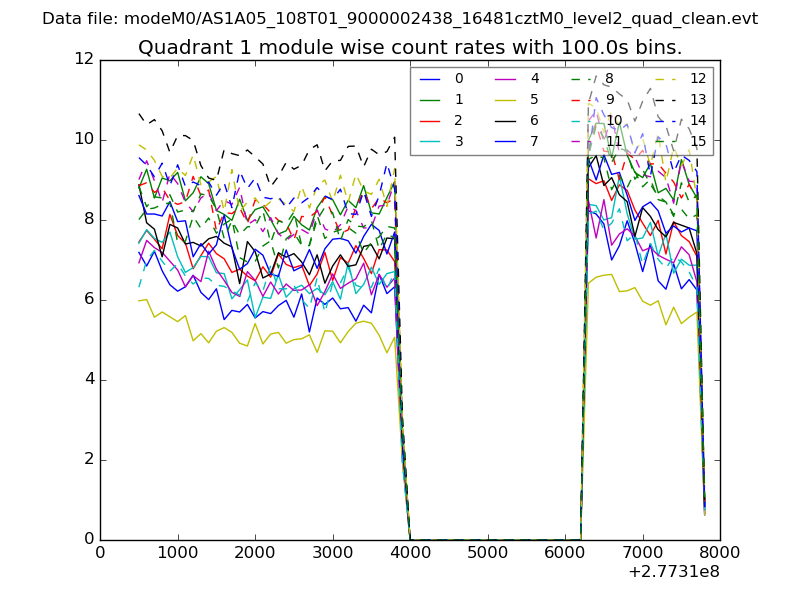
| Module-wise count rates for Quadrant A Data is divided into 100 sec bins |
 |
 |
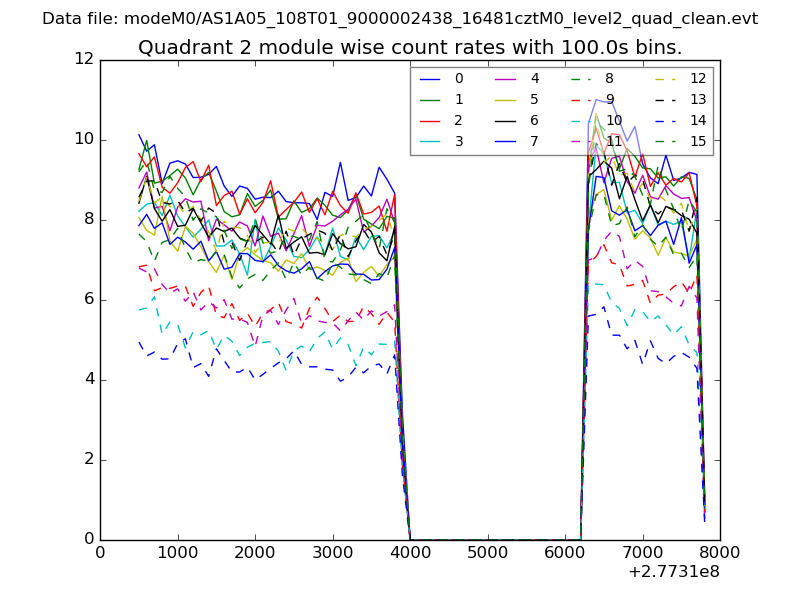
| Module-wise count rates for Quadrant B Data is divided into 100 sec bins |
 |
 |
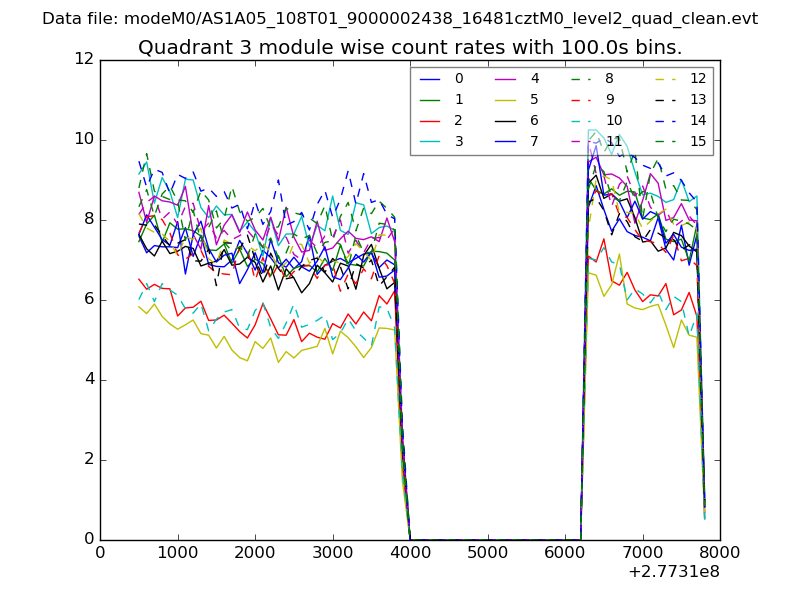
| Module-wise count rates for Quadrant C Data is divided into 100 sec bins |
 |
 |
| Module-wise count rates for Quadrant D Data is divided into 100 sec bins |
 |
 |
| Parameter | Plot |
|---|---|
| CZT HV Monitor | 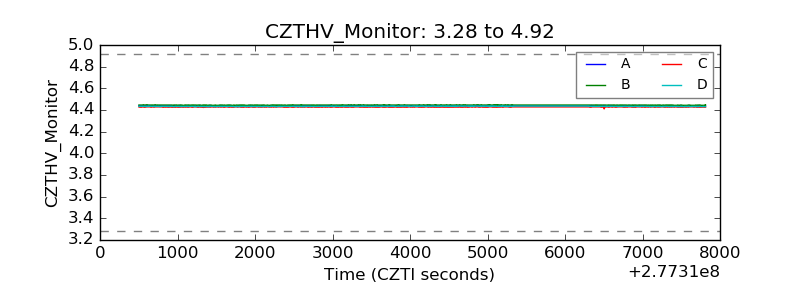 |
| D_VDD |  |
| Temperature 1 | 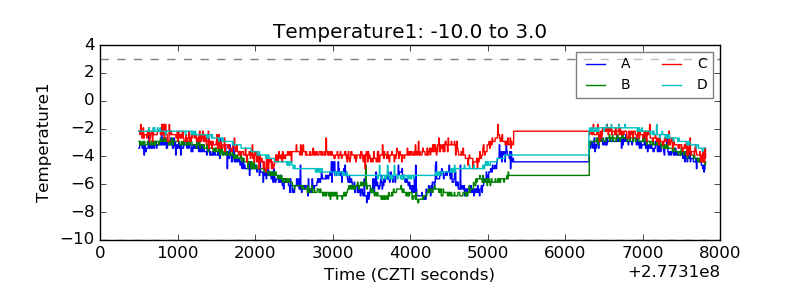 |
| Veto HV Monitor | 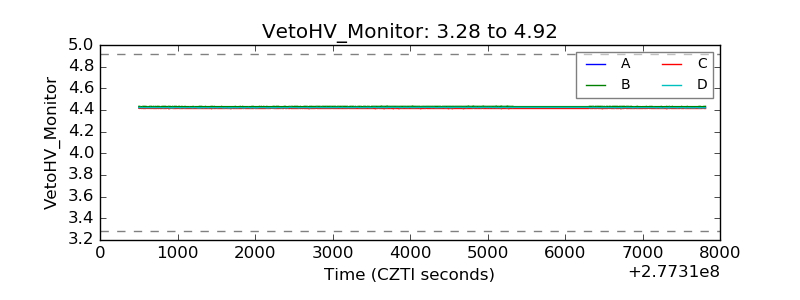 |
| Veto LLD | 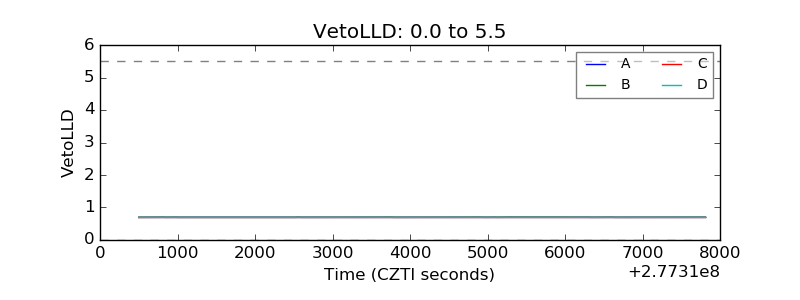 |
| Alpha Counter | 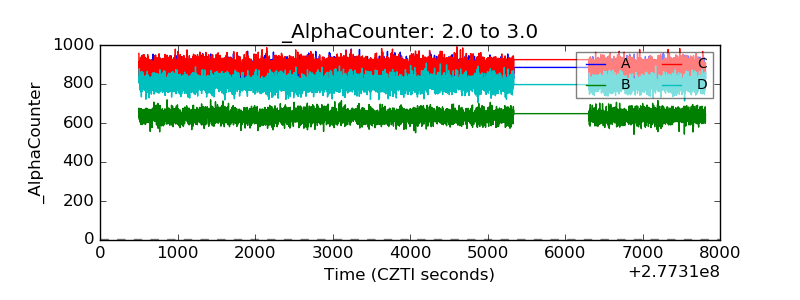 |
| _CPM_Rate | 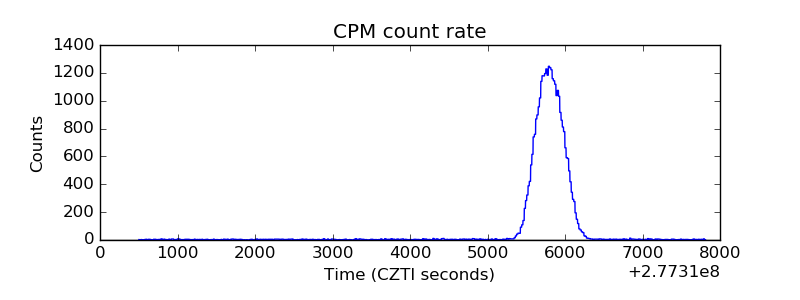 |
| CZT Counter | 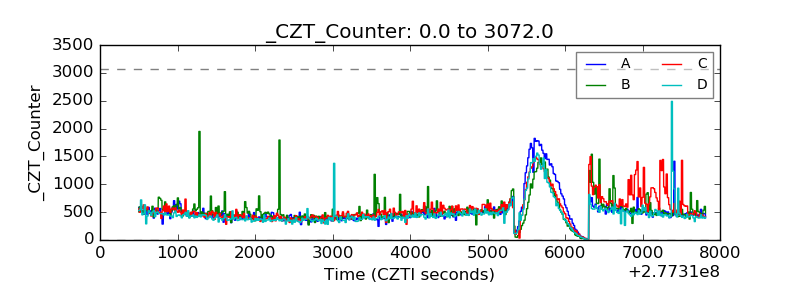 |
| +2.5 Volts monitor |  |
| +5 Volts monitor |  |
| _ROLL_ROT | 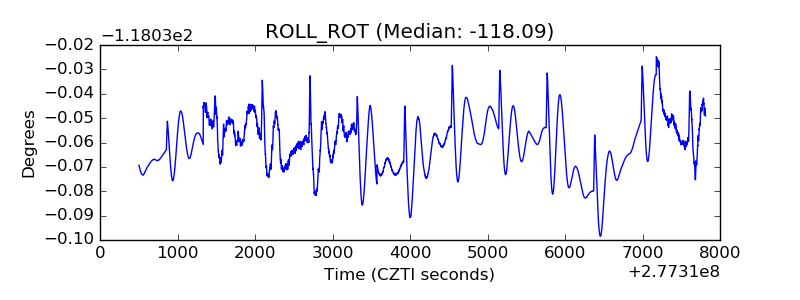 |
| _Roll_DEC | 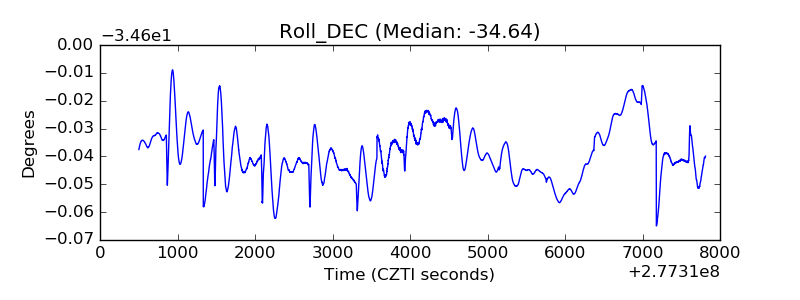 |
| _Roll_RA | 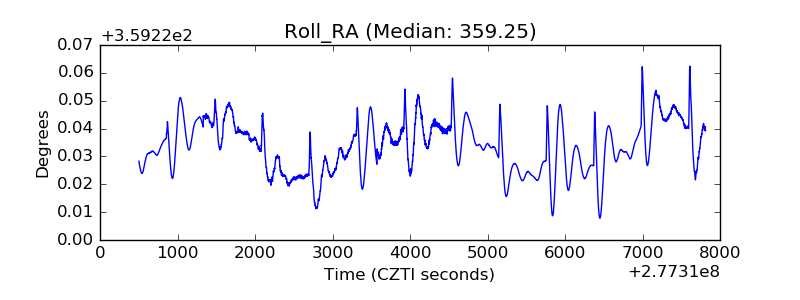 |
| Veto Counter | 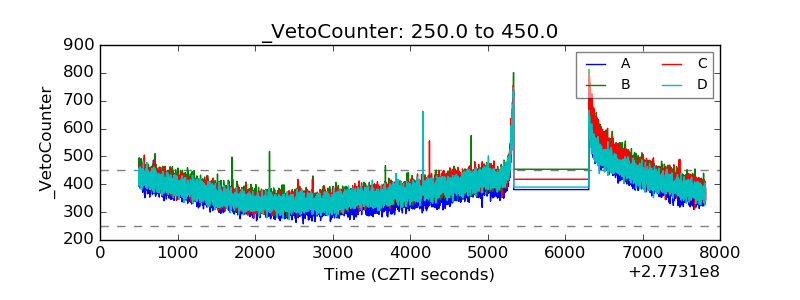 |