| Param | Original file | Final file |
|---|---|---|
| Filename | modeM0/AS1A05_108T01_9000002438_16483cztM0_level2.evt | modeM0/AS1A05_108T01_9000002438_16483cztM0_level2_quad_clean.evt |
| Size (bytes) | 497,977,920 | 94,167,360 |
| Size | 474.9 MB | 89.8 MB |
| Events in quadrant A | 3,165,972 | 614,868 |
| Events in quadrant B | 3,639,324 | 624,158 |
| Events in quadrant C | 4,877,193 | 580,416 |
| Events in quadrant D | 2,962,632 | 583,803 |
| Mode M9 | |||
|---|---|---|---|
| Quadrant | BADHDUFLAG | Total packets | Discarded packets |
| A | 0 | 11 | 0 |
| B | 0 | 11 | 0 |
| C | 0 | 11 | 0 |
| D | 0 | 11 | 0 |
| Mode SS | |||
|---|---|---|---|
| Quadrant | BADHDUFLAG | Total packets | Discarded packets |
| A | 0 | 130 | 0 |
| B | 0 | 130 | 0 |
| C | 0 | 130 | 0 |
| D | 0 | 130 | 0 |
| Mode M0 | |||
|---|---|---|---|
| Quadrant | BADHDUFLAG | Total packets | Discarded packets |
| A | 0 | 13680 | 2 |
| B | 0 | 15068 | 1 |
| C | 0 | 19282 | 1 |
| D | 0 | 13417 | 1 |
| Quadrant | Total seconds | Saturated seconds | Saturation percentage |
|---|---|---|---|
| A | 6431 | 53 | 0.824133% |
| B | 6431 | 83 | 1.290624% |
| C | 6431 | 350 | 5.442388% |
| D | 6431 | 33 | 0.513139% |
Noise dominated data is calculated using 1-second bins in cleaned event files. If a bin has >2000 counts, and if more than 50% of those come from <1% of pixels, then it is considered to be noise-dominated and hence unusable.
| Quadrant | # 1 sec bins | Bins with >0 counts | Bins with >2000 counts | High rate bins dominated by noise | Noise dominated (total time) | Noise dominated (detector-on time) | Marked lightcurve |
|---|---|---|---|---|---|---|---|
| A | 7532 | 6432 | 10 | 10 | 0.13% | 0.16% | 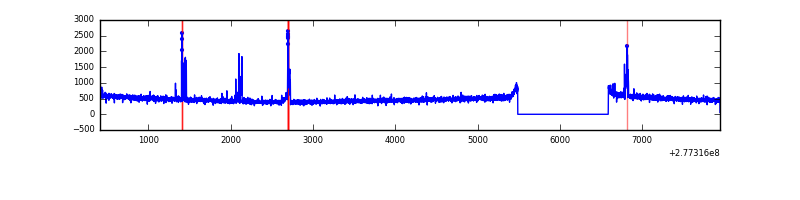 |
| B | 7532 | 6432 | 28 | 28 | 0.37% | 0.44% | 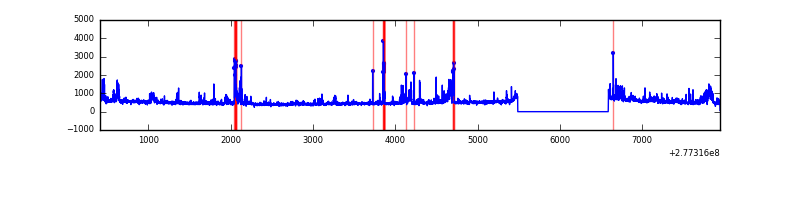 |
| C | 7532 | 6432 | 33 | 33 | 0.44% | 0.51% | 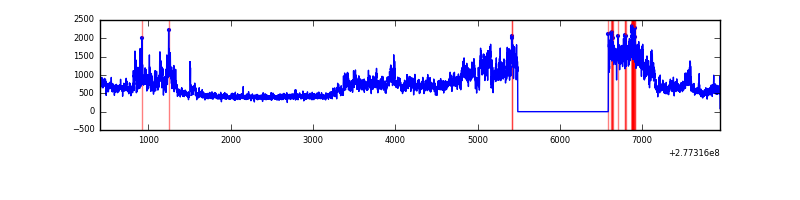 |
| D | 7532 | 6433 | 16 | 16 | 0.21% | 0.25% | 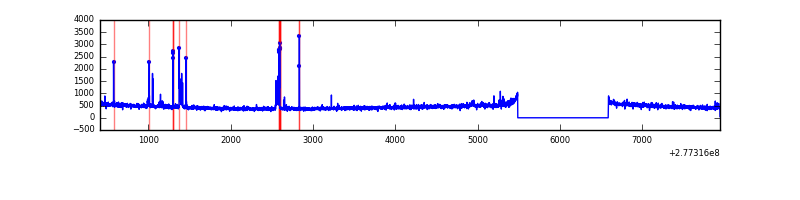 |
Top three noisy pixels from each quadrant. If the there are fewer than three noisy pixels in the level2.evt file, extra rows are filled as -1
| Pixel properties | Quadrant properties | ||||||
|---|---|---|---|---|---|---|---|
| Quadrant | DetID | PixID | Counts | Sigma | Mean | Median | Sigma |
| A | 15 | 174 | 164239 | 1042.88 | 780 | 765 | 156.8 |
| A | 0 | 226 | 6991 | 39.72 | 780 | 765 | 156.8 |
| A | 15 | 223 | 6809 | 38.56 | 780 | 765 | 156.8 |
| B | 10 | 16 | 129687 | 862.36 | 780 | 762 | 149.5 |
| B | 4 | 48 | 113490 | 754.02 | 780 | 762 | 149.5 |
| B | 15 | 35 | 105667 | 701.69 | 780 | 762 | 149.5 |
| C | 3 | 233 | 1827615 | 10775.94 | 728 | 734 | 169.5 |
| C | 14 | 238 | 111554 | 653.68 | 728 | 734 | 169.5 |
| C | 7 | 247 | 99447 | 582.26 | 728 | 734 | 169.5 |
| D | 2 | 33 | 67806 | 365.47 | 747 | 724 | 183.5 |
| D | 2 | 234 | 34008 | 181.33 | 747 | 724 | 183.5 |
| D | 7 | 223 | 23583 | 124.54 | 747 | 724 | 183.5 |
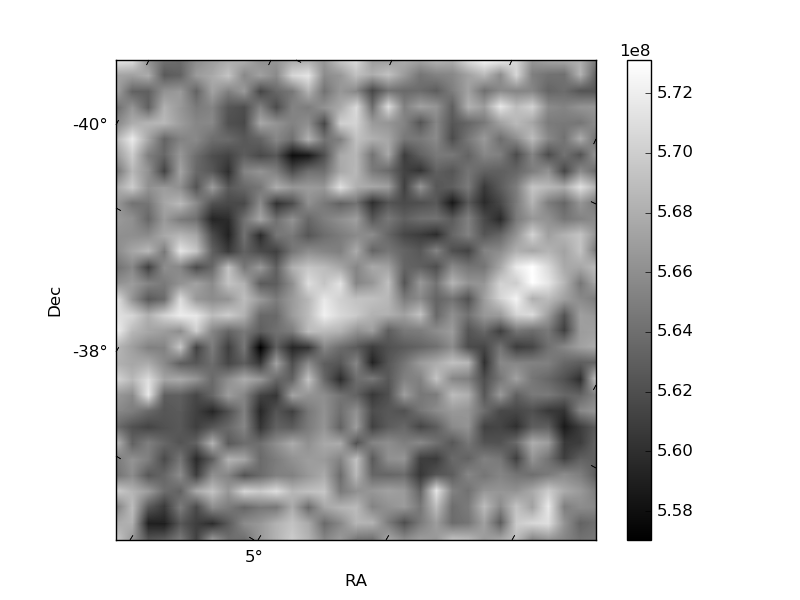
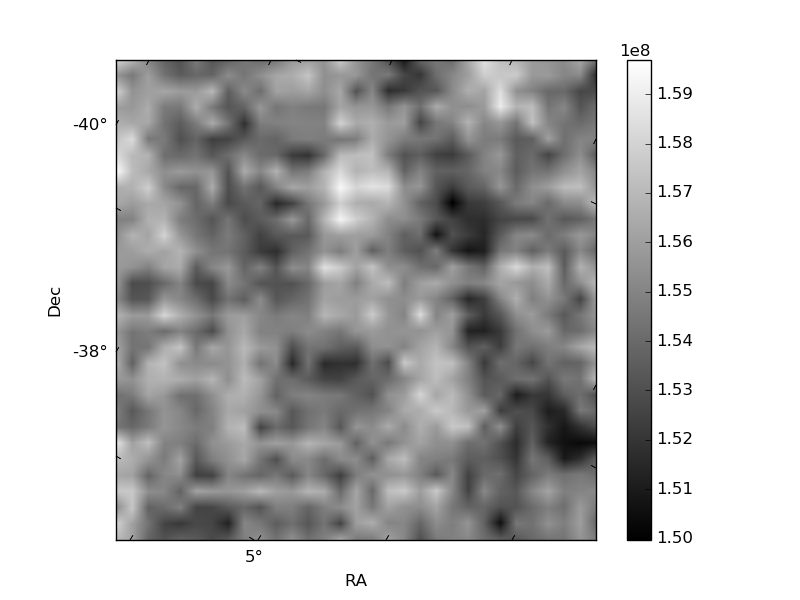
Histogram calculated using DETX and DETY for each event in the final _common_clean file
| Quadrant A | 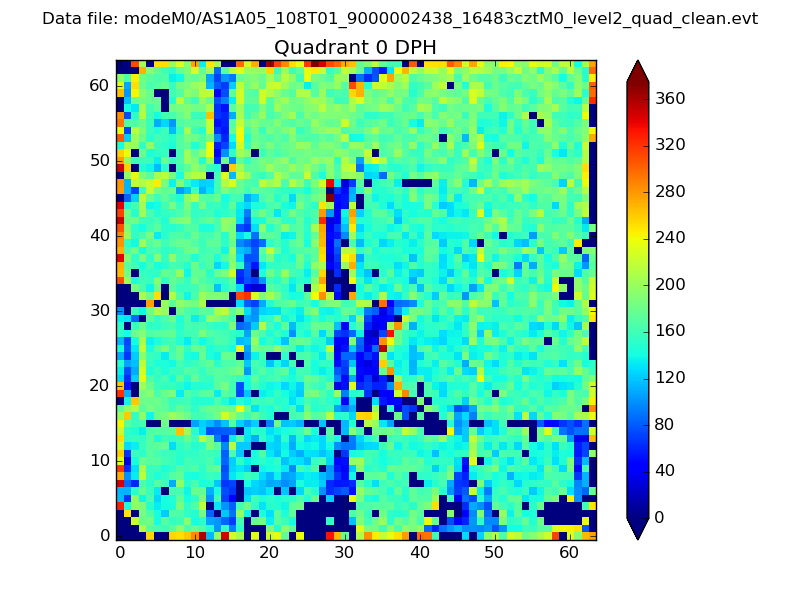 |
 |
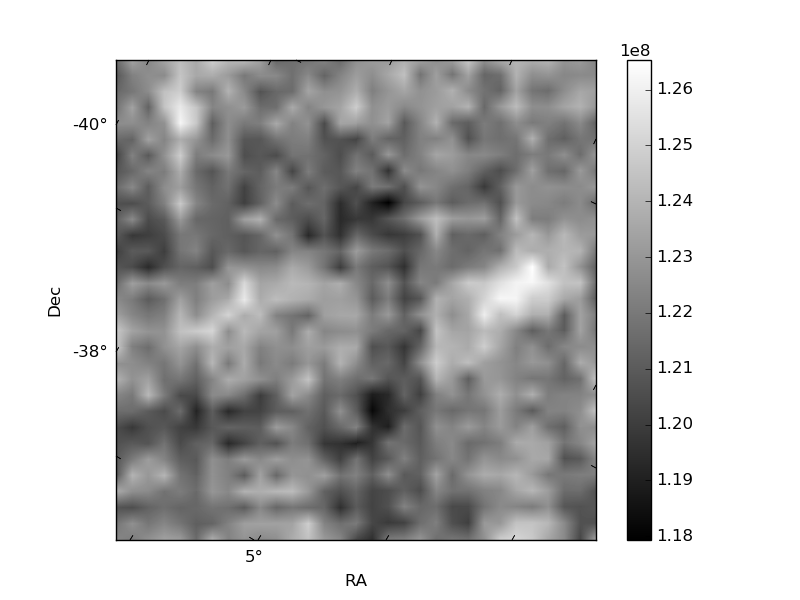
Quadrant B |
|---|---|---|---|
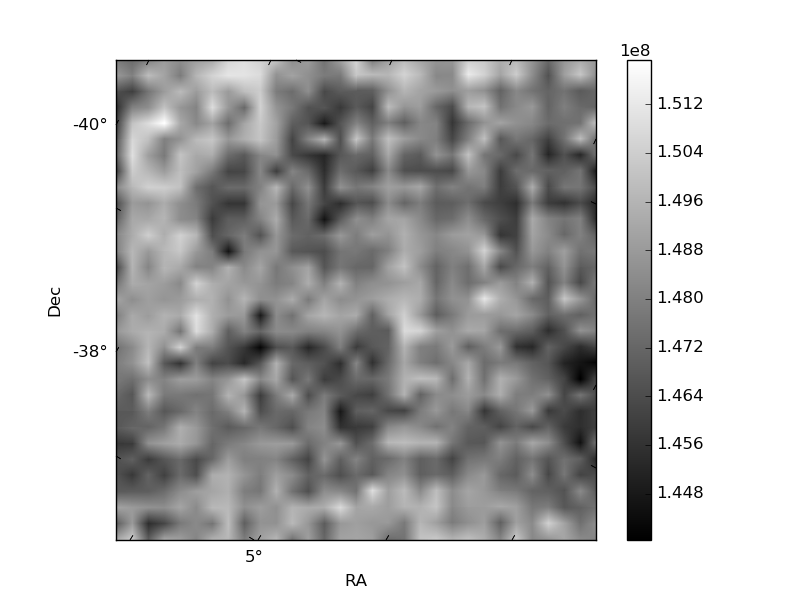
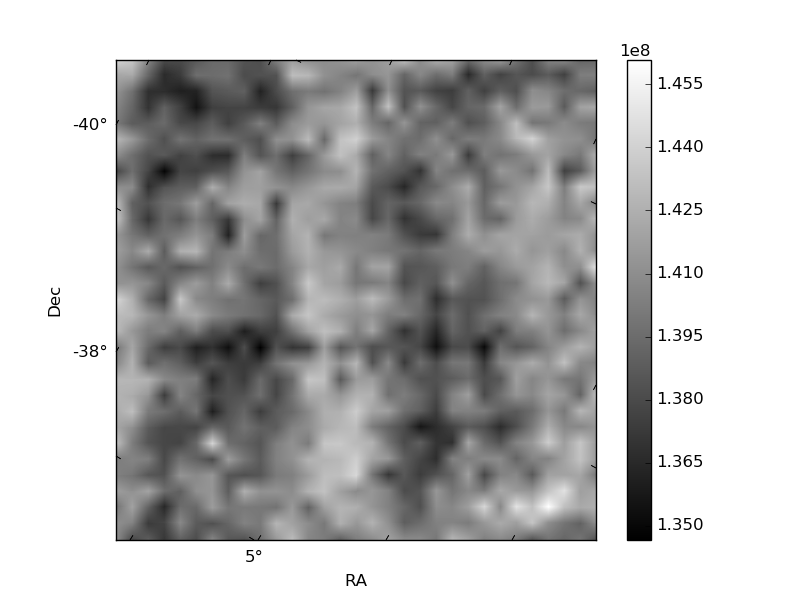
| Quadrant D | 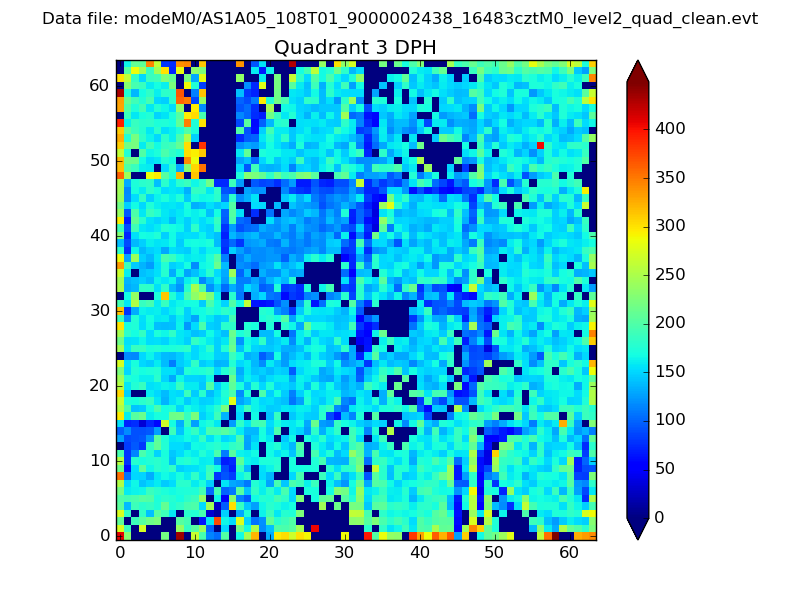 |
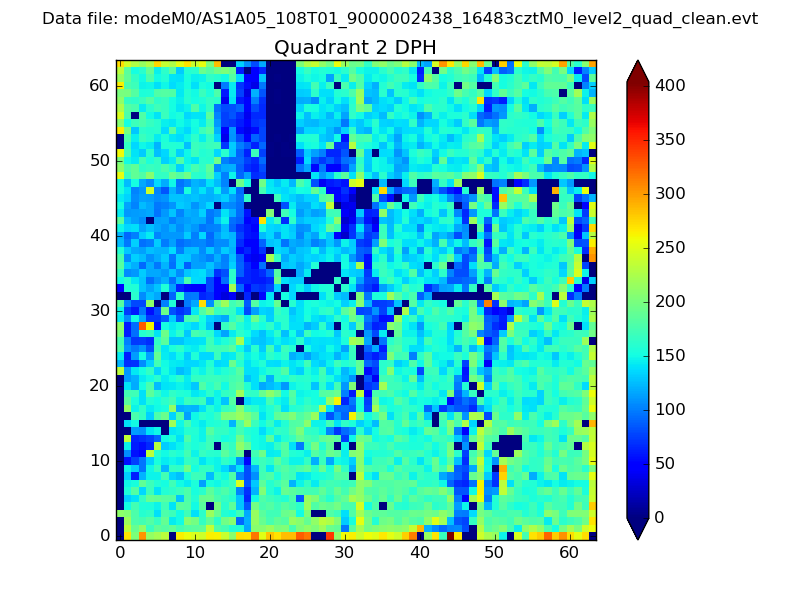 |
Quadrant C |
| Plot type | Count rate plots | Images |
|---|---|---|
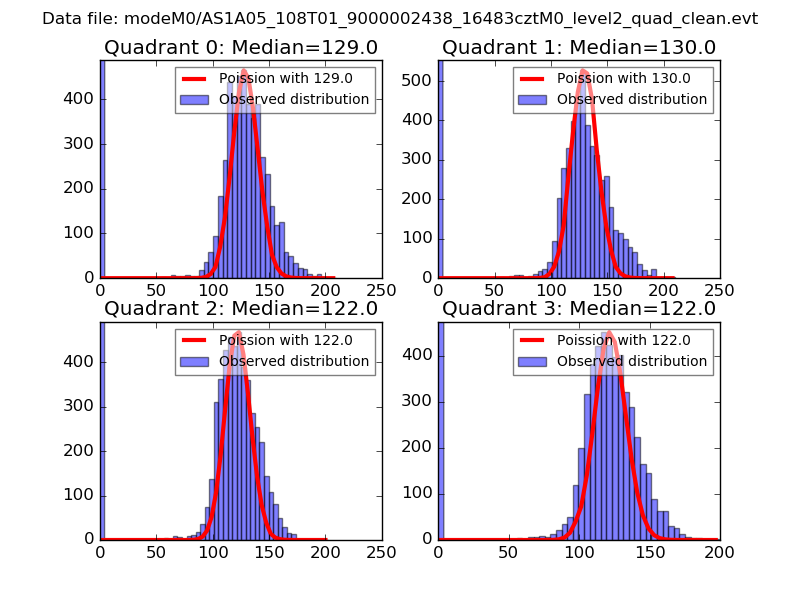
| Comparison with Poisson distribution Blue bars denote a histogram of data divided into 1 sec bins. Red curve is a Poisson curve with rate = median count rate of data. |
 |
 |
| Quadrant-wise count rates Data is divided into 100 sec bins |
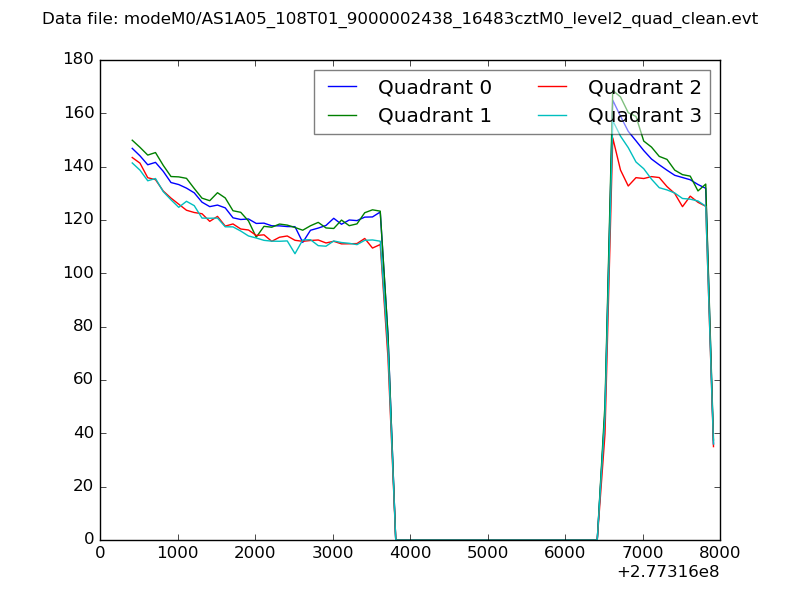 |
|
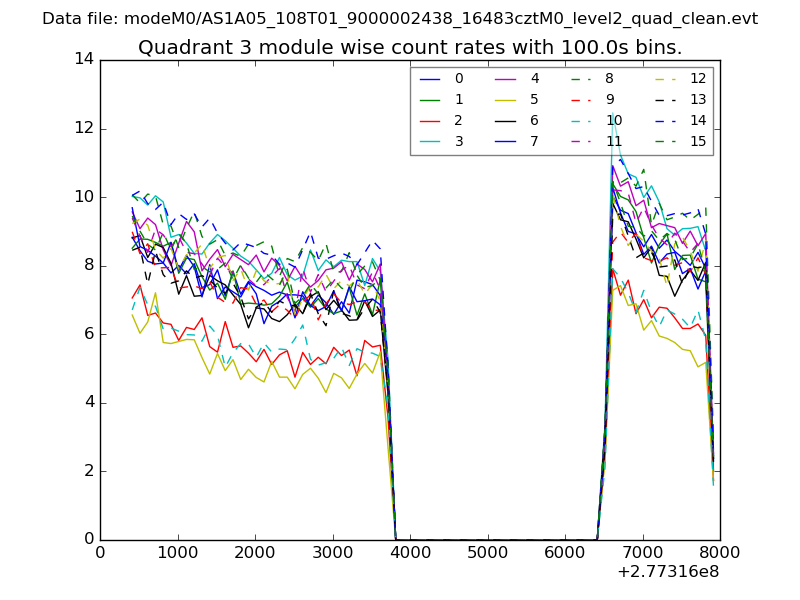
| Module-wise count rates for Quadrant A Data is divided into 100 sec bins |
 |
 |
| Module-wise count rates for Quadrant B Data is divided into 100 sec bins |
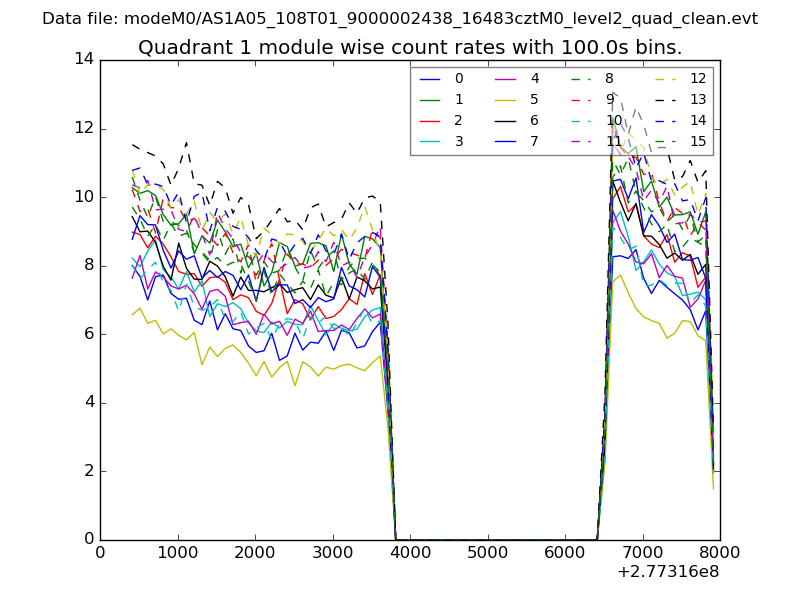 |
 |
| Module-wise count rates for Quadrant C Data is divided into 100 sec bins |
 |
 |
| Module-wise count rates for Quadrant D Data is divided into 100 sec bins |
 |
 |
| Parameter | Plot |
|---|---|
| CZT HV Monitor |  |
| D_VDD | 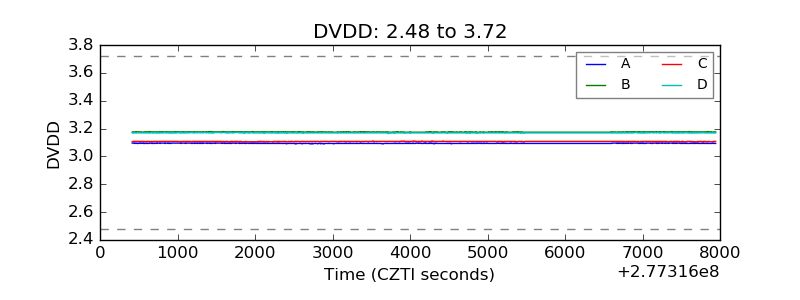 |
| Temperature 1 | 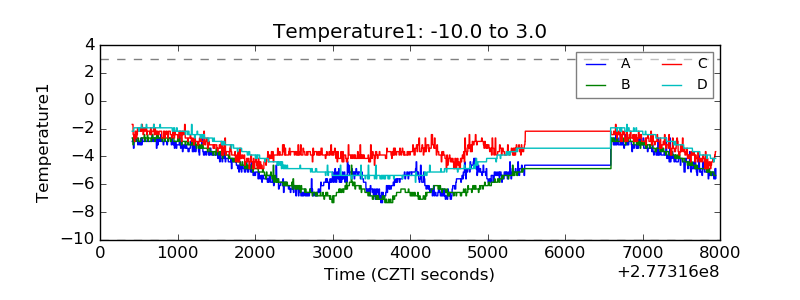 |
| Veto HV Monitor |  |
| Veto LLD | 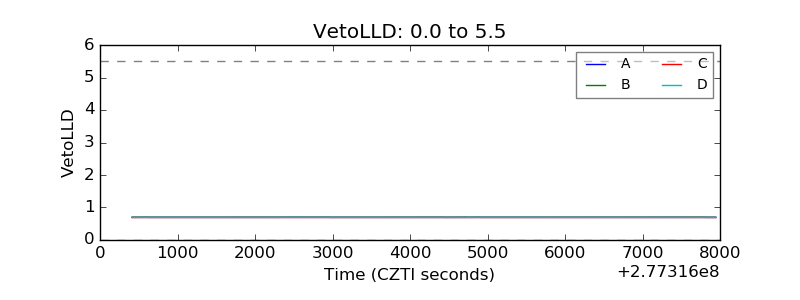 |
| Alpha Counter | 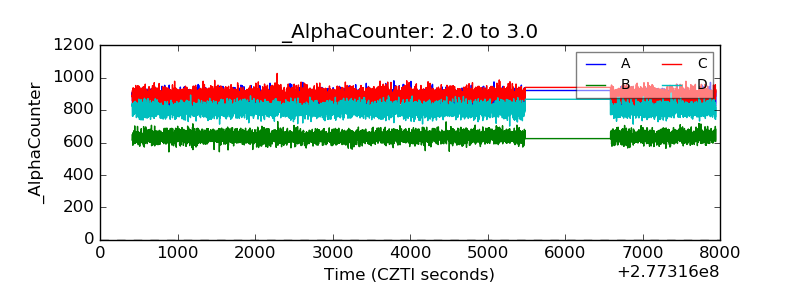 |
| _CPM_Rate | 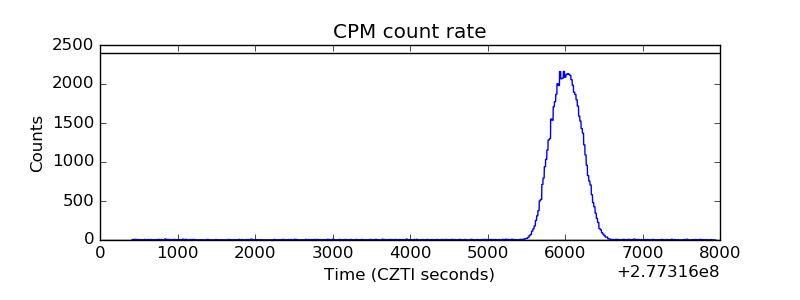 |
| CZT Counter | 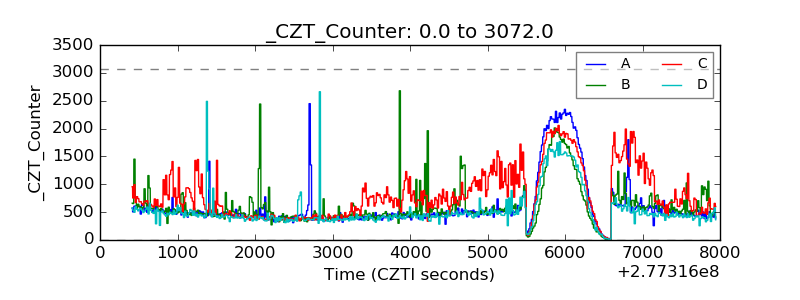 |
| +2.5 Volts monitor |  |
| +5 Volts monitor |  |
| _ROLL_ROT | 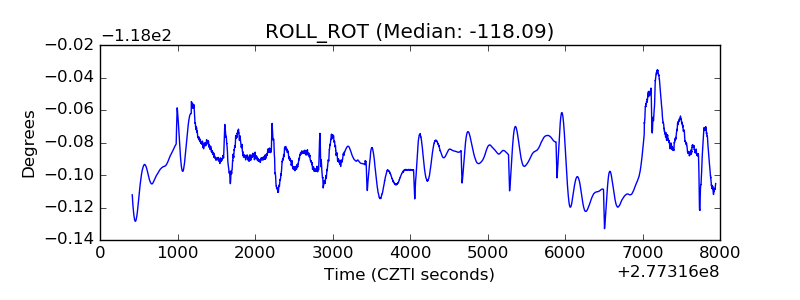 |
| _Roll_DEC | 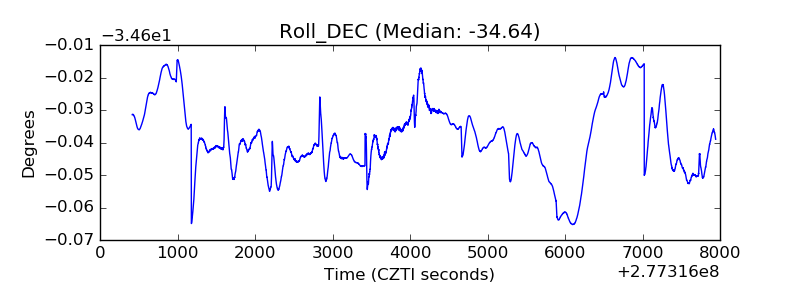 |
| _Roll_RA | 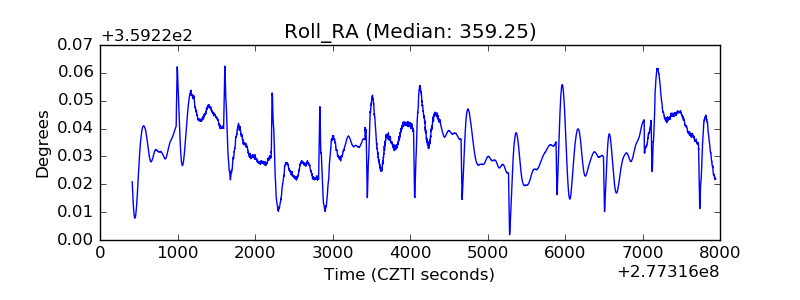 |
| Veto Counter | 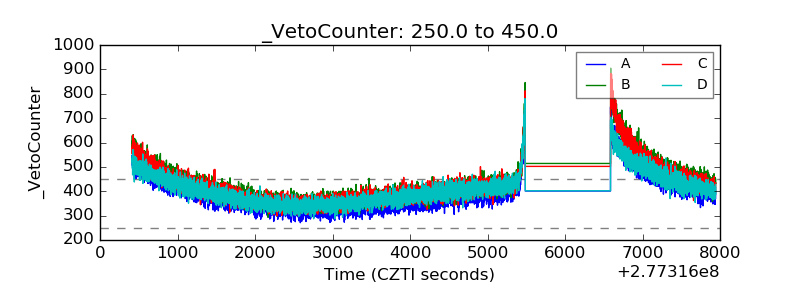 |