| Param | Original file | Final file |
|---|---|---|
| Filename | modeM0/AS1A05_108T01_9000002438_16484cztM0_level2.evt | modeM0/AS1A05_108T01_9000002438_16484cztM0_level2_quad_clean.evt |
| Size (bytes) | 466,974,720 | 92,419,200 |
| Size | 445.3 MB | 88.1 MB |
| Events in quadrant A | 3,132,350 | 600,530 |
| Events in quadrant B | 3,449,347 | 618,381 |
| Events in quadrant C | 4,136,982 | 569,178 |
| Events in quadrant D | 2,991,296 | 566,342 |
| Mode M9 | |||
|---|---|---|---|
| Quadrant | BADHDUFLAG | Total packets | Discarded packets |
| A | 0 | 15 | 0 |
| B | 0 | 15 | 0 |
| C | 0 | 15 | 0 |
| D | 0 | 16 | 0 |
| Mode SS | |||
|---|---|---|---|
| Quadrant | BADHDUFLAG | Total packets | Discarded packets |
| A | 0 | 130 | 0 |
| B | 0 | 130 | 0 |
| C | 0 | 130 | 0 |
| D | 0 | 130 | 0 |
| Mode M0 | |||
|---|---|---|---|
| Quadrant | BADHDUFLAG | Total packets | Discarded packets |
| A | 0 | 13449 | 3 |
| B | 0 | 14354 | 2 |
| C | 0 | 16438 | 2 |
| D | 0 | 13351 | 2 |
| Quadrant | Total seconds | Saturated seconds | Saturation percentage |
|---|---|---|---|
| A | 6365 | 37 | 0.581304% |
| B | 6365 | 57 | 0.895522% |
| C | 6365 | 209 | 3.283582% |
| D | 6365 | 23 | 0.361351% |
Noise dominated data is calculated using 1-second bins in cleaned event files. If a bin has >2000 counts, and if more than 50% of those come from <1% of pixels, then it is considered to be noise-dominated and hence unusable.
| Quadrant | # 1 sec bins | Bins with >0 counts | Bins with >2000 counts | High rate bins dominated by noise | Noise dominated (total time) | Noise dominated (detector-on time) | Marked lightcurve |
|---|---|---|---|---|---|---|---|
| A | 7581 | 6366 | 2 | 2 | 0.03% | 0.03% | 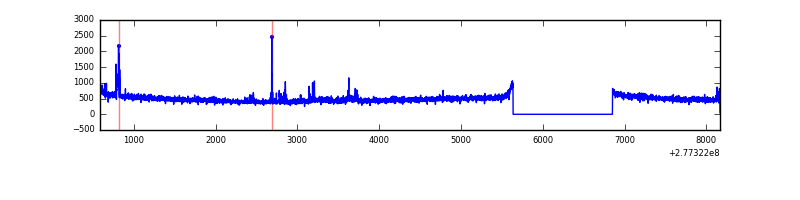 |
| B | 7581 | 6366 | 4 | 4 | 0.05% | 0.06% | 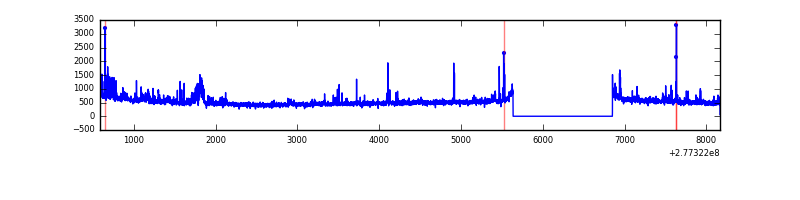 |
| C | 7581 | 6366 | 29 | 29 | 0.38% | 0.46% | 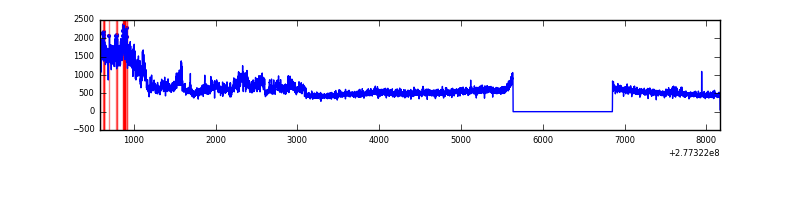 |
| D | 7581 | 6366 | 11 | 11 | 0.15% | 0.17% | 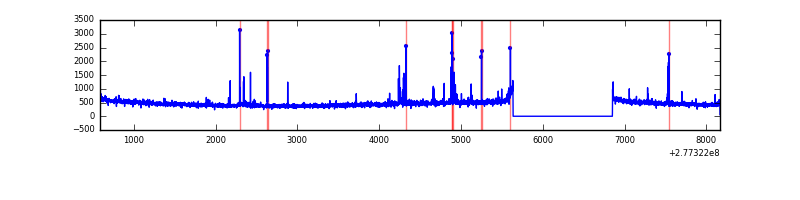 |
Top three noisy pixels from each quadrant. If the there are fewer than three noisy pixels in the level2.evt file, extra rows are filled as -1
| Pixel properties | Quadrant properties | ||||||
|---|---|---|---|---|---|---|---|
| Quadrant | DetID | PixID | Counts | Sigma | Mean | Median | Sigma |
| A | 15 | 174 | 106052 | 666.93 | 787 | 773 | 157.9 |
| A | 0 | 226 | 6849 | 38.49 | 787 | 773 | 157.9 |
| A | 3 | 137 | 5774 | 31.68 | 787 | 773 | 157.9 |
| B | 0 | 189 | 89327 | 591.33 | 793 | 775 | 149.7 |
| B | 15 | 35 | 83885 | 554.99 | 793 | 775 | 149.7 |
| B | 0 | 198 | 51267 | 337.18 | 793 | 775 | 149.7 |
| C | 3 | 233 | 1043451 | 6007.06 | 745 | 749 | 173.6 |
| C | 14 | 238 | 116821 | 668.7 | 745 | 749 | 173.6 |
| C | 7 | 247 | 72597 | 413.92 | 745 | 749 | 173.6 |
| D | 13 | 249 | 32919 | 173.54 | 755 | 732 | 185.5 |
| D | 12 | 218 | 32817 | 172.99 | 755 | 732 | 185.5 |
| D | 2 | 234 | 27899 | 146.47 | 755 | 732 | 185.5 |
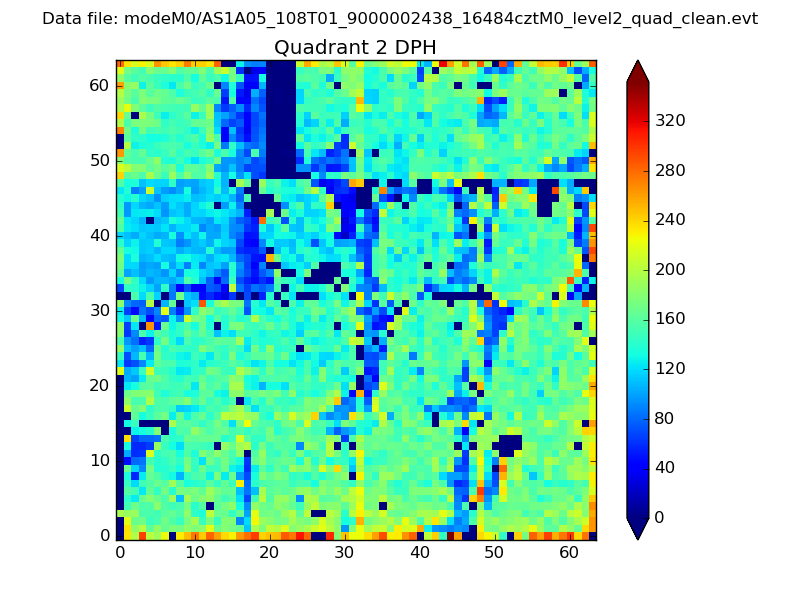
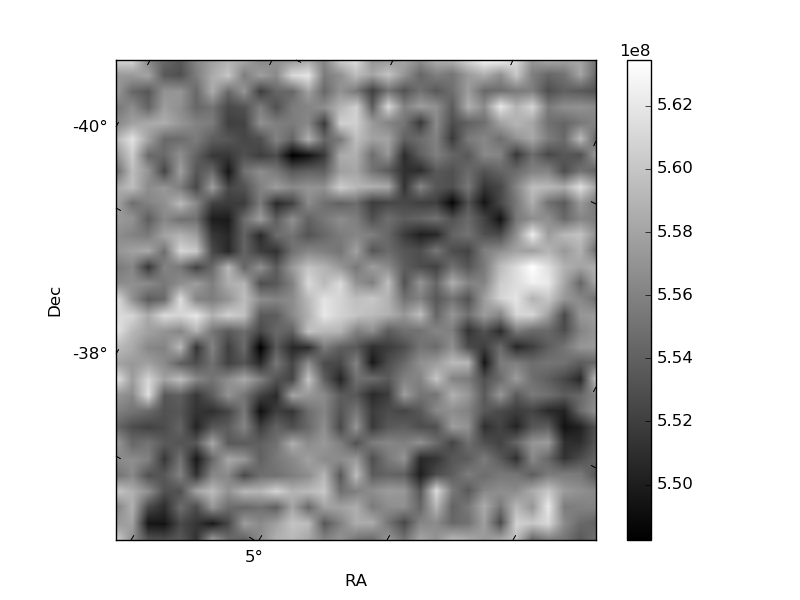
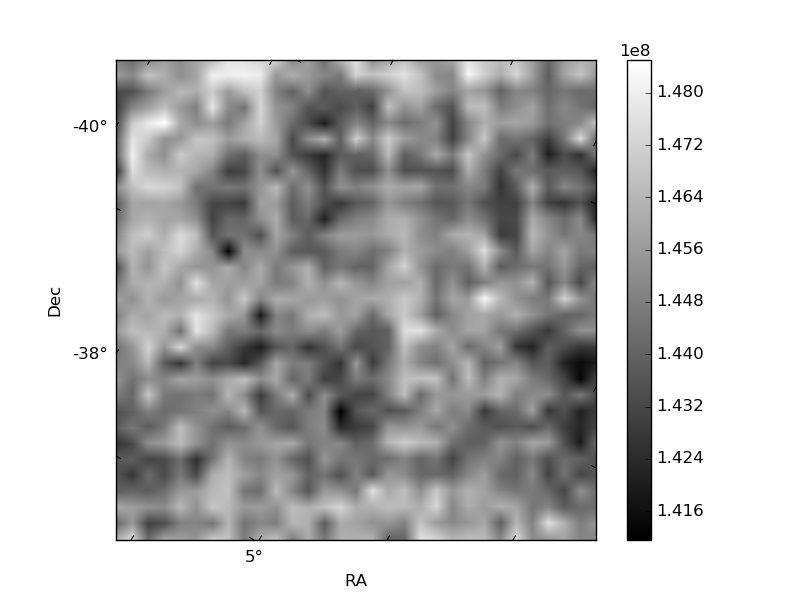
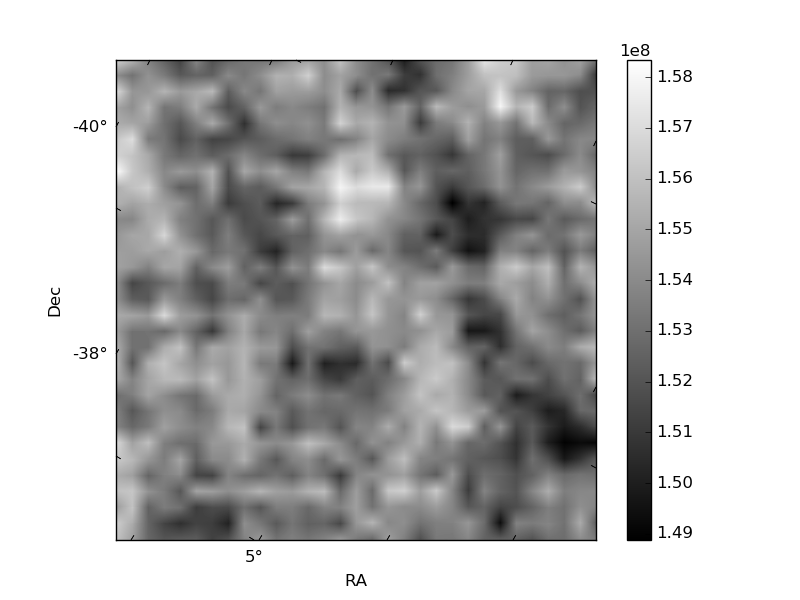
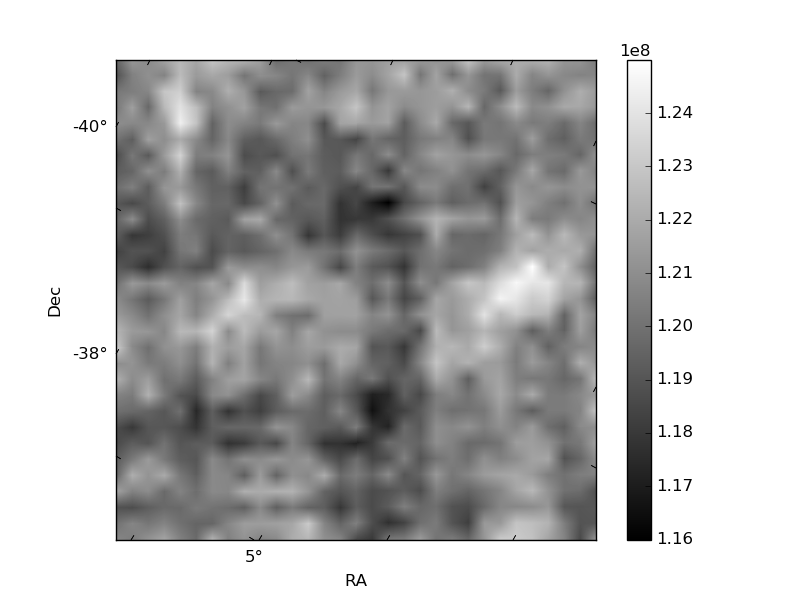
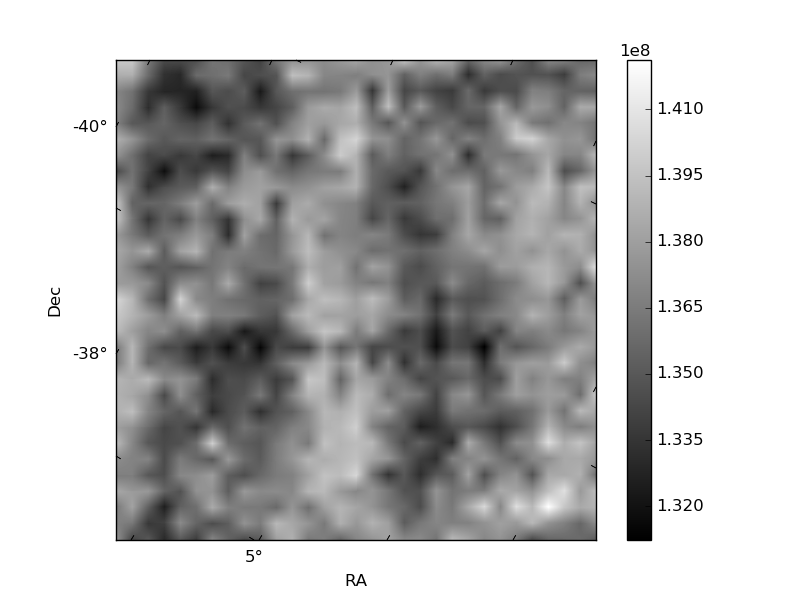
Histogram calculated using DETX and DETY for each event in the final _common_clean file
| Quadrant A | 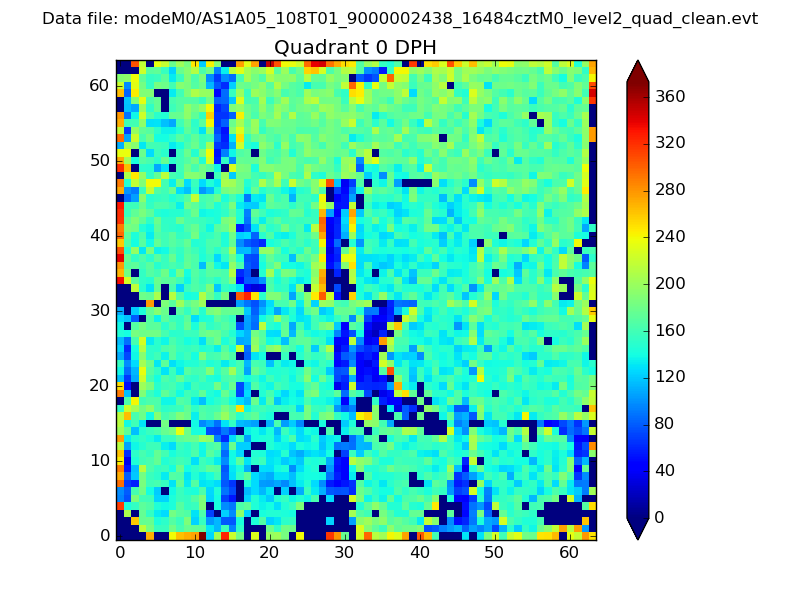 |
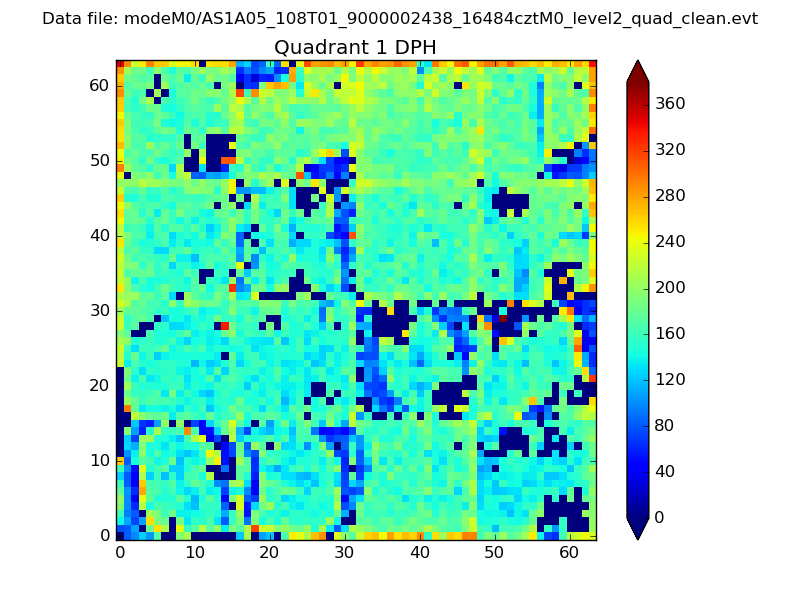 |
Quadrant B |
|---|---|---|---|
| Quadrant D | 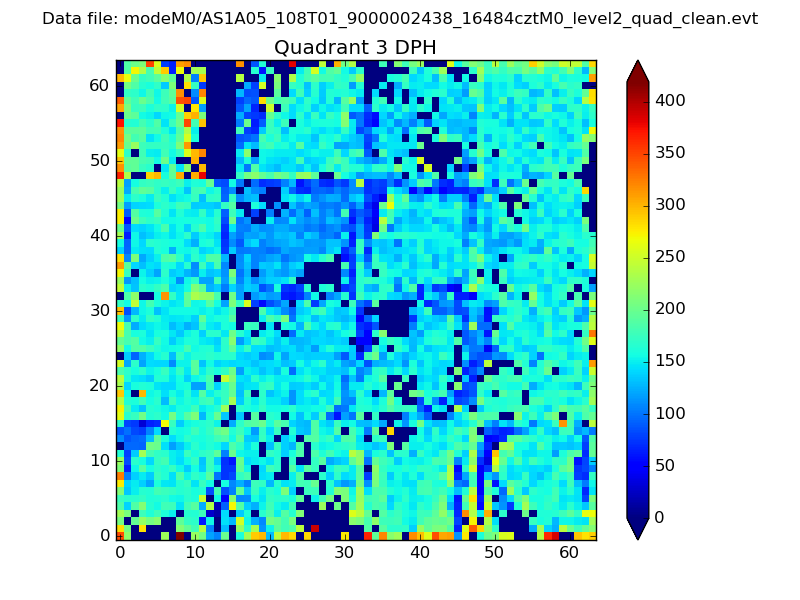 |
 |
Quadrant C |
| Plot type | Count rate plots | Images |
|---|---|---|
| Comparison with Poisson distribution Blue bars denote a histogram of data divided into 1 sec bins. Red curve is a Poisson curve with rate = median count rate of data. |
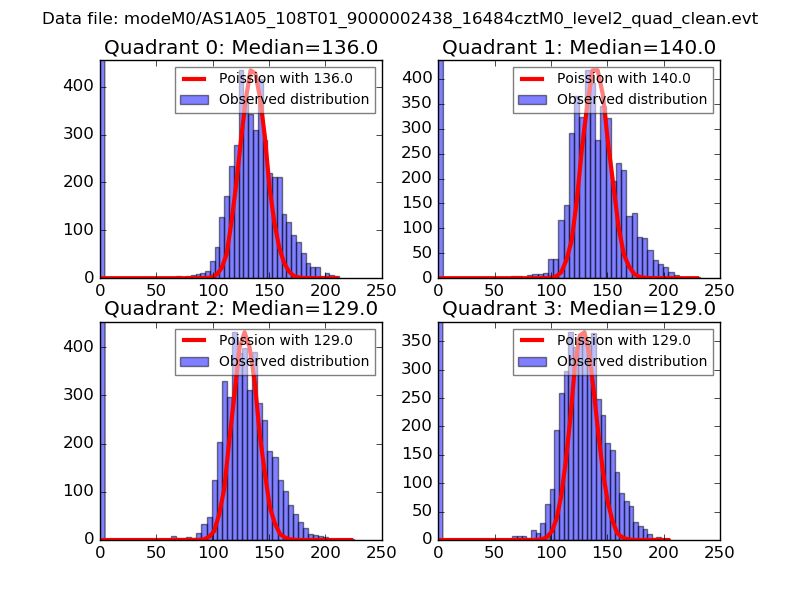 |
 |
| Quadrant-wise count rates Data is divided into 100 sec bins |
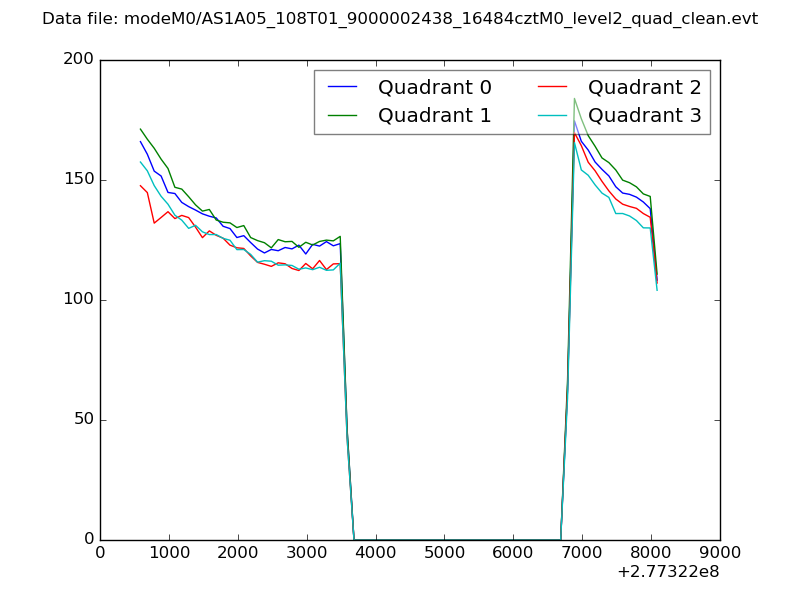 |
|
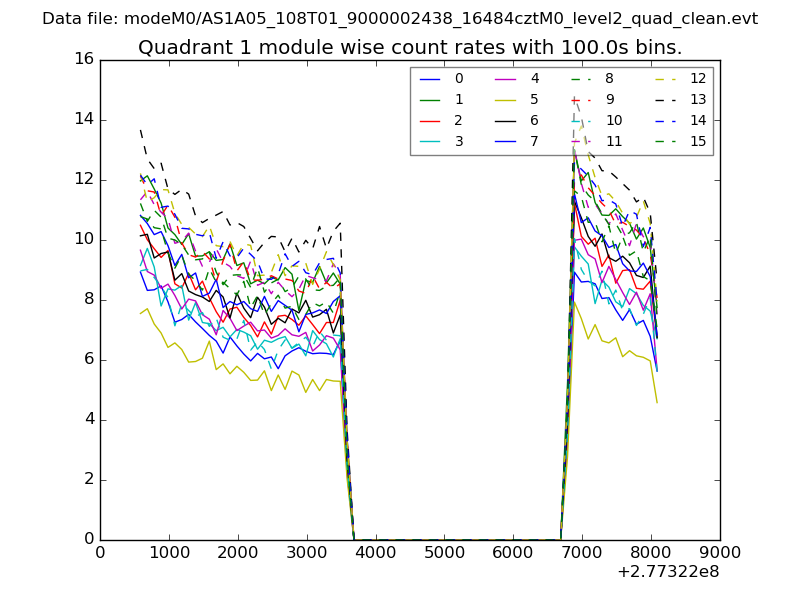
| Module-wise count rates for Quadrant A Data is divided into 100 sec bins |
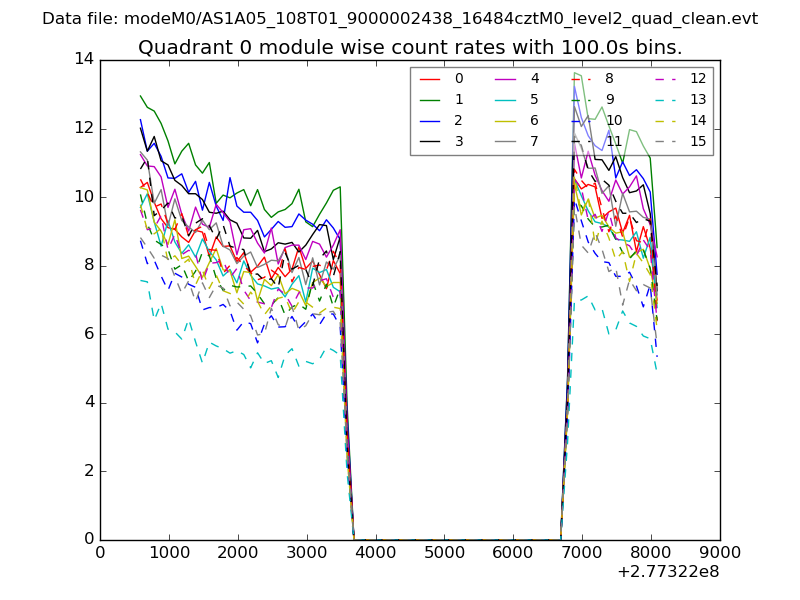 |
 |
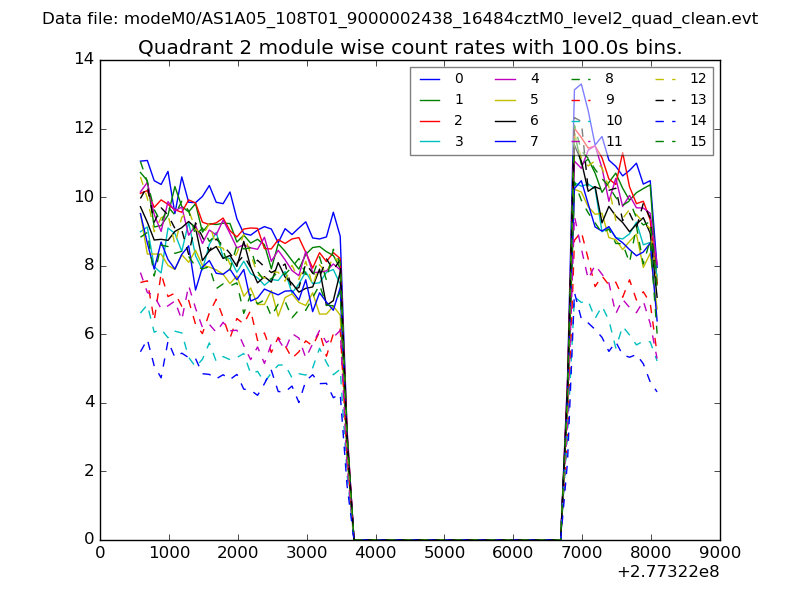
| Module-wise count rates for Quadrant B Data is divided into 100 sec bins |
 |
 |
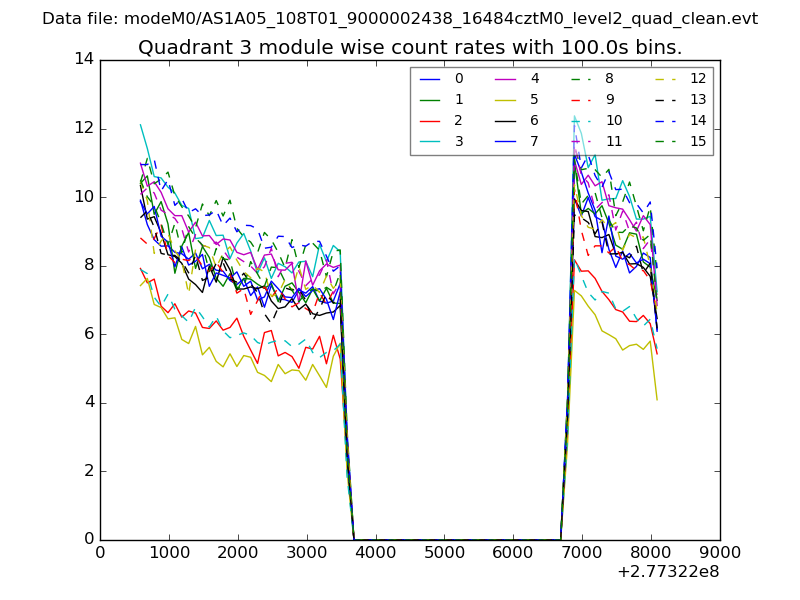
| Module-wise count rates for Quadrant C Data is divided into 100 sec bins |
 |
 |
| Module-wise count rates for Quadrant D Data is divided into 100 sec bins |
 |
 |
| Parameter | Plot |
|---|---|
| CZT HV Monitor | 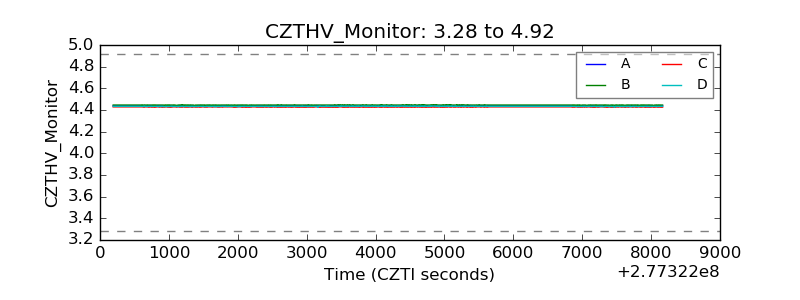 |
| D_VDD | 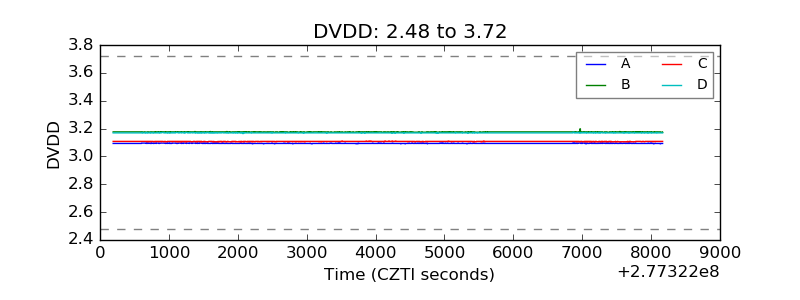 |
| Temperature 1 | 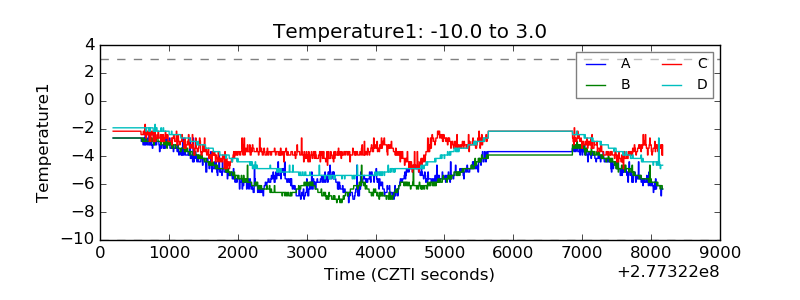 |
| Veto HV Monitor | 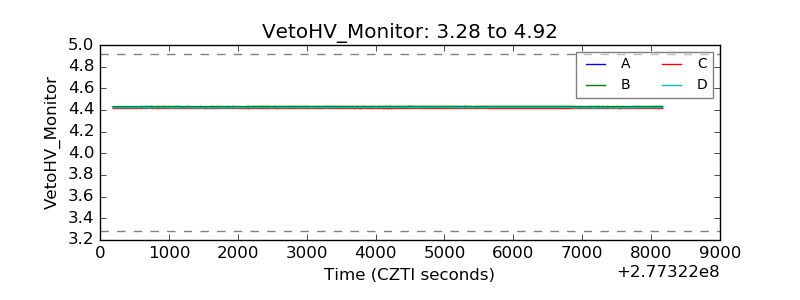 |
| Veto LLD | 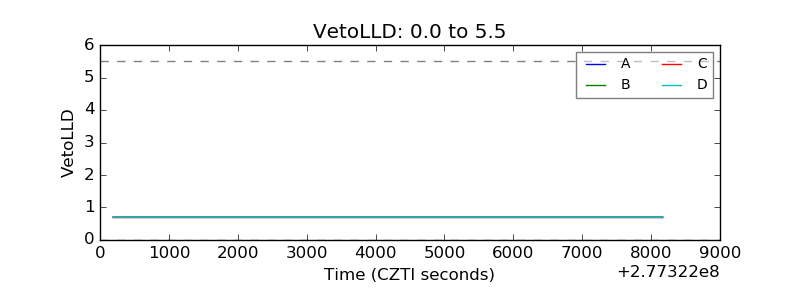 |
| Alpha Counter | 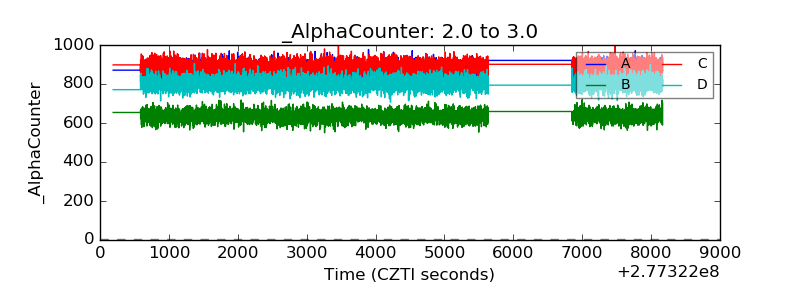 |
| _CPM_Rate | 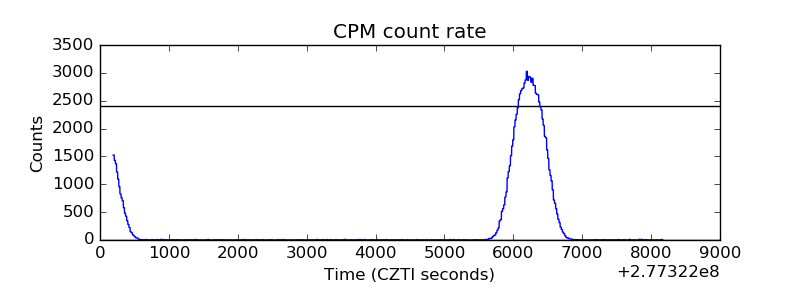 |
| CZT Counter | 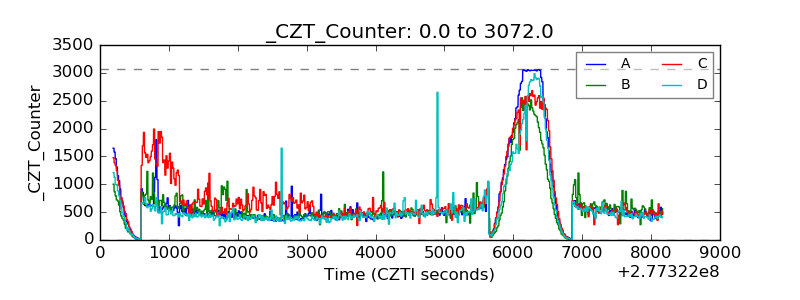 |
| +2.5 Volts monitor | 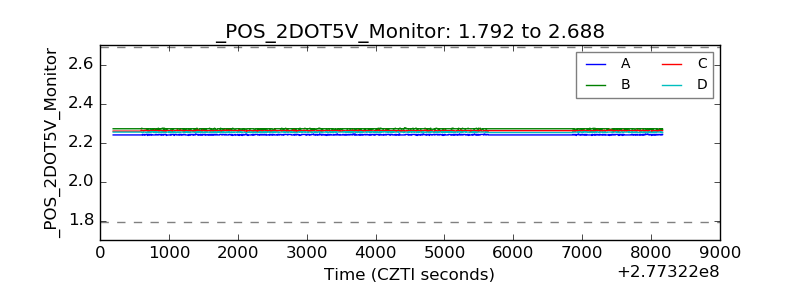 |
| +5 Volts monitor |  |
| _ROLL_ROT | 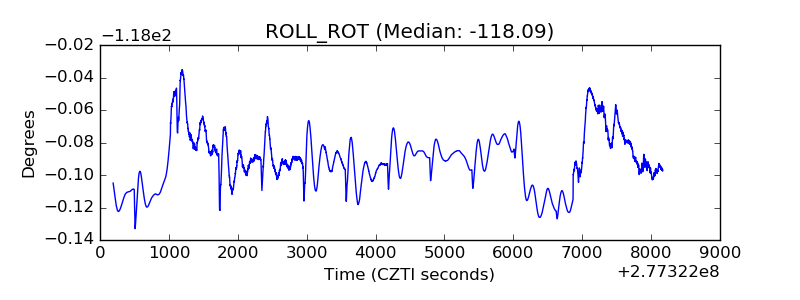 |
| _Roll_DEC | 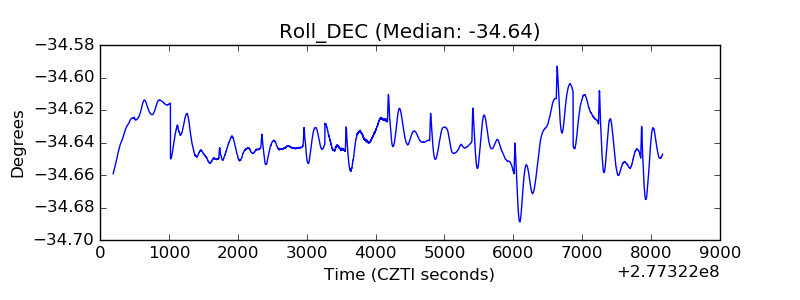 |
| _Roll_RA | 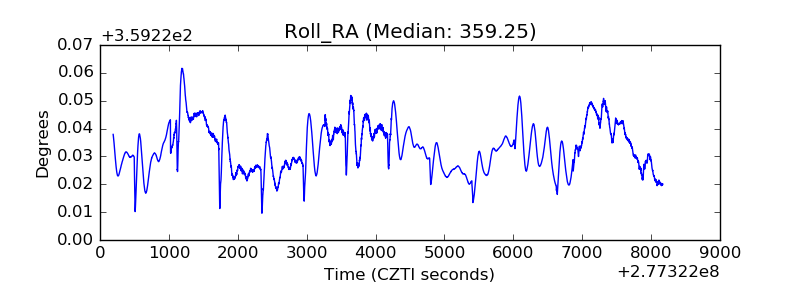 |
| Veto Counter | 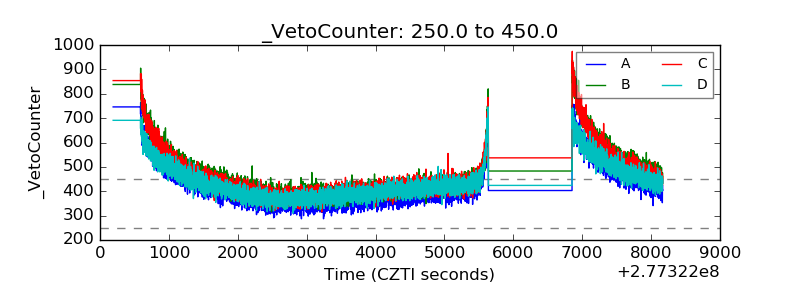 |