| Param | Original file | Final file |
|---|---|---|
| Filename | modeM0/AS1A05_108T01_9000002438_16485cztM0_level2.evt | modeM0/AS1A05_108T01_9000002438_16485cztM0_level2_quad_clean.evt |
| Size (bytes) | 508,472,640 | 95,031,360 |
| Size | 484.9 MB | 90.6 MB |
| Events in quadrant A | 4,572,121 | 607,010 |
| Events in quadrant B | 3,530,611 | 639,396 |
| Events in quadrant C | 3,495,144 | 602,413 |
| Events in quadrant D | 3,363,356 | 579,017 |
| Mode M9 | |||
|---|---|---|---|
| Quadrant | BADHDUFLAG | Total packets | Discarded packets |
| A | 0 | 22 | 0 |
| B | 0 | 22 | 0 |
| C | 0 | 22 | 0 |
| D | 0 | 23 | 0 |
| Mode SS | |||
|---|---|---|---|
| Quadrant | BADHDUFLAG | Total packets | Discarded packets |
| A | 0 | 130 | 0 |
| B | 0 | 130 | 0 |
| C | 0 | 130 | 0 |
| D | 0 | 130 | 0 |
| Mode M0 | |||
|---|---|---|---|
| Quadrant | BADHDUFLAG | Total packets | Discarded packets |
| A | 0 | 17746 | 3 |
| B | 0 | 14555 | 2 |
| C | 0 | 14563 | 2 |
| D | 0 | 14384 | 2 |
| Quadrant | Total seconds | Saturated seconds | Saturation percentage |
|---|---|---|---|
| A | 6455 | 505 | 7.823393% |
| B | 6455 | 120 | 1.859024% |
| C | 6455 | 55 | 0.852053% |
| D | 6455 | 76 | 1.177382% |
Noise dominated data is calculated using 1-second bins in cleaned event files. If a bin has >2000 counts, and if more than 50% of those come from <1% of pixels, then it is considered to be noise-dominated and hence unusable.
| Quadrant | # 1 sec bins | Bins with >0 counts | Bins with >2000 counts | High rate bins dominated by noise | Noise dominated (total time) | Noise dominated (detector-on time) | Marked lightcurve |
|---|---|---|---|---|---|---|---|
| A | 7736 | 6456 | 420 | 420 | 5.43% | 6.51% | 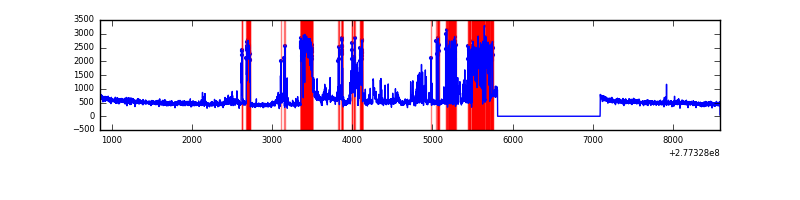 |
| B | 7736 | 6456 | 53 | 53 | 0.69% | 0.82% | 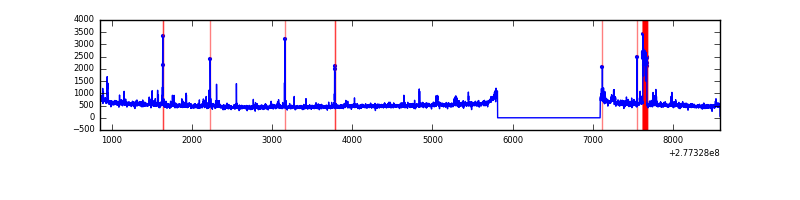 |
| C | 7736 | 6456 | 0 | 0 | 0.00% | 0.00% | 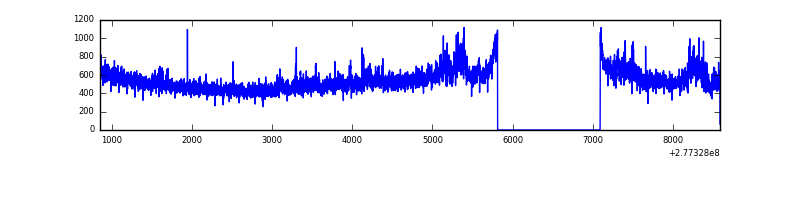 |
| D | 7736 | 6457 | 67 | 67 | 0.87% | 1.04% | 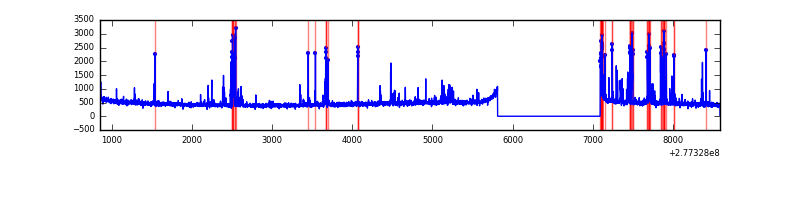 |
Top three noisy pixels from each quadrant. If the there are fewer than three noisy pixels in the level2.evt file, extra rows are filled as -1
| Pixel properties | Quadrant properties | ||||||
|---|---|---|---|---|---|---|---|
| Quadrant | DetID | PixID | Counts | Sigma | Mean | Median | Sigma |
| A | 15 | 174 | 1551016 | 9871.71 | 786 | 773 | 157.0 |
| A | 0 | 226 | 6821 | 38.51 | 786 | 773 | 157.0 |
| A | 12 | 194 | 5694 | 31.34 | 786 | 773 | 157.0 |
| B | 4 | 48 | 138858 | 895.83 | 818 | 800 | 154.1 |
| B | 0 | 198 | 51823 | 331.08 | 818 | 800 | 154.1 |
| B | 0 | 189 | 49916 | 318.7 | 818 | 800 | 154.1 |
| C | 3 | 233 | 277176 | 1534.71 | 777 | 783 | 180.1 |
| C | 14 | 238 | 123953 | 683.92 | 777 | 783 | 180.1 |
| C | 7 | 247 | 61743 | 338.49 | 777 | 783 | 180.1 |
| D | 12 | 218 | 253100 | 1329.71 | 776 | 752 | 189.8 |
| D | 2 | 33 | 74265 | 387.37 | 776 | 752 | 189.8 |
| D | 13 | 248 | 32132 | 165.35 | 776 | 752 | 189.8 |
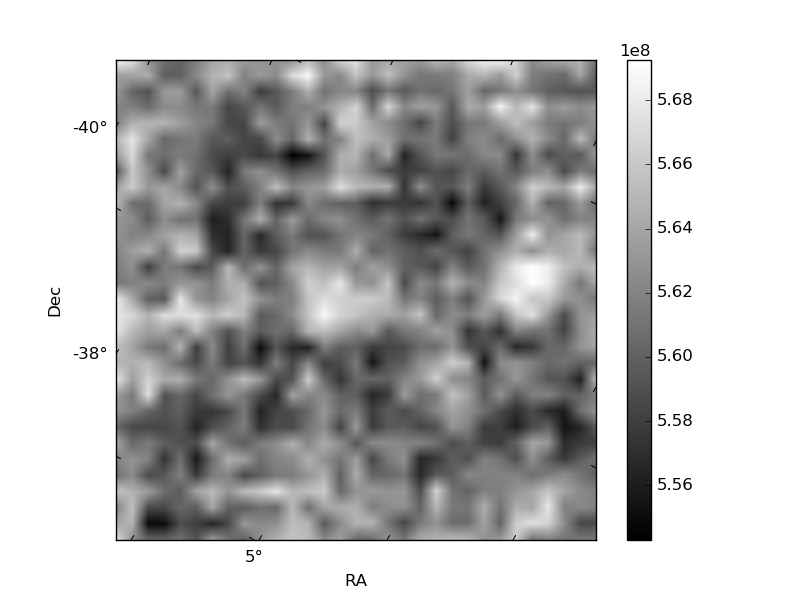
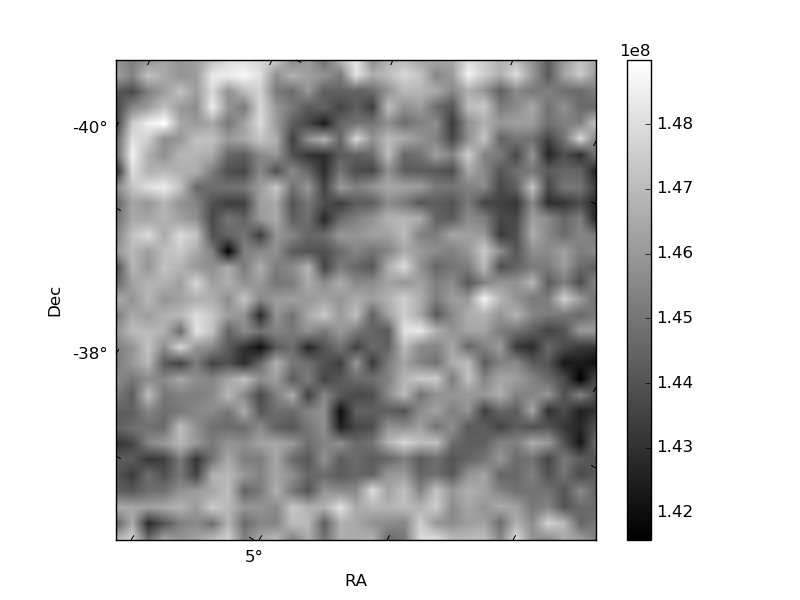
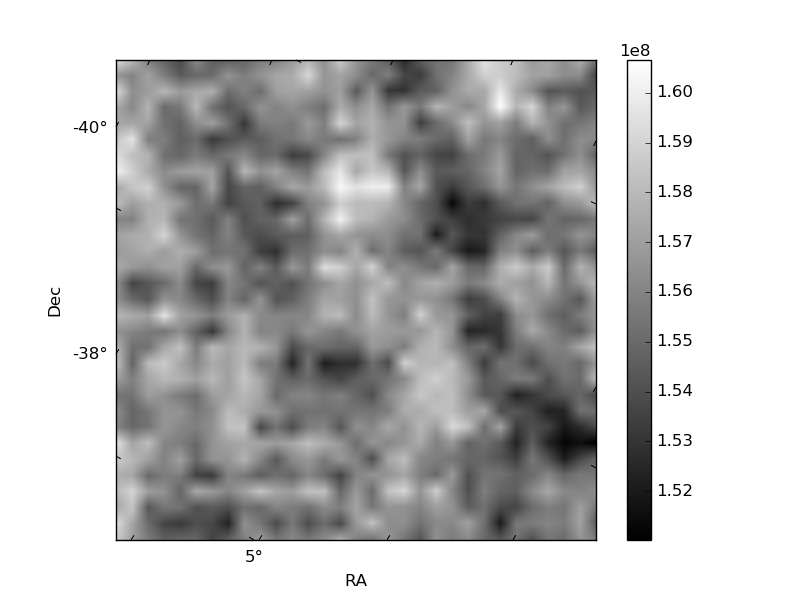
Histogram calculated using DETX and DETY for each event in the final _common_clean file
| Quadrant A | 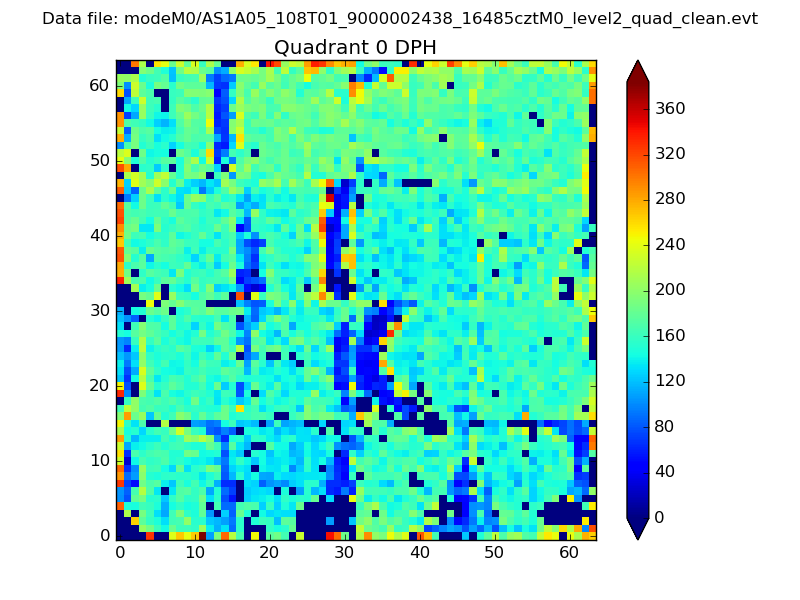 |
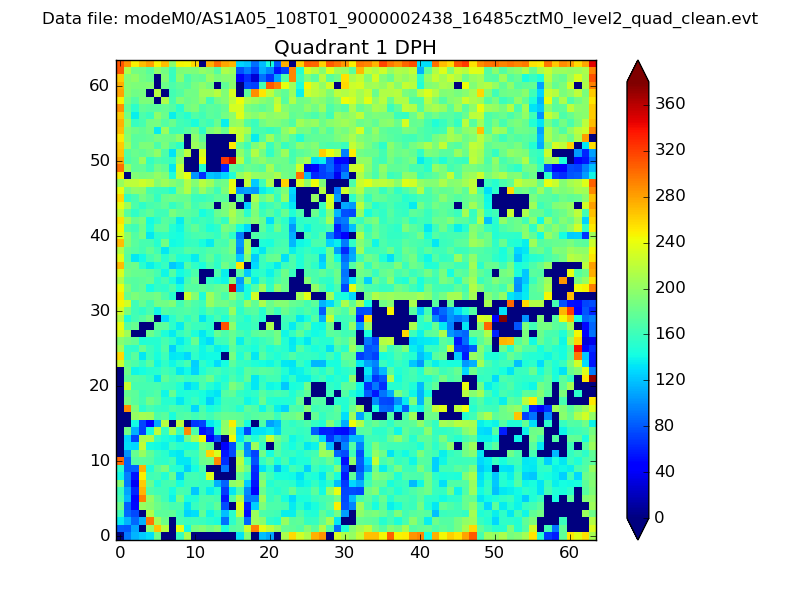 |
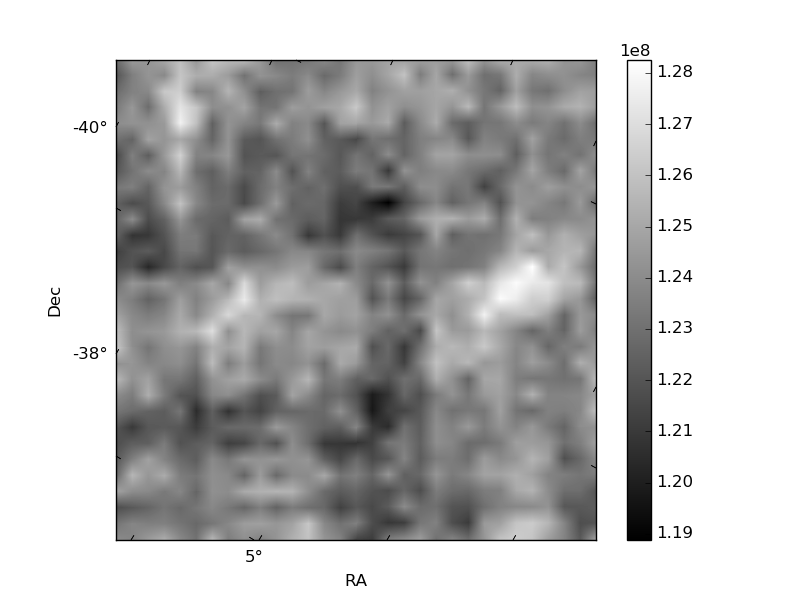
Quadrant B |
|---|---|---|---|
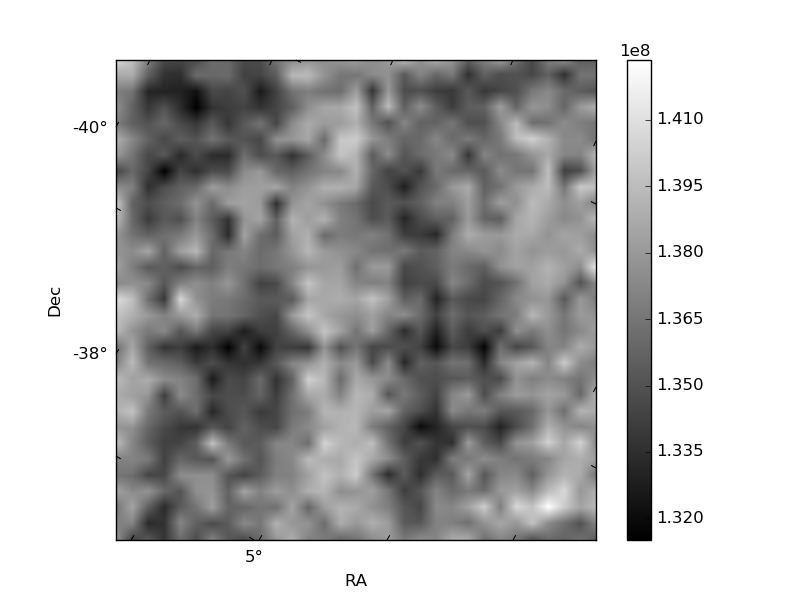
| Quadrant D | 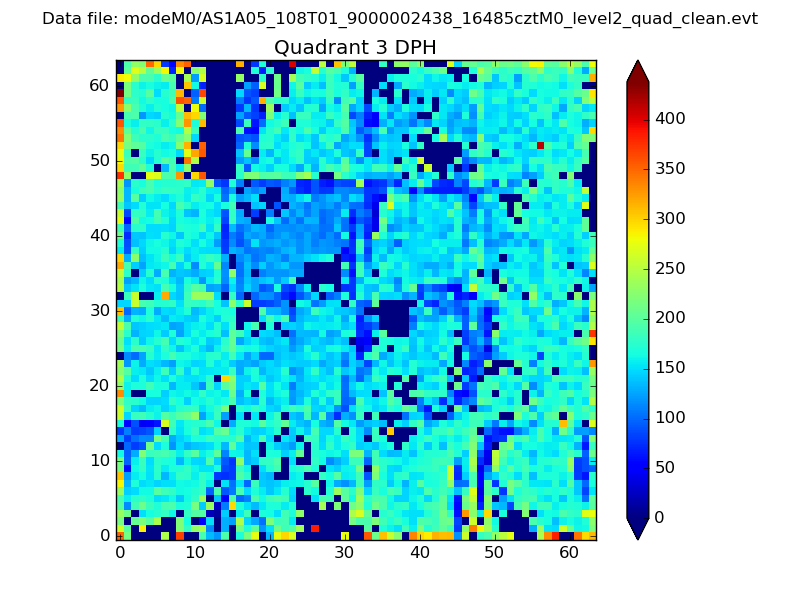 |
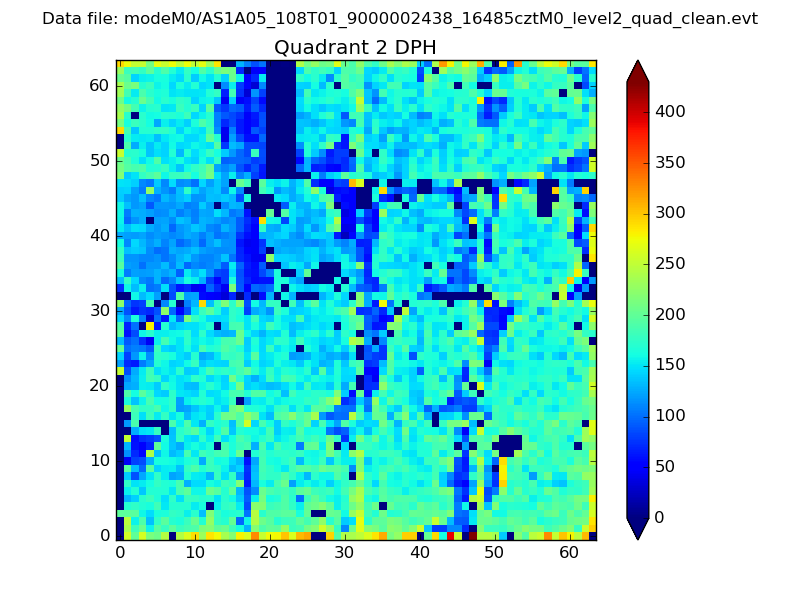 |
Quadrant C |
| Plot type | Count rate plots | Images |
|---|---|---|
| Comparison with Poisson distribution Blue bars denote a histogram of data divided into 1 sec bins. Red curve is a Poisson curve with rate = median count rate of data. |
 |
 |
| Quadrant-wise count rates Data is divided into 100 sec bins |
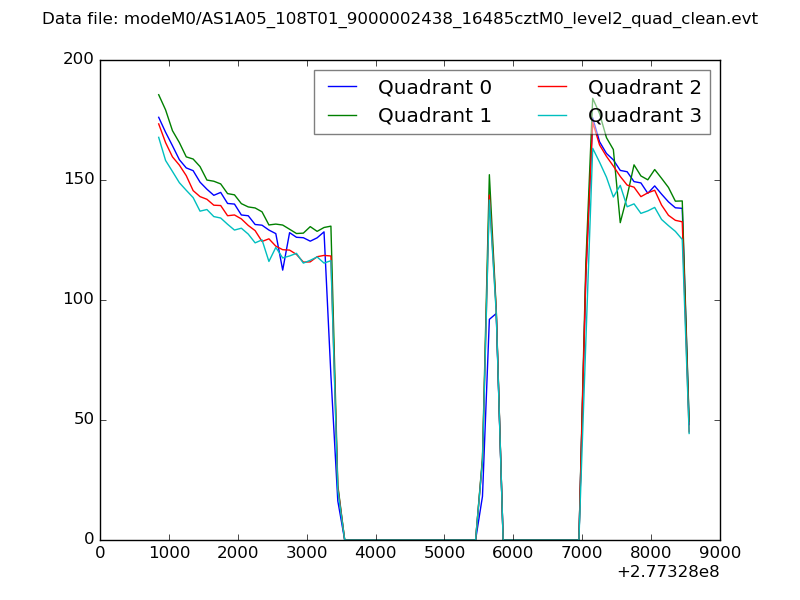 |
|
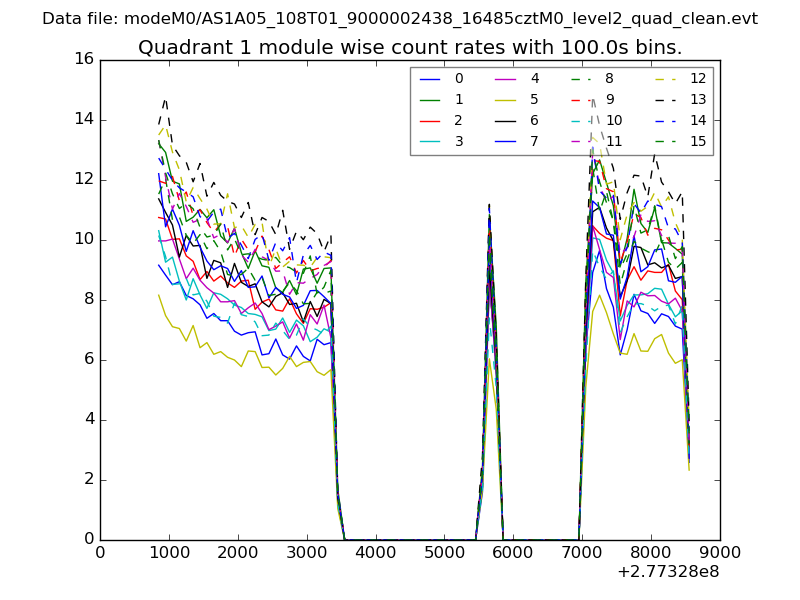
| Module-wise count rates for Quadrant A Data is divided into 100 sec bins |
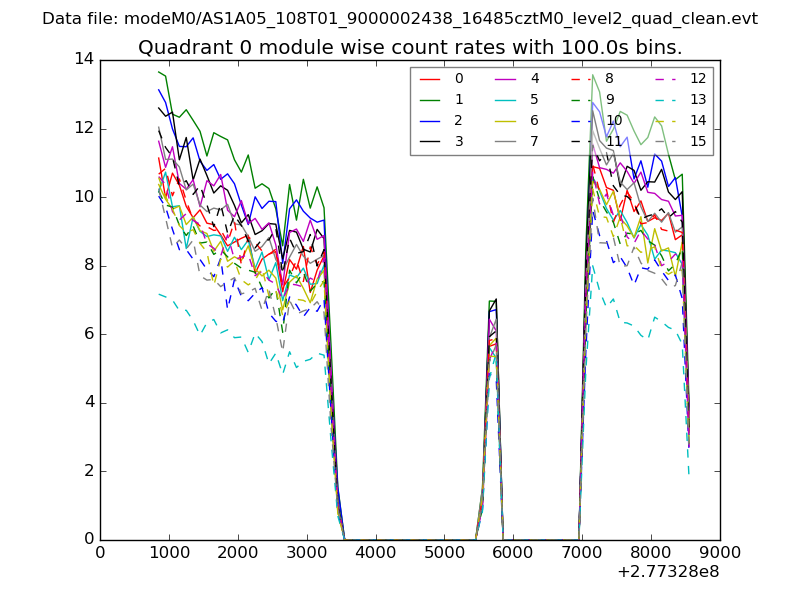 |
 |
| Module-wise count rates for Quadrant B Data is divided into 100 sec bins |
 |
 |
| Module-wise count rates for Quadrant C Data is divided into 100 sec bins |
 |
 |
| Module-wise count rates for Quadrant D Data is divided into 100 sec bins |
 |
 |
| Parameter | Plot |
|---|---|
| CZT HV Monitor |  |
| D_VDD | 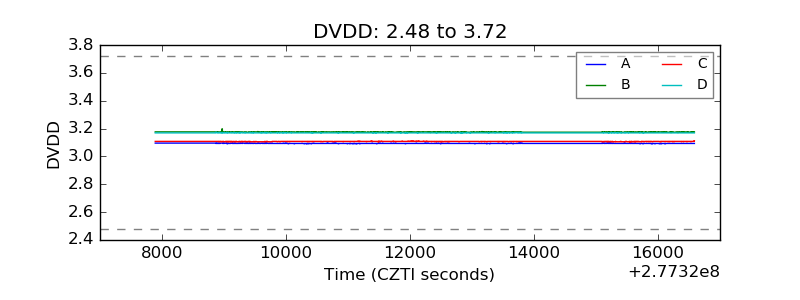 |
| Temperature 1 | 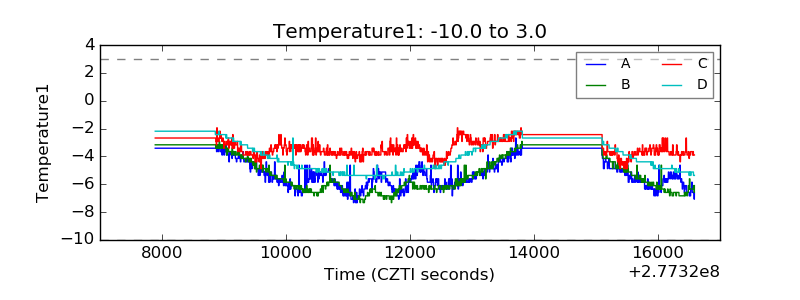 |
| Veto HV Monitor | 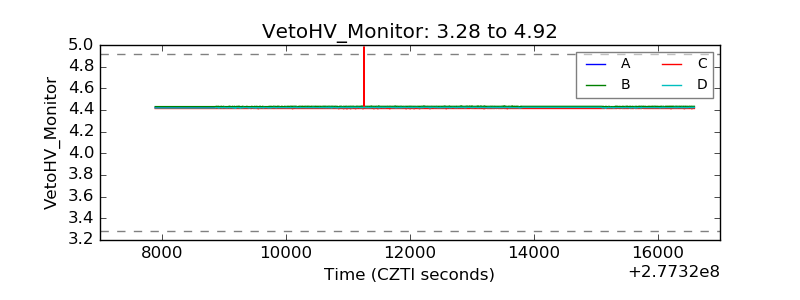 |
| Veto LLD | 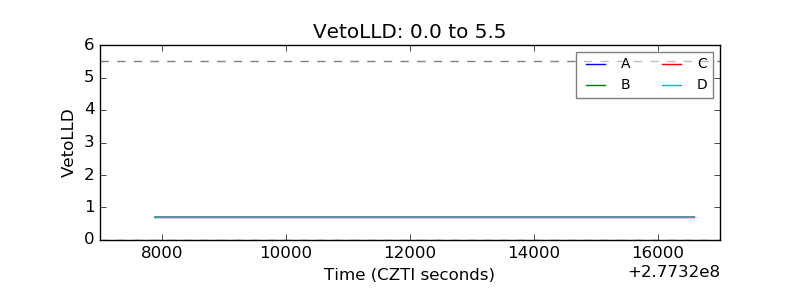 |
| Alpha Counter | 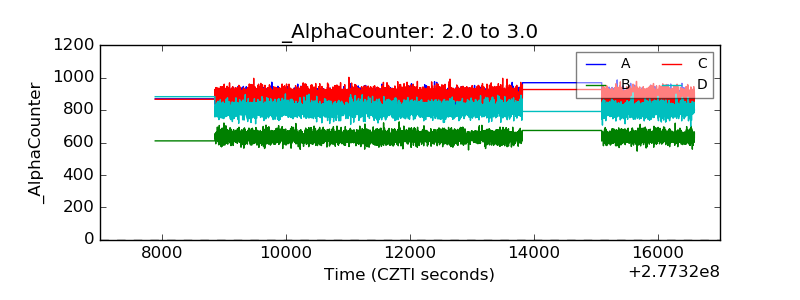 |
| _CPM_Rate | 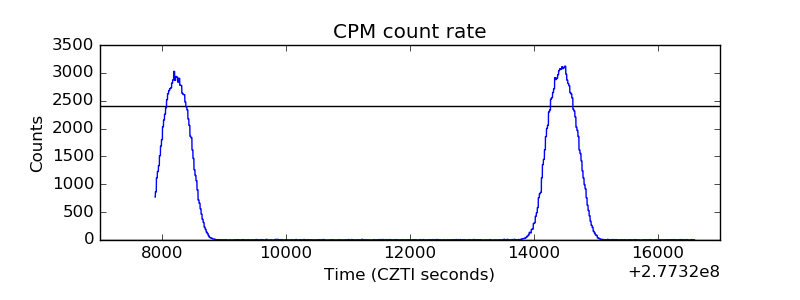 |
| CZT Counter | 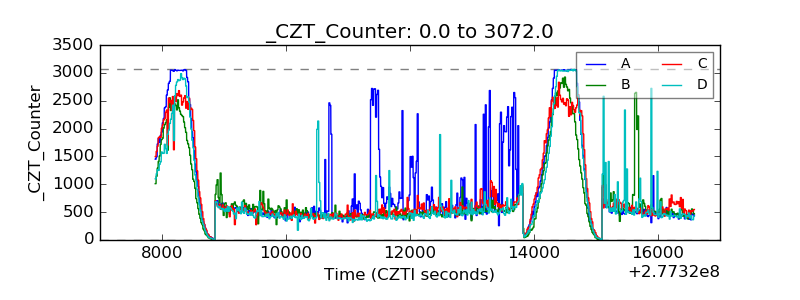 |
| +2.5 Volts monitor |  |
| +5 Volts monitor |  |
| _ROLL_ROT |  |
| _Roll_DEC | 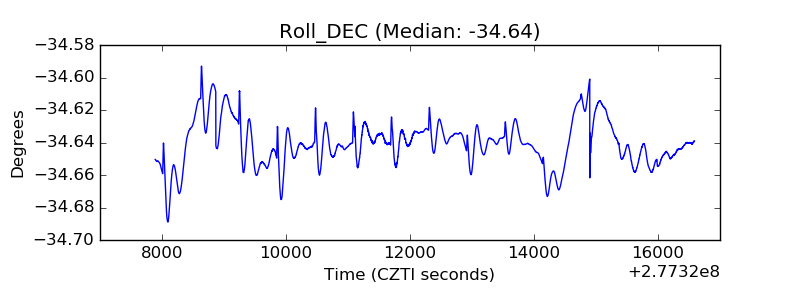 |
| _Roll_RA | 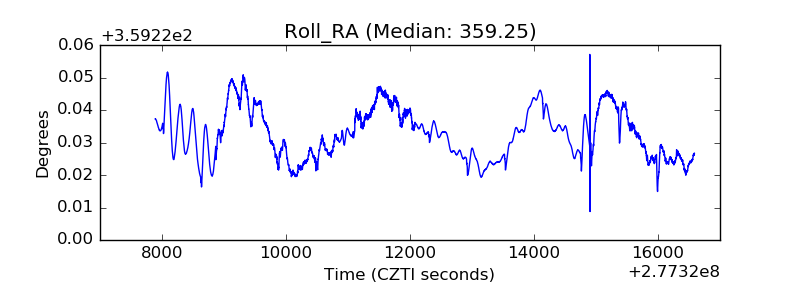 |
| Veto Counter |  |