| Param | Original file | Final file |
|---|---|---|
| Filename | modeM0/AS1A05_108T01_9000002438_16486cztM0_level2.evt | modeM0/AS1A05_108T01_9000002438_16486cztM0_level2_quad_clean.evt |
| Size (bytes) | 474,667,200 | 97,680,960 |
| Size | 452.7 MB | 93.2 MB |
| Events in quadrant A | 3,450,271 | 625,303 |
| Events in quadrant B | 3,589,979 | 655,072 |
| Events in quadrant C | 3,566,298 | 623,353 |
| Events in quadrant D | 3,325,652 | 599,513 |
| Mode M9 | |||
|---|---|---|---|
| Quadrant | BADHDUFLAG | Total packets | Discarded packets |
| A | 0 | 17 | 0 |
| B | 0 | 17 | 0 |
| C | 0 | 17 | 0 |
| D | 0 | 18 | 0 |
| Mode SS | |||
|---|---|---|---|
| Quadrant | BADHDUFLAG | Total packets | Discarded packets |
| A | 0 | 132 | 0 |
| B | 0 | 132 | 0 |
| C | 0 | 132 | 0 |
| D | 0 | 132 | 0 |
| Mode M0 | |||
|---|---|---|---|
| Quadrant | BADHDUFLAG | Total packets | Discarded packets |
| A | 0 | 14370 | 3 |
| B | 0 | 14691 | 2 |
| C | 0 | 14529 | 2 |
| D | 0 | 14296 | 2 |
| Quadrant | Total seconds | Saturated seconds | Saturation percentage |
|---|---|---|---|
| A | 6525 | 124 | 1.900383% |
| B | 6525 | 125 | 1.915709% |
| C | 6525 | 49 | 0.750958% |
| D | 6525 | 64 | 0.980843% |
Noise dominated data is calculated using 1-second bins in cleaned event files. If a bin has >2000 counts, and if more than 50% of those come from <1% of pixels, then it is considered to be noise-dominated and hence unusable.
| Quadrant | # 1 sec bins | Bins with >0 counts | Bins with >2000 counts | High rate bins dominated by noise | Noise dominated (total time) | Noise dominated (detector-on time) | Marked lightcurve |
|---|---|---|---|---|---|---|---|
| A | 7851 | 6526 | 80 | 80 | 1.02% | 1.23% | 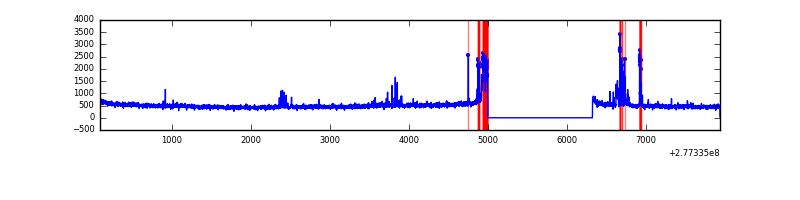 |
| B | 7851 | 6526 | 56 | 56 | 0.71% | 0.86% | 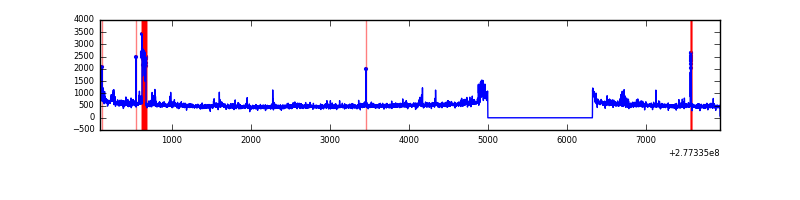 |
| C | 7851 | 6527 | 0 | 0 | 0.00% | 0.00% | 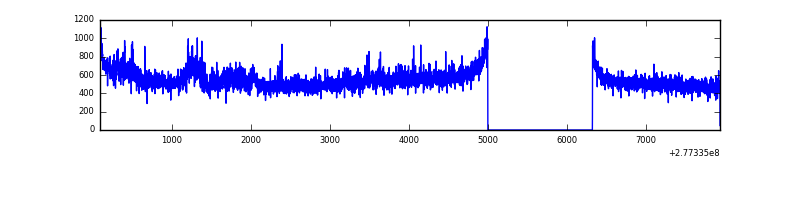 |
| D | 7851 | 6527 | 57 | 57 | 0.73% | 0.87% | 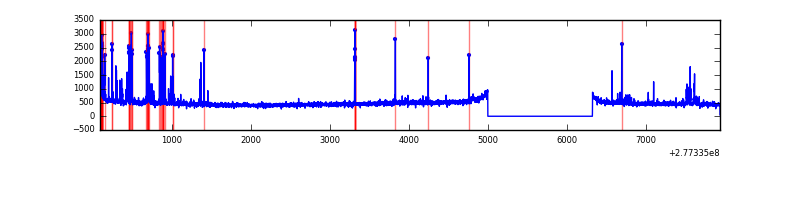 |
Top three noisy pixels from each quadrant. If the there are fewer than three noisy pixels in the level2.evt file, extra rows are filled as -1
| Pixel properties | Quadrant properties | ||||||
|---|---|---|---|---|---|---|---|
| Quadrant | DetID | PixID | Counts | Sigma | Mean | Median | Sigma |
| A | 15 | 174 | 342471 | 2106.77 | 808 | 795 | 162.2 |
| A | 0 | 226 | 7094 | 38.84 | 808 | 795 | 162.2 |
| A | 12 | 194 | 5935 | 31.69 | 808 | 795 | 162.2 |
| B | 4 | 48 | 142936 | 912.2 | 829 | 812 | 155.8 |
| B | 15 | 35 | 83637 | 531.6 | 829 | 812 | 155.8 |
| B | 0 | 189 | 41788 | 263.0 | 829 | 812 | 155.8 |
| C | 3 | 233 | 274671 | 1477.43 | 797 | 803 | 185.4 |
| C | 14 | 238 | 124819 | 669.03 | 797 | 803 | 185.4 |
| C | 7 | 247 | 59940 | 319.03 | 797 | 803 | 185.4 |
| D | 12 | 218 | 206454 | 1065.02 | 791 | 768 | 193.1 |
| D | 10 | 70 | 45903 | 233.7 | 791 | 768 | 193.1 |
| D | 2 | 234 | 29249 | 147.47 | 791 | 768 | 193.1 |
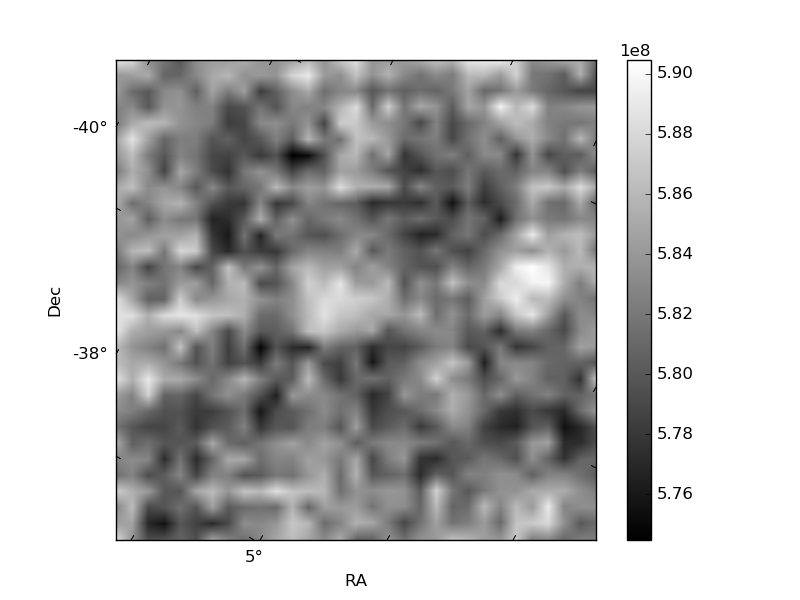
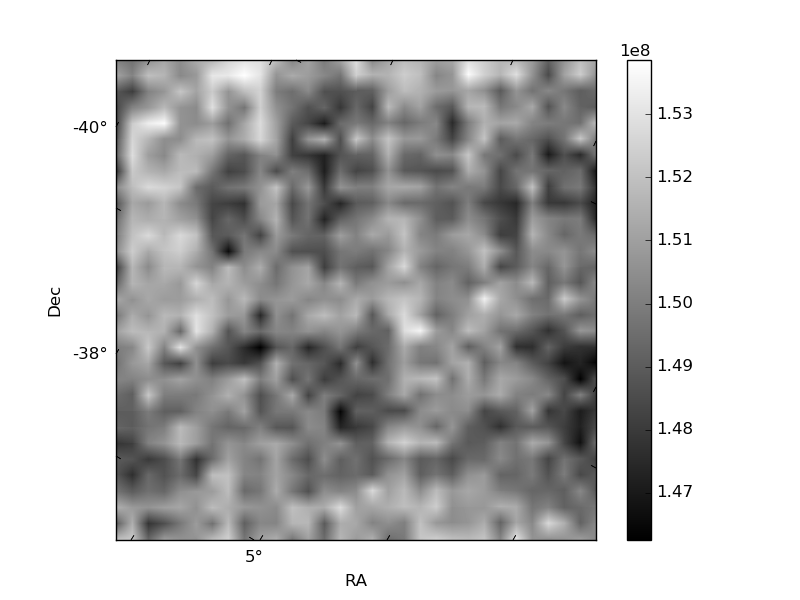
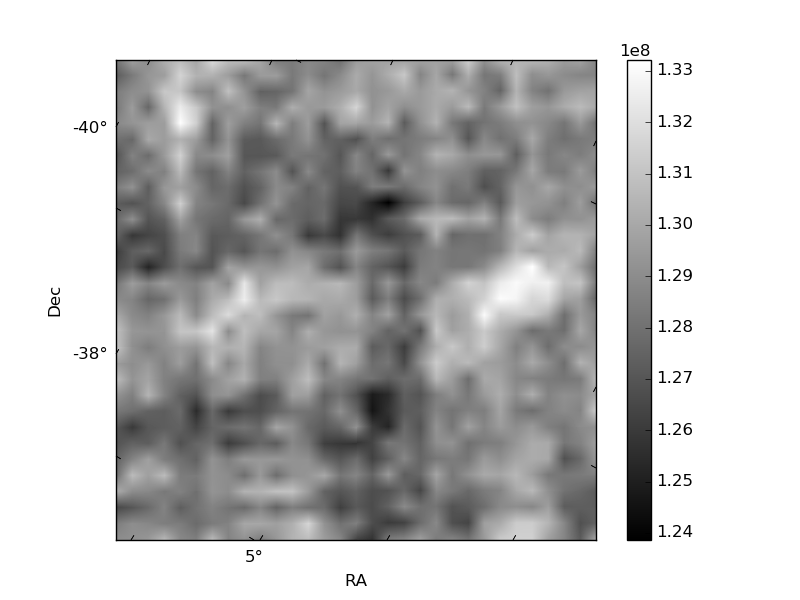
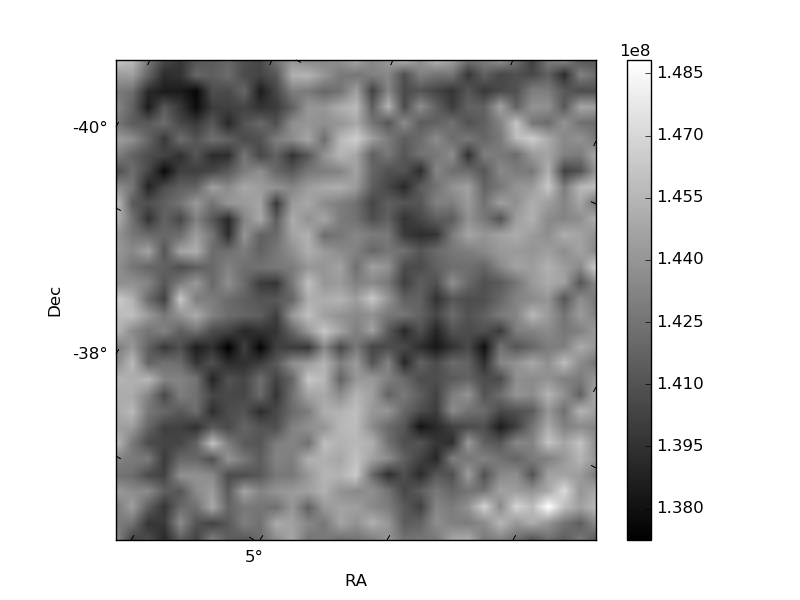
Histogram calculated using DETX and DETY for each event in the final _common_clean file
| Quadrant A | 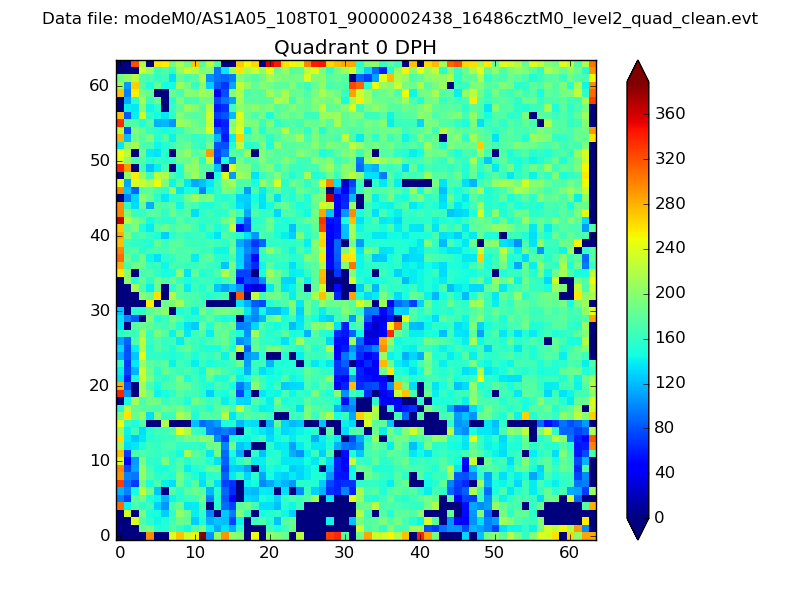 |
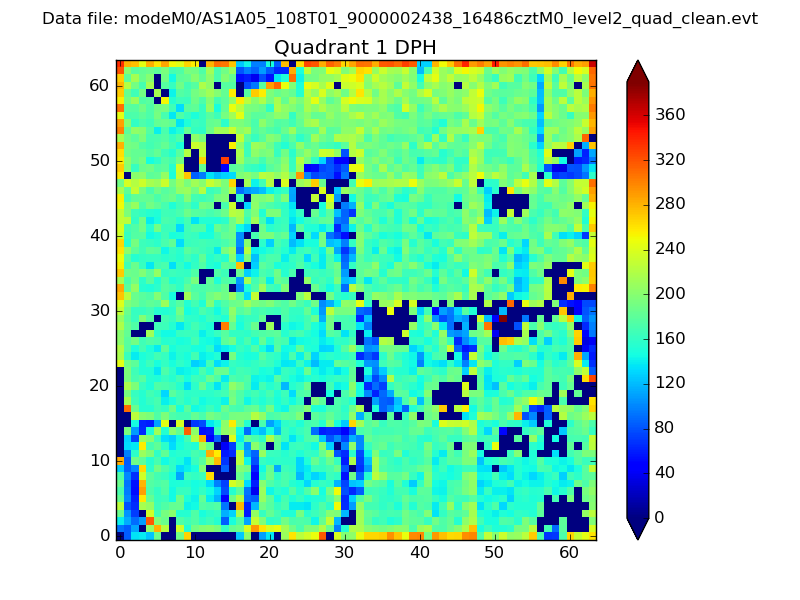 |
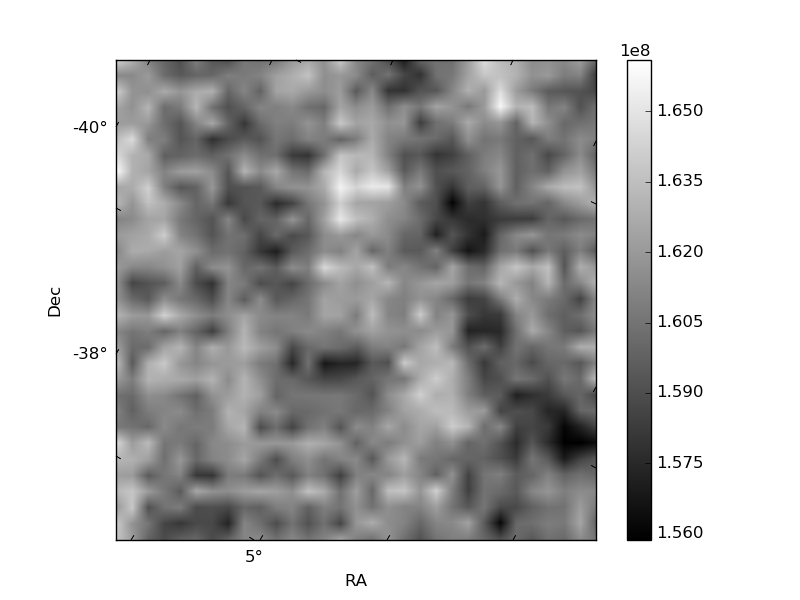
Quadrant B |
|---|---|---|---|
| Quadrant D | 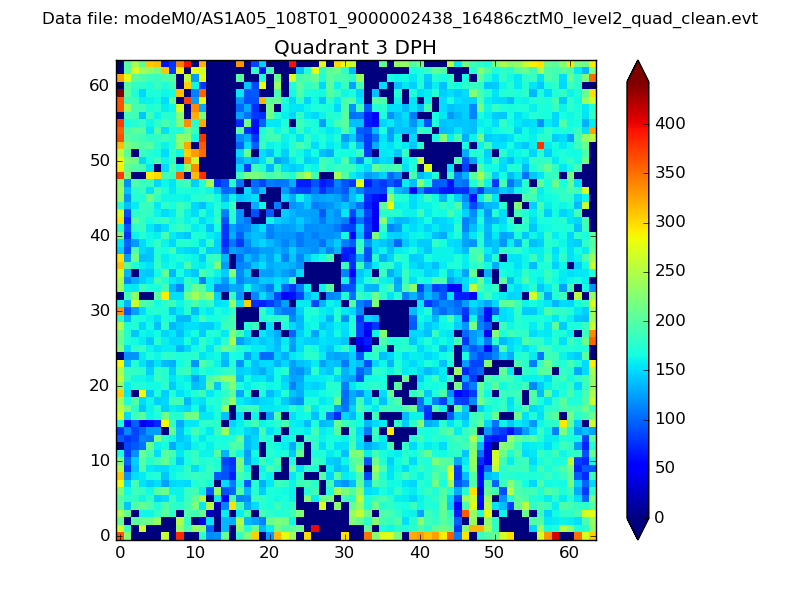 |
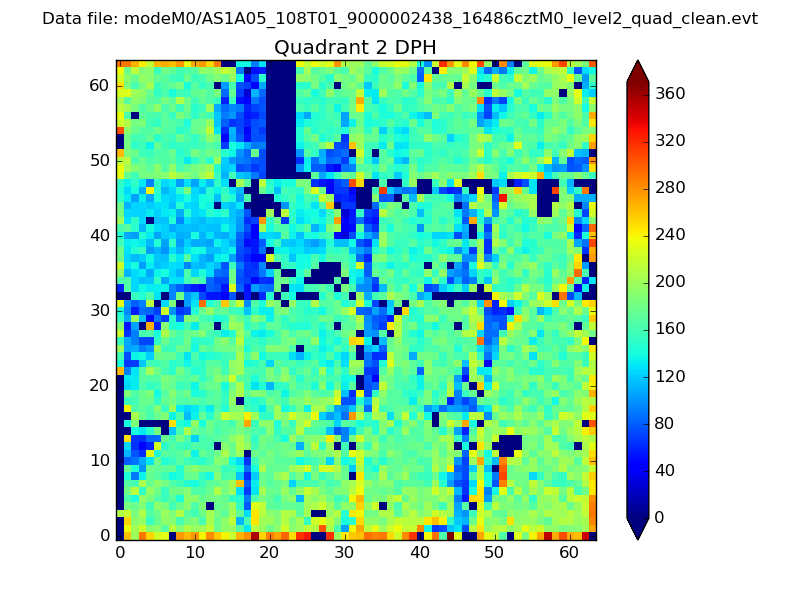 |
Quadrant C |
| Plot type | Count rate plots | Images |
|---|---|---|
| Comparison with Poisson distribution Blue bars denote a histogram of data divided into 1 sec bins. Red curve is a Poisson curve with rate = median count rate of data. |
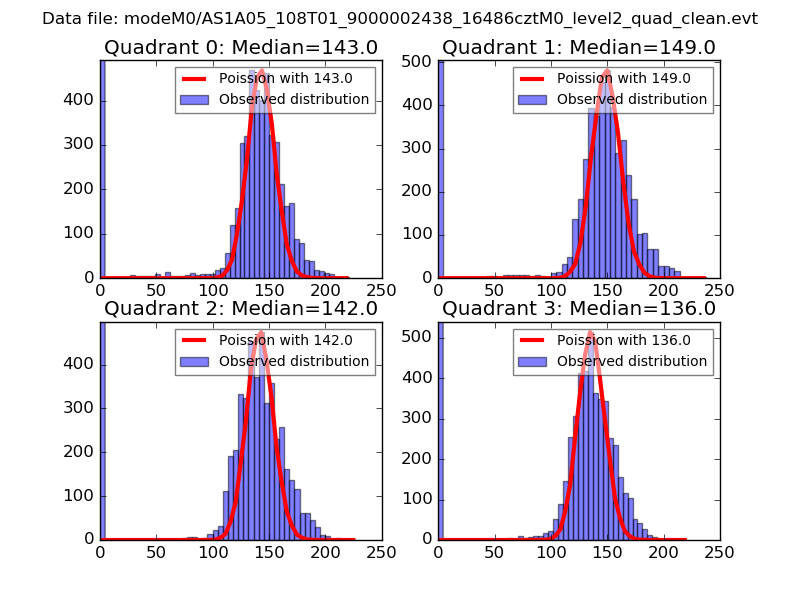 |
 |
| Quadrant-wise count rates Data is divided into 100 sec bins |
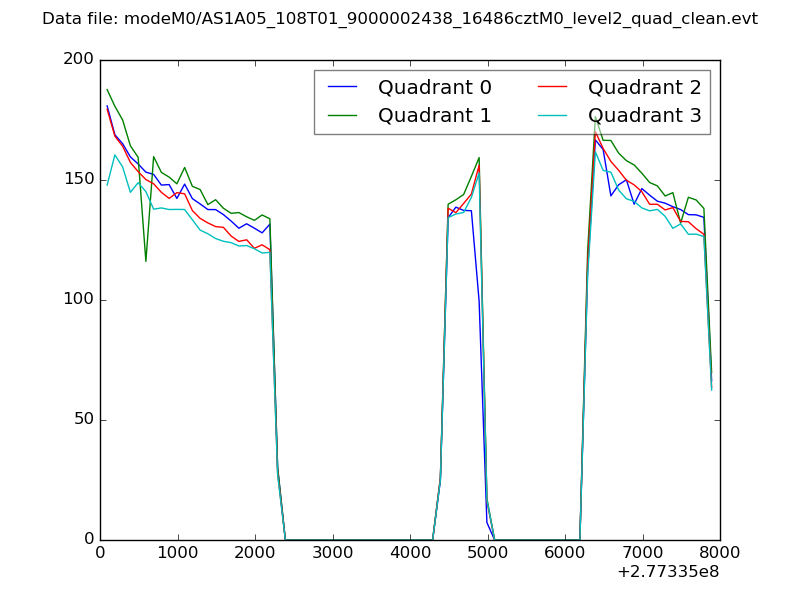 |
|
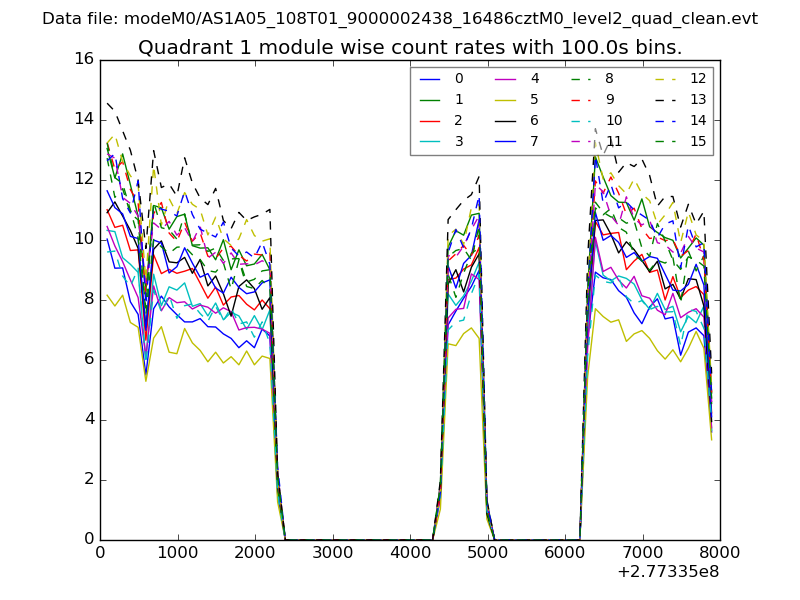
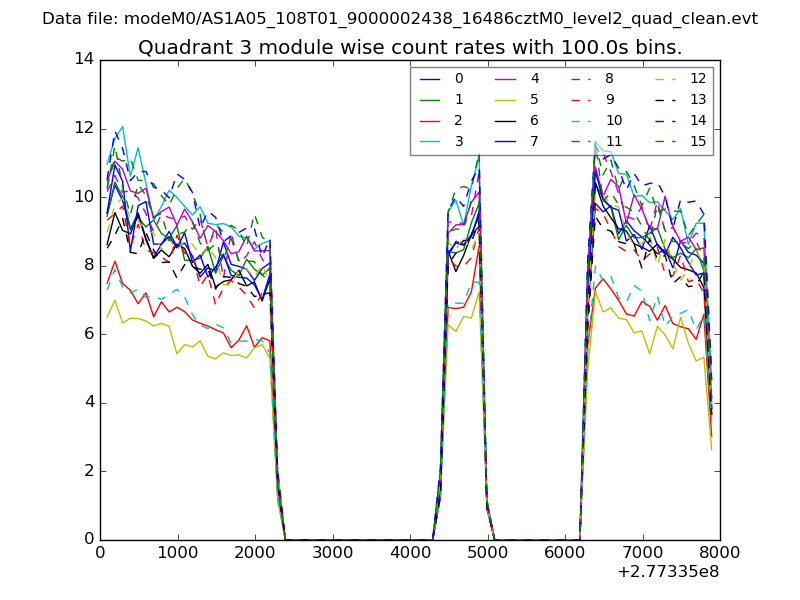
| Module-wise count rates for Quadrant A Data is divided into 100 sec bins |
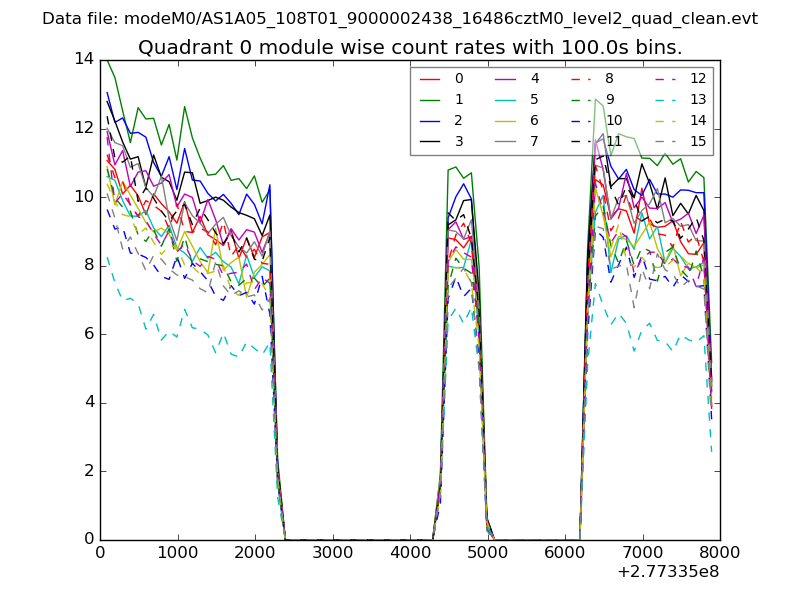 |
 |
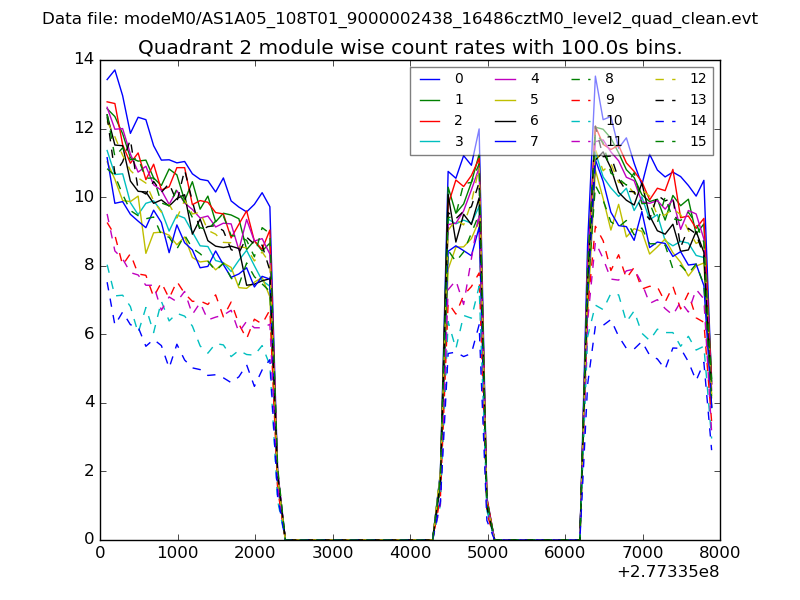
| Module-wise count rates for Quadrant B Data is divided into 100 sec bins |
 |
 |
| Module-wise count rates for Quadrant C Data is divided into 100 sec bins |
 |
 |
| Module-wise count rates for Quadrant D Data is divided into 100 sec bins |
 |
 |
| Parameter | Plot |
|---|---|
| CZT HV Monitor | 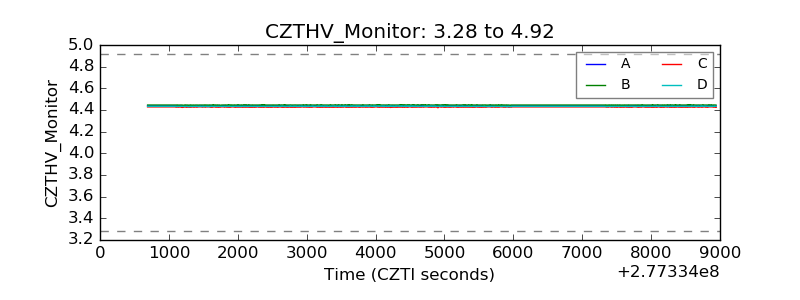 |
| D_VDD | 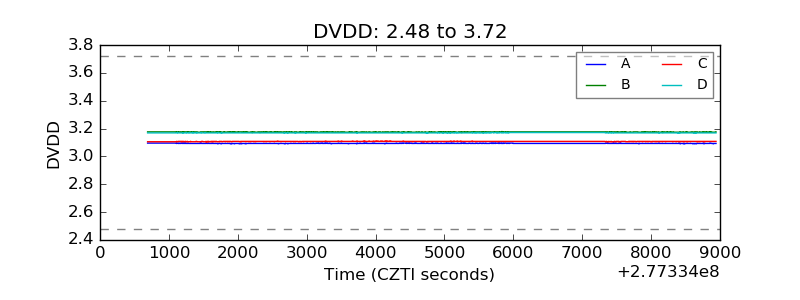 |
| Temperature 1 | 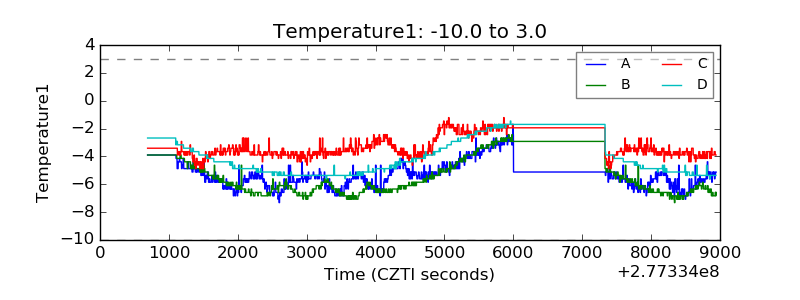 |
| Veto HV Monitor | 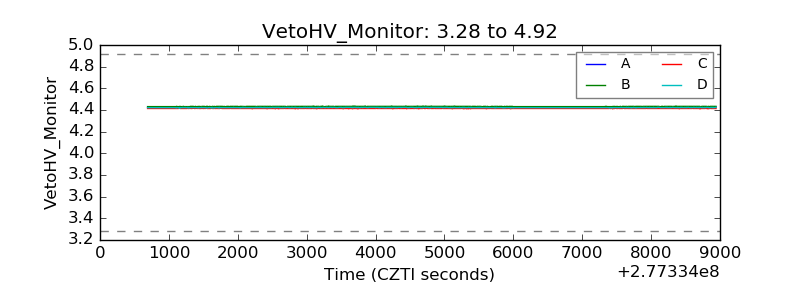 |
| Veto LLD | 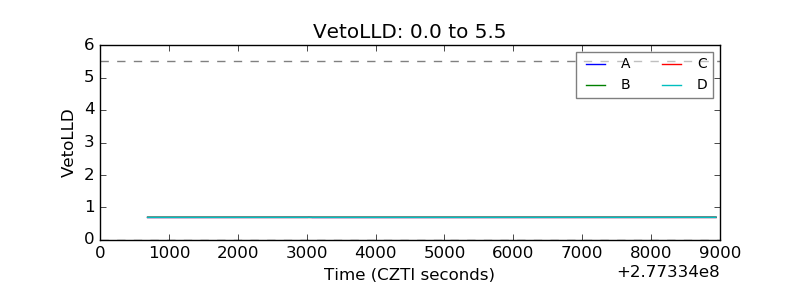 |
| Alpha Counter | 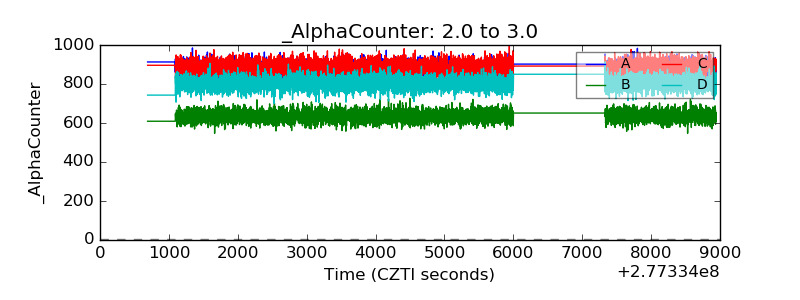 |
| _CPM_Rate | 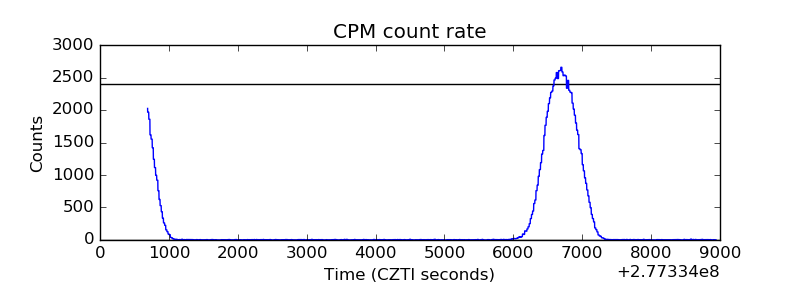 |
| CZT Counter | 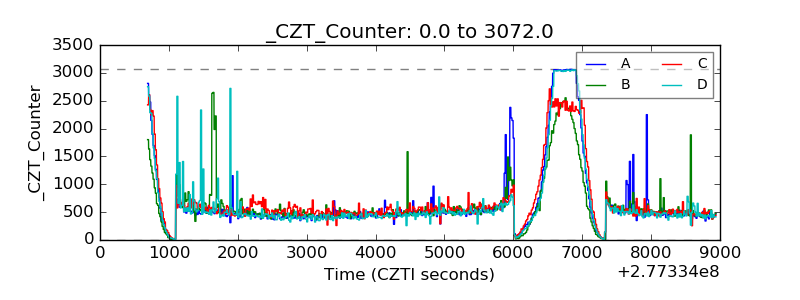 |
| +2.5 Volts monitor | 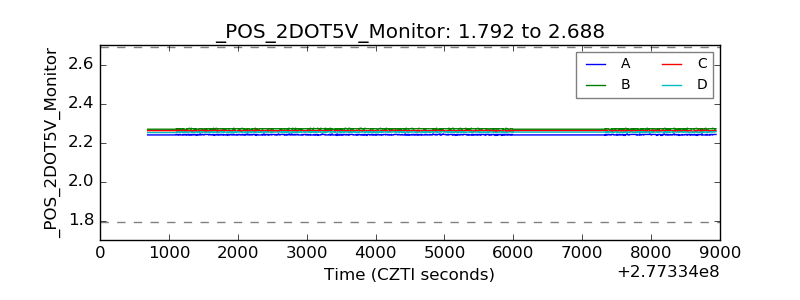 |
| +5 Volts monitor | 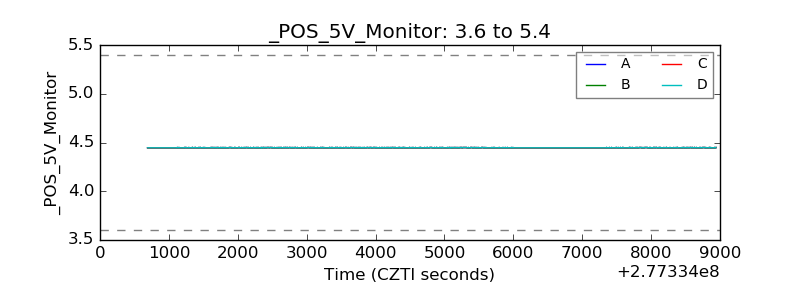 |
| _ROLL_ROT | 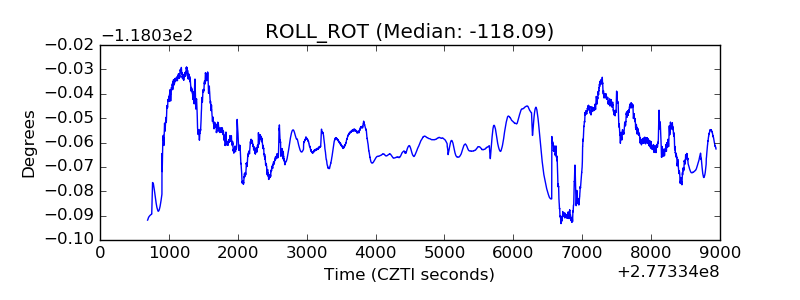 |
| _Roll_DEC |  |
| _Roll_RA | 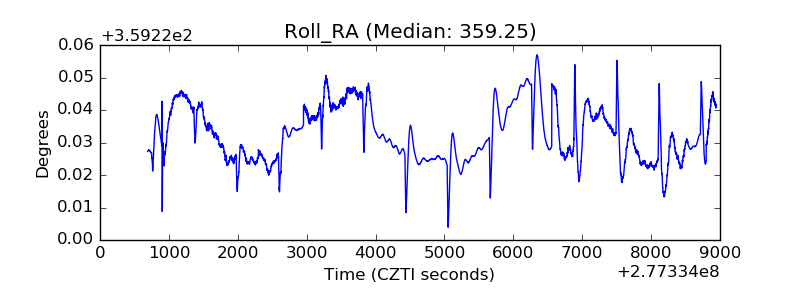 |
| Veto Counter | 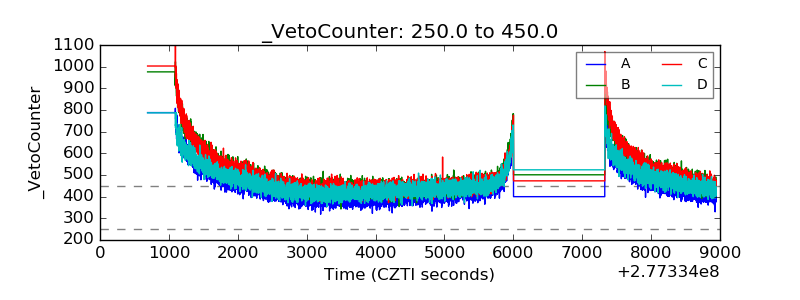 |