| Param | Original file | Final file |
|---|---|---|
| Filename | modeM0/AS1A05_108T01_9000002438_16487cztM0_level2.evt | modeM0/AS1A05_108T01_9000002438_16487cztM0_level2_quad_clean.evt |
| Size (bytes) | 499,844,160 | 92,056,320 |
| Size | 476.7 MB | 87.8 MB |
| Events in quadrant A | 4,561,334 | 555,950 |
| Events in quadrant B | 3,441,863 | 618,174 |
| Events in quadrant C | 3,600,674 | 587,479 |
| Events in quadrant D | 3,090,752 | 570,758 |
| Mode M9 | |||
|---|---|---|---|
| Quadrant | BADHDUFLAG | Total packets | Discarded packets |
| A | 0 | 24 | 0 |
| B | 0 | 24 | 0 |
| C | 0 | 24 | 0 |
| D | 0 | 25 | 0 |
| Mode SS | |||
|---|---|---|---|
| Quadrant | BADHDUFLAG | Total packets | Discarded packets |
| A | 0 | 132 | 0 |
| B | 0 | 132 | 0 |
| C | 0 | 132 | 0 |
| D | 0 | 132 | 0 |
| Mode M0 | |||
|---|---|---|---|
| Quadrant | BADHDUFLAG | Total packets | Discarded packets |
| A | 0 | 17766 | 3 |
| B | 0 | 14254 | 2 |
| C | 0 | 14665 | 2 |
| D | 0 | 13601 | 2 |
| Quadrant | Total seconds | Saturated seconds | Saturation percentage |
|---|---|---|---|
| A | 6530 | 493 | 7.549770% |
| B | 6530 | 57 | 0.872894% |
| C | 6530 | 49 | 0.750383% |
| D | 6530 | 12 | 0.183767% |
Noise dominated data is calculated using 1-second bins in cleaned event files. If a bin has >2000 counts, and if more than 50% of those come from <1% of pixels, then it is considered to be noise-dominated and hence unusable.
| Quadrant | # 1 sec bins | Bins with >0 counts | Bins with >2000 counts | High rate bins dominated by noise | Noise dominated (total time) | Noise dominated (detector-on time) | Marked lightcurve |
|---|---|---|---|---|---|---|---|
| A | 7846 | 6531 | 382 | 382 | 4.87% | 5.85% | 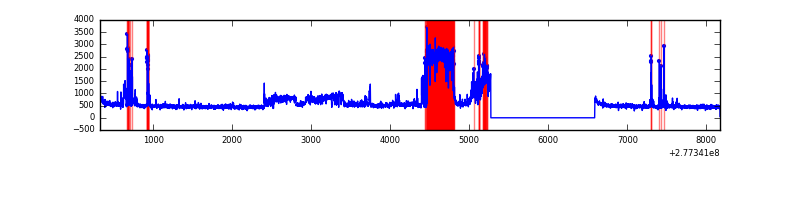 |
| B | 7846 | 6532 | 12 | 12 | 0.15% | 0.18% | 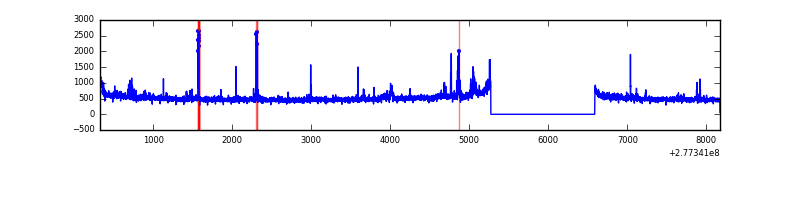 |
| C | 7846 | 6532 | 0 | 0 | 0.00% | 0.00% | 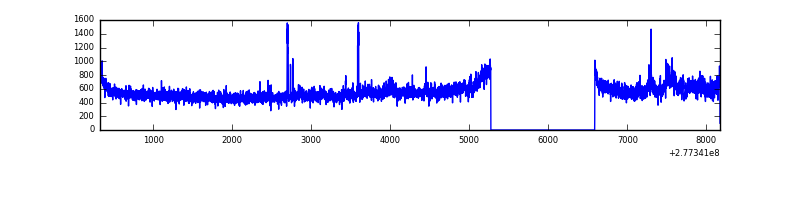 |
| D | 7846 | 6532 | 6 | 6 | 0.08% | 0.09% | 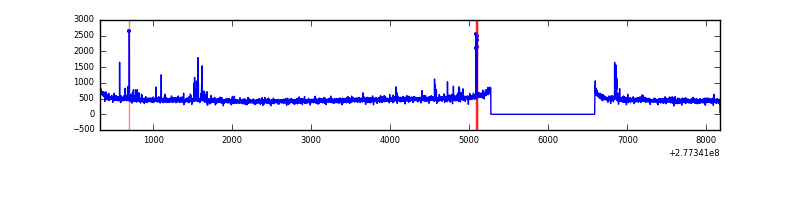 |
Top three noisy pixels from each quadrant. If the there are fewer than three noisy pixels in the level2.evt file, extra rows are filled as -1
| Pixel properties | Quadrant properties | ||||||
|---|---|---|---|---|---|---|---|
| Quadrant | DetID | PixID | Counts | Sigma | Mean | Median | Sigma |
| A | 15 | 174 | 1583682 | 10182.72 | 774 | 760 | 155.5 |
| A | 0 | 226 | 6594 | 37.53 | 774 | 760 | 155.5 |
| A | 12 | 194 | 5634 | 31.35 | 774 | 760 | 155.5 |
| B | 4 | 173 | 54210 | 346.46 | 820 | 802 | 154.2 |
| B | 15 | 35 | 47553 | 303.28 | 820 | 802 | 154.2 |
| B | 0 | 198 | 32798 | 207.56 | 820 | 802 | 154.2 |
| C | 3 | 233 | 376479 | 2048.21 | 791 | 796 | 183.4 |
| C | 14 | 238 | 122732 | 664.79 | 791 | 796 | 183.4 |
| C | 7 | 247 | 18947 | 98.96 | 791 | 796 | 183.4 |
| D | 10 | 70 | 36589 | 186.44 | 791 | 769 | 192.1 |
| D | 2 | 234 | 27461 | 138.93 | 791 | 769 | 192.1 |
| D | 12 | 218 | 25992 | 131.28 | 791 | 769 | 192.1 |
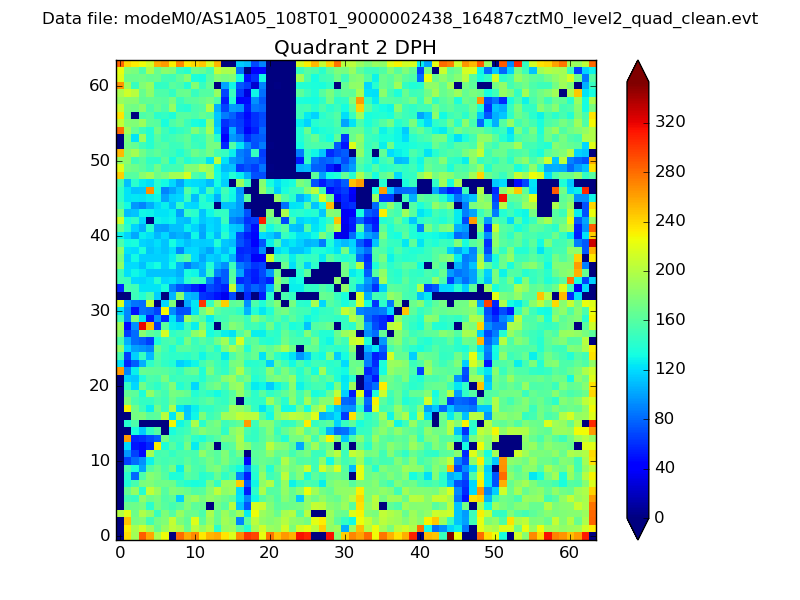
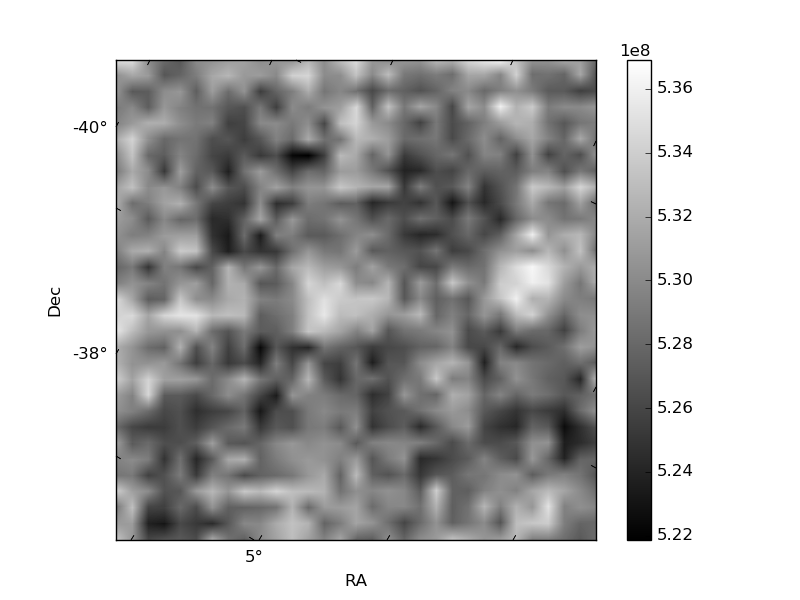
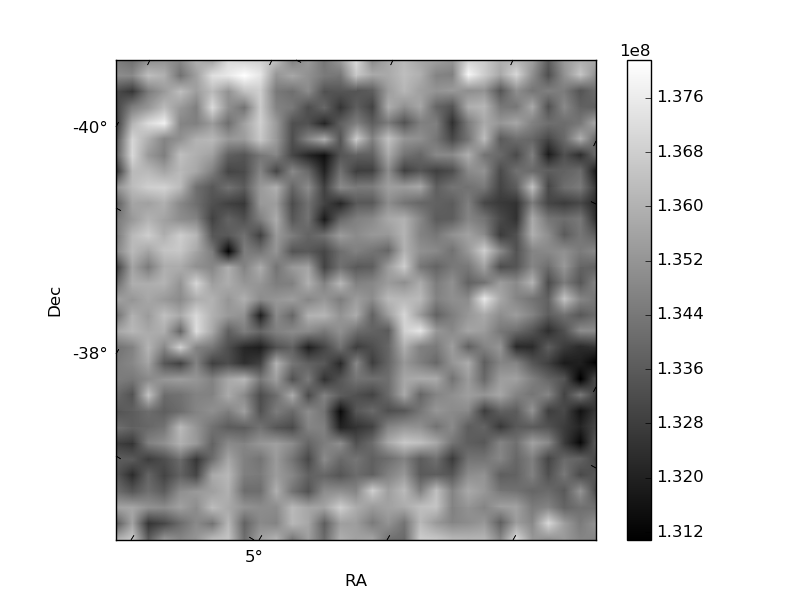
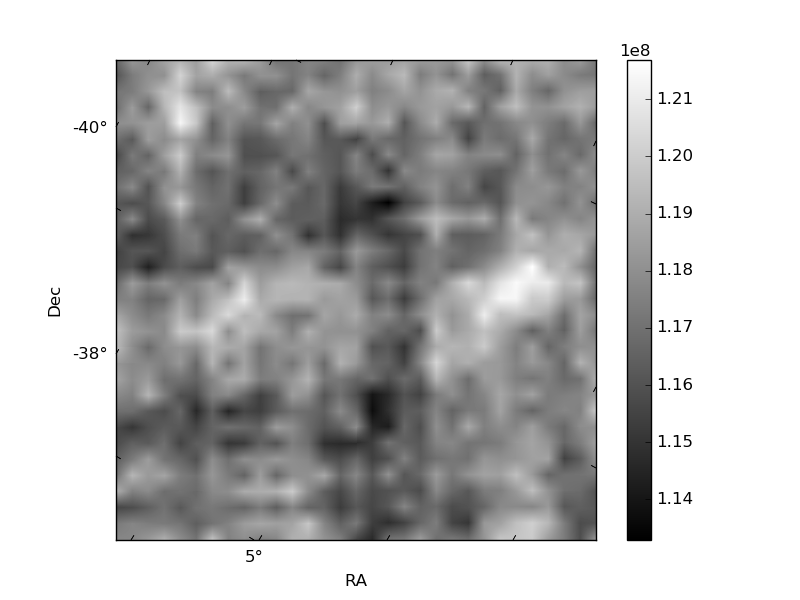
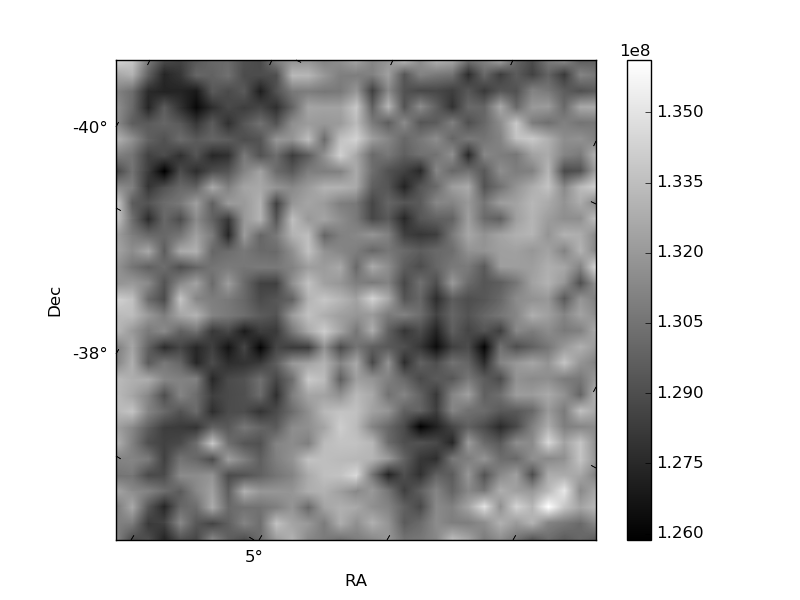
Histogram calculated using DETX and DETY for each event in the final _common_clean file
| Quadrant A | 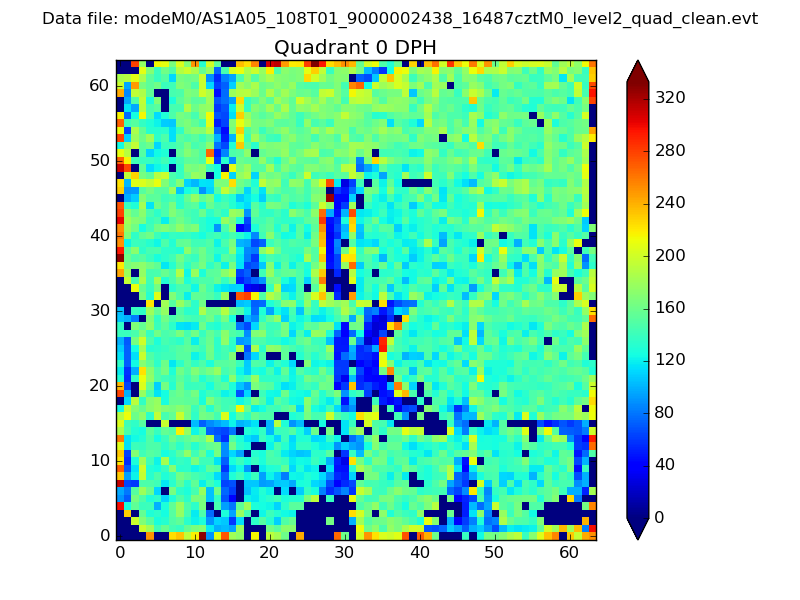 |
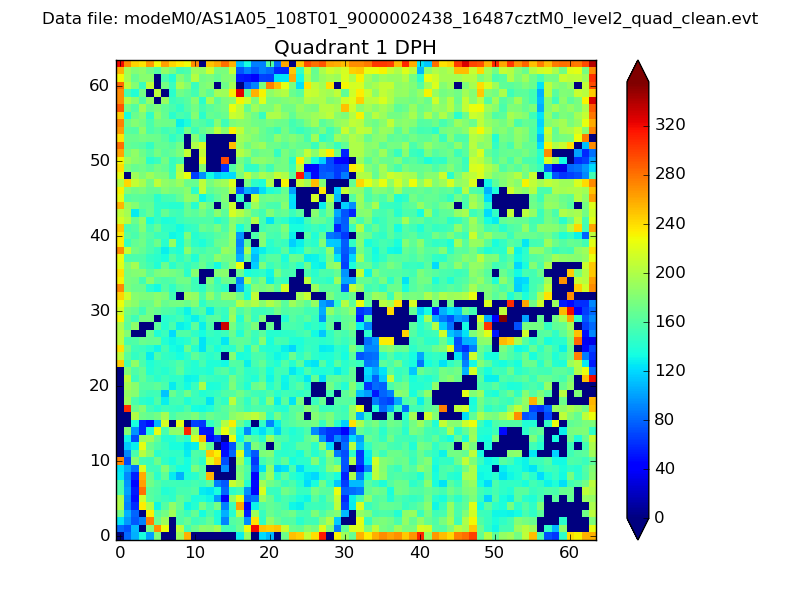 |
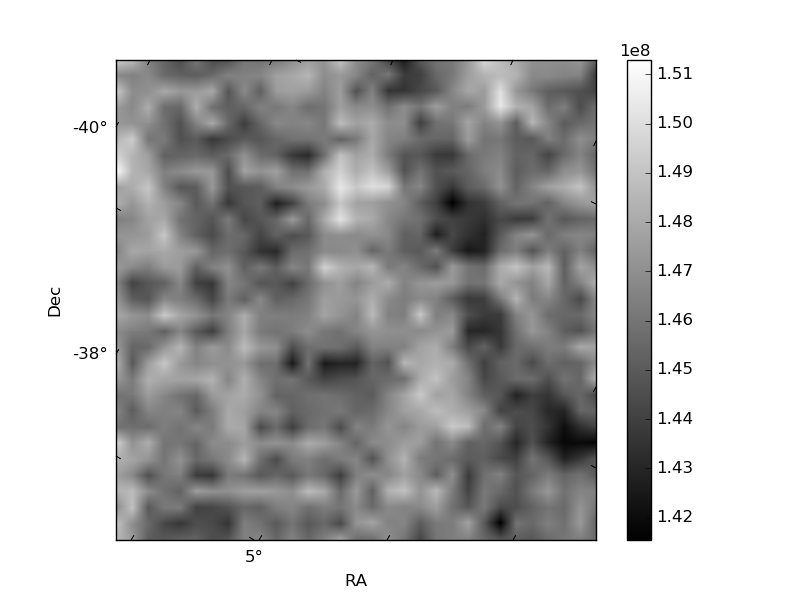
Quadrant B |
|---|---|---|---|
| Quadrant D | 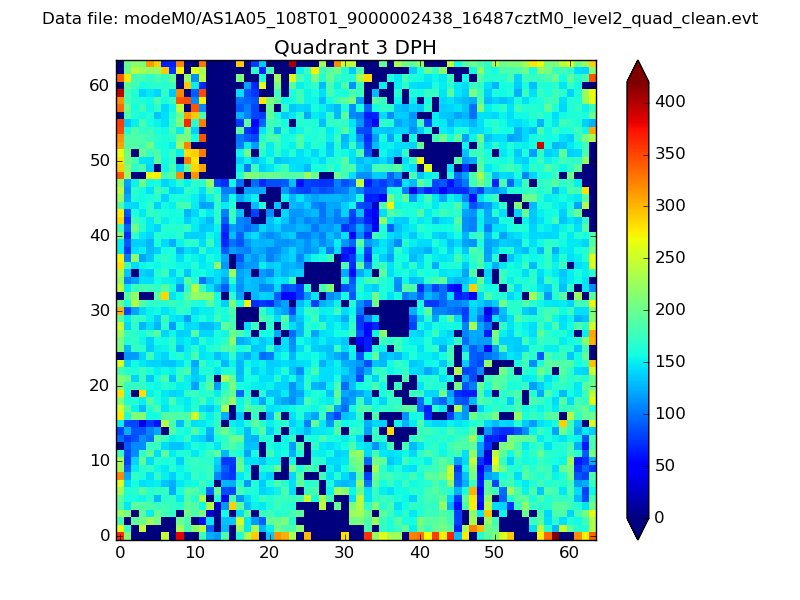 |
 |
Quadrant C |
| Plot type | Count rate plots | Images |
|---|---|---|
| Comparison with Poisson distribution Blue bars denote a histogram of data divided into 1 sec bins. Red curve is a Poisson curve with rate = median count rate of data. |
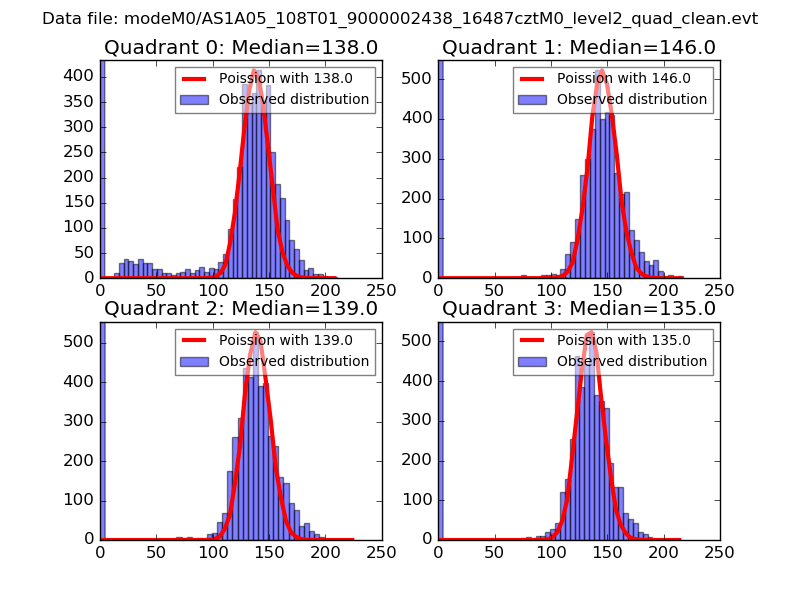 |
 |
| Quadrant-wise count rates Data is divided into 100 sec bins |
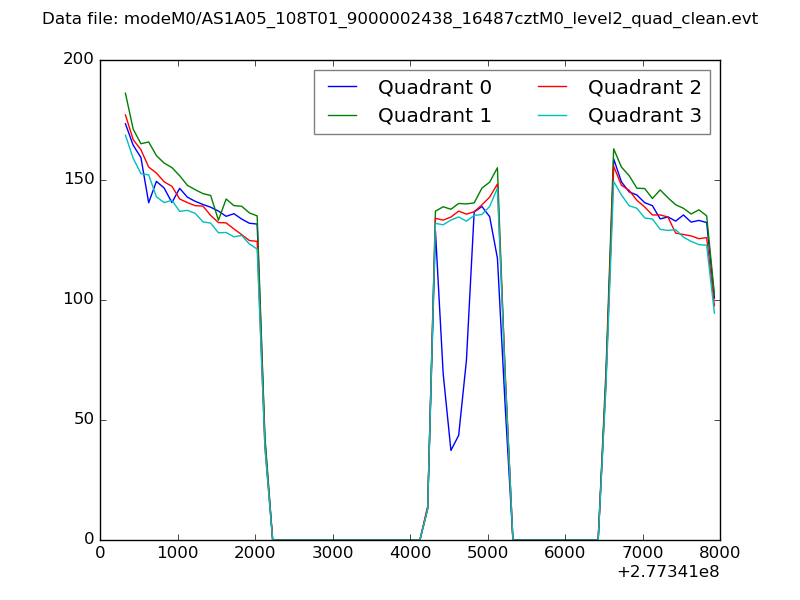 |
|
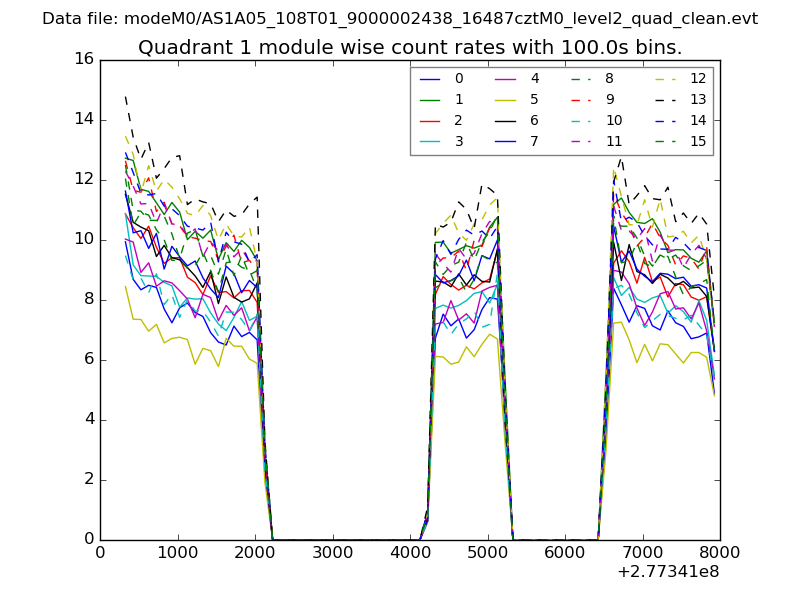
| Module-wise count rates for Quadrant A Data is divided into 100 sec bins |
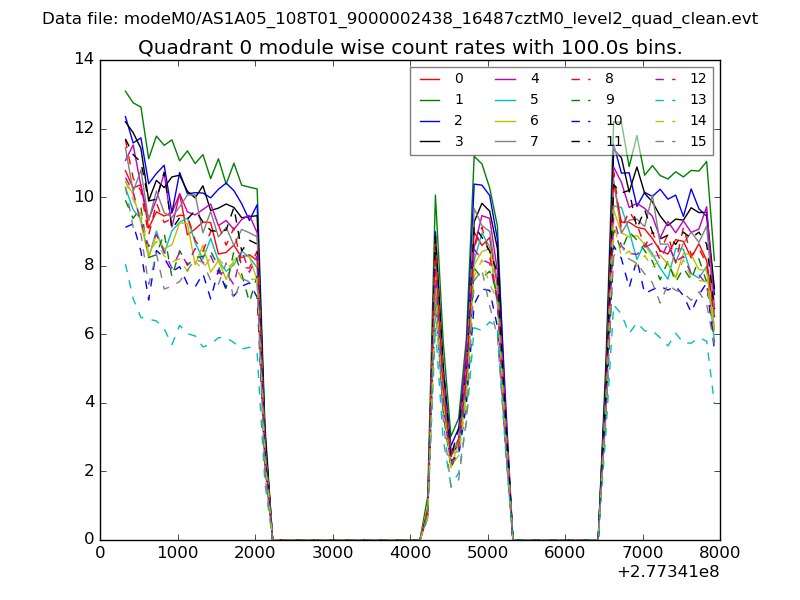 |
 |
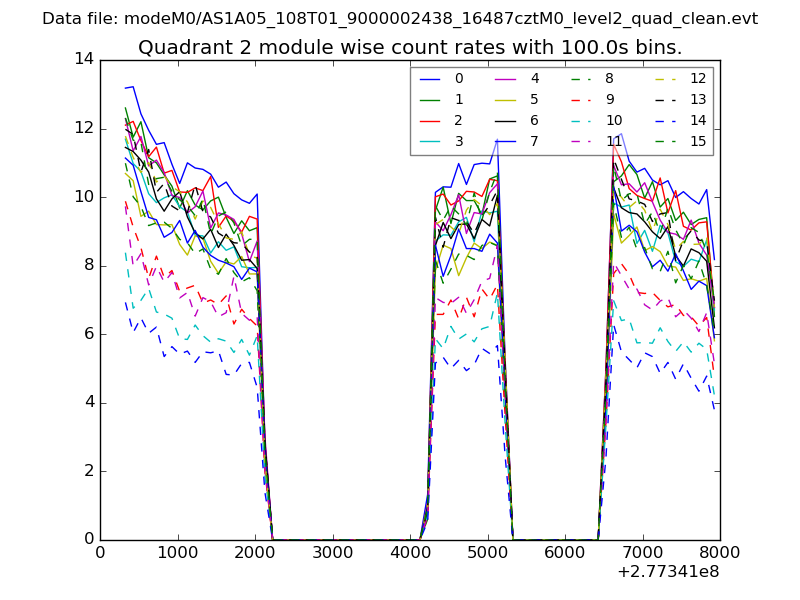
| Module-wise count rates for Quadrant B Data is divided into 100 sec bins |
 |
 |
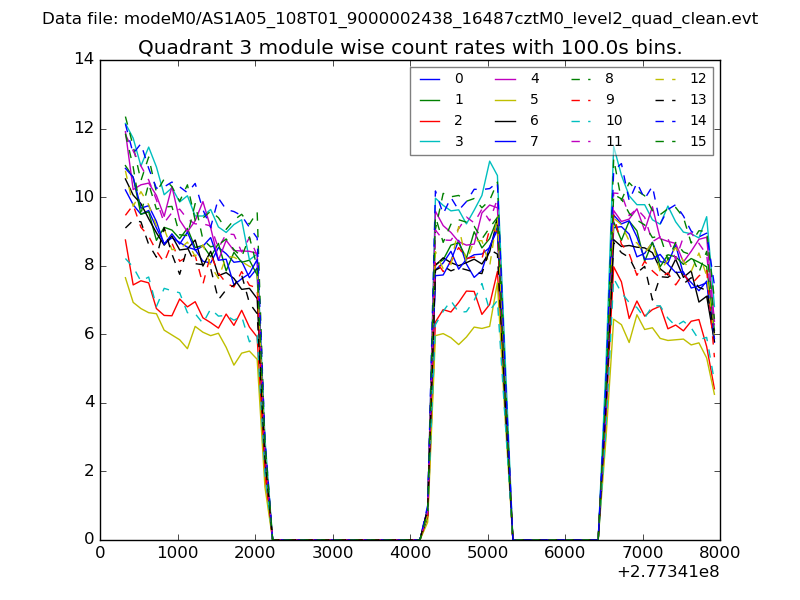
| Module-wise count rates for Quadrant C Data is divided into 100 sec bins |
 |
 |
| Module-wise count rates for Quadrant D Data is divided into 100 sec bins |
 |
 |
| Parameter | Plot |
|---|---|
| CZT HV Monitor | 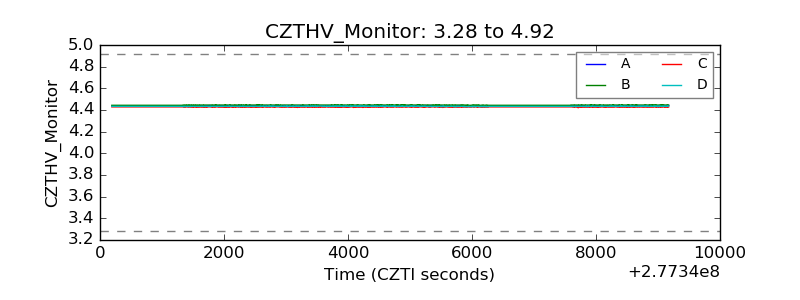 |
| D_VDD | 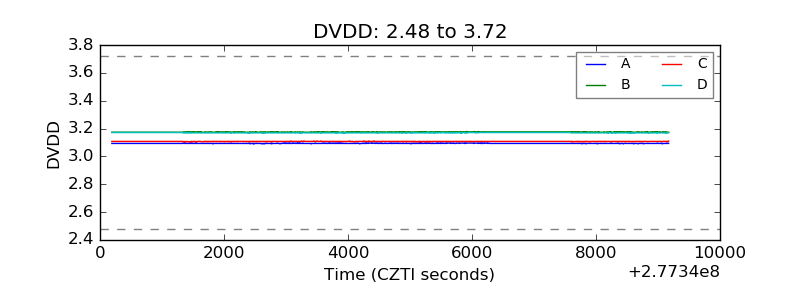 |
| Temperature 1 | 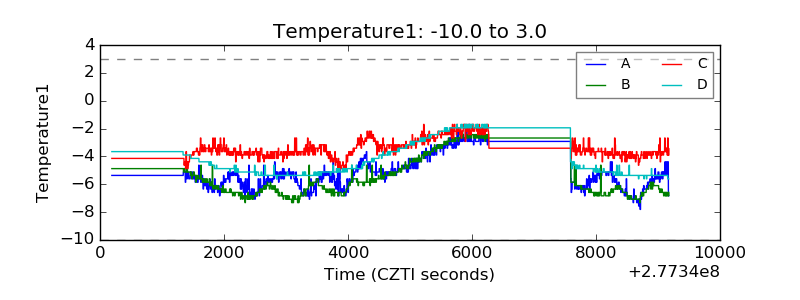 |
| Veto HV Monitor | 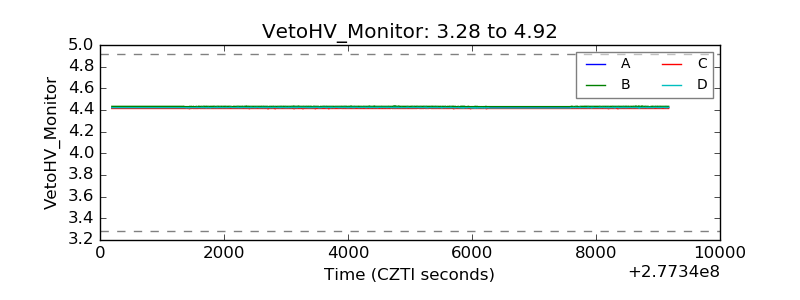 |
| Veto LLD | 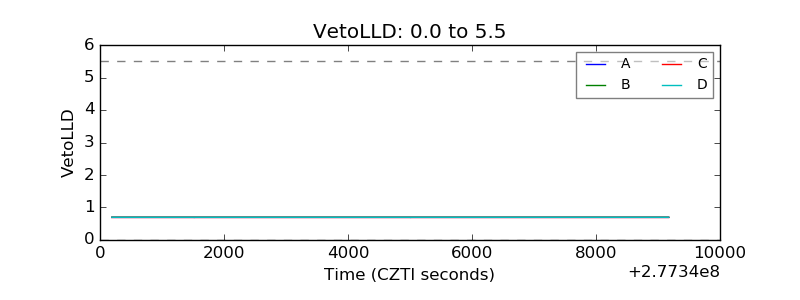 |
| Alpha Counter | 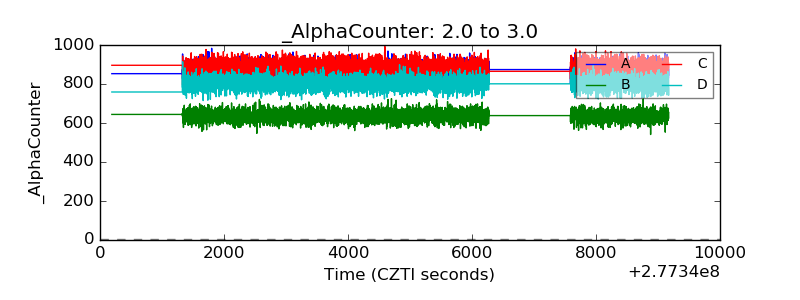 |
| _CPM_Rate | 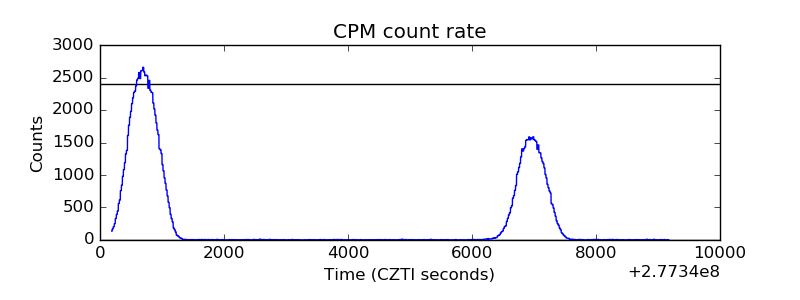 |
| CZT Counter | 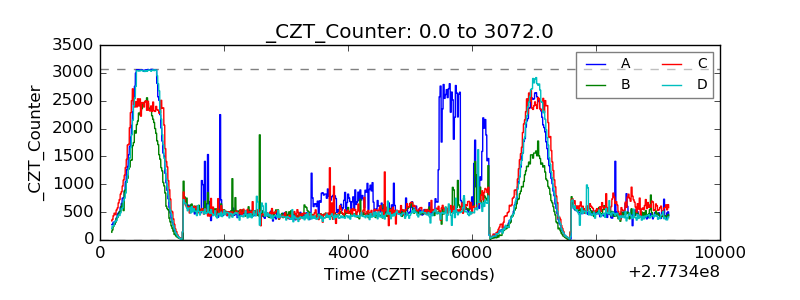 |
| +2.5 Volts monitor |  |
| +5 Volts monitor | 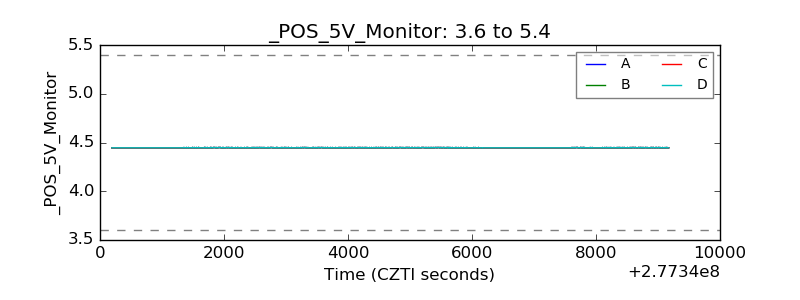 |
| _ROLL_ROT | 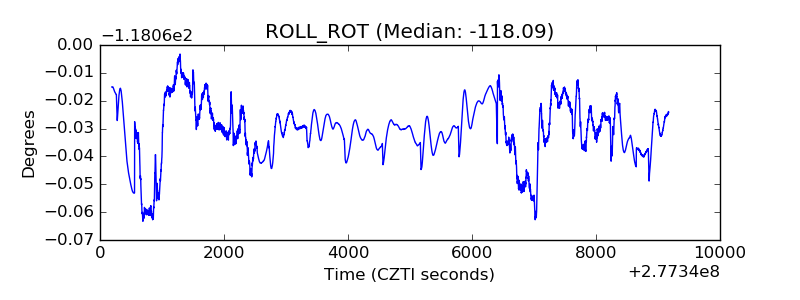 |
| _Roll_DEC | 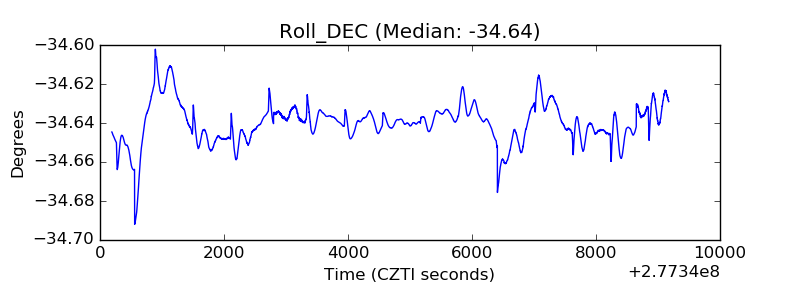 |
| _Roll_RA | 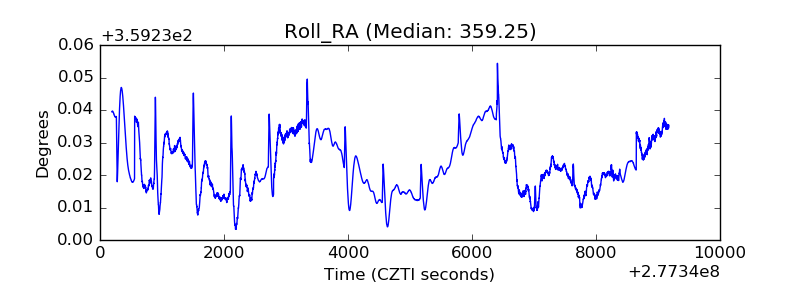 |
| Veto Counter | 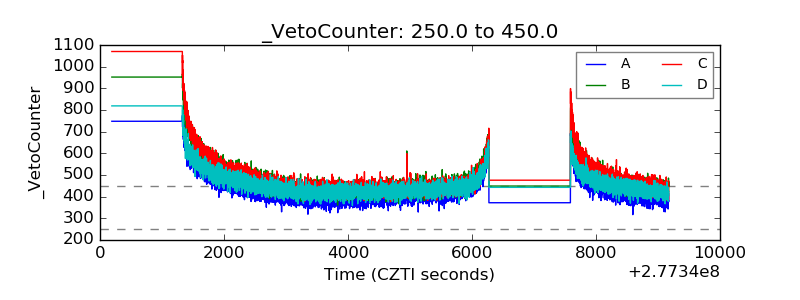 |