| Param | Original file | Final file |
|---|---|---|
| Filename | modeM0/AS1A05_108T01_9000002438_16489cztM0_level2.evt | modeM0/AS1A05_108T01_9000002438_16489cztM0_level2_quad_clean.evt |
| Size (bytes) | 558,103,680 | 86,901,120 |
| Size | 532.2 MB | 82.9 MB |
| Events in quadrant A | 5,518,479 | 492,108 |
| Events in quadrant B | 3,913,343 | 565,875 |
| Events in quadrant C | 3,504,749 | 546,098 |
| Events in quadrant D | 3,485,404 | 534,257 |
| Mode M9 | |||
|---|---|---|---|
| Quadrant | BADHDUFLAG | Total packets | Discarded packets |
| A | 0 | 19 | 0 |
| B | 0 | 19 | 0 |
| C | 0 | 19 | 0 |
| D | 0 | 19 | 0 |
| Mode SS | |||
|---|---|---|---|
| Quadrant | BADHDUFLAG | Total packets | Discarded packets |
| A | 0 | 146 | 0 |
| B | 0 | 146 | 0 |
| C | 0 | 146 | 0 |
| D | 0 | 146 | 0 |
| Mode M0 | |||
|---|---|---|---|
| Quadrant | BADHDUFLAG | Total packets | Discarded packets |
| A | 0 | 21254 | 3 |
| B | 0 | 16195 | 2 |
| C | 0 | 14708 | 2 |
| D | 0 | 15179 | 2 |
| Quadrant | Total seconds | Saturated seconds | Saturation percentage |
|---|---|---|---|
| A | 7077 | 849 | 11.996609% |
| B | 7077 | 109 | 1.540201% |
| C | 7077 | 72 | 1.017380% |
| D | 7077 | 38 | 0.536951% |
Noise dominated data is calculated using 1-second bins in cleaned event files. If a bin has >2000 counts, and if more than 50% of those come from <1% of pixels, then it is considered to be noise-dominated and hence unusable.
| Quadrant | # 1 sec bins | Bins with >0 counts | Bins with >2000 counts | High rate bins dominated by noise | Noise dominated (total time) | Noise dominated (detector-on time) | Marked lightcurve |
|---|---|---|---|---|---|---|---|
| A | 9033 | 7079 | 778 | 778 | 8.61% | 10.99% | 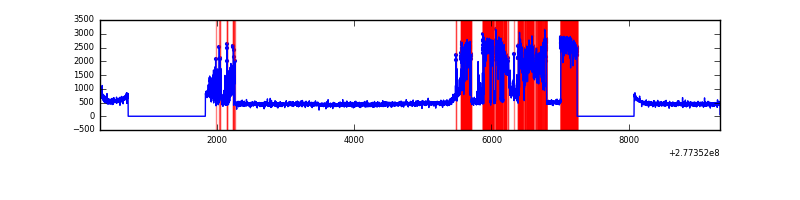 |
| B | 9033 | 7080 | 21 | 21 | 0.23% | 0.30% | 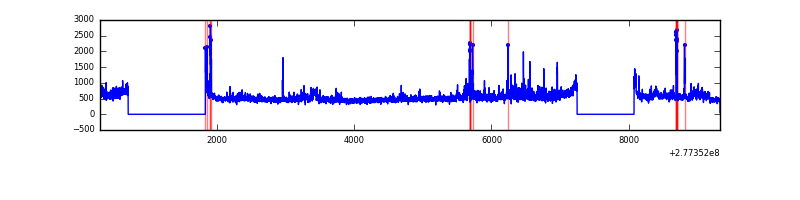 |
| C | 9033 | 7079 | 0 | 0 | 0.00% | 0.00% | 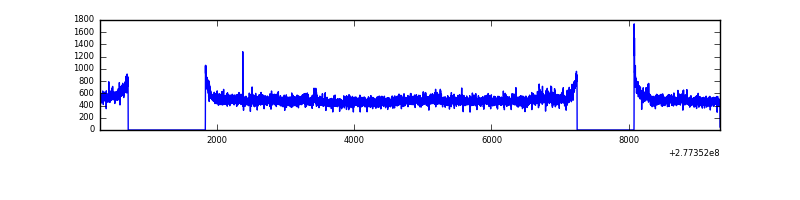 |
| D | 9033 | 7080 | 17 | 17 | 0.19% | 0.24% | 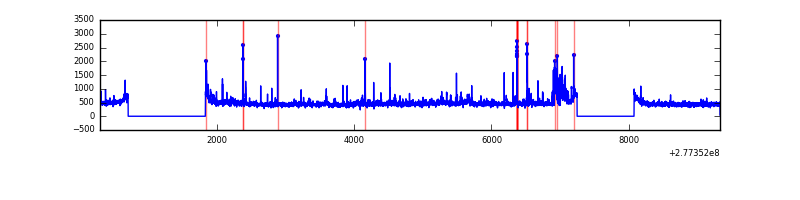 |
Top three noisy pixels from each quadrant. If the there are fewer than three noisy pixels in the level2.evt file, extra rows are filled as -1
| Pixel properties | Quadrant properties | ||||||
|---|---|---|---|---|---|---|---|
| Quadrant | DetID | PixID | Counts | Sigma | Mean | Median | Sigma |
| A | 15 | 174 | 2448283 | 15139.47 | 798 | 780 | 161.7 |
| A | 0 | 226 | 6964 | 38.25 | 798 | 780 | 161.7 |
| A | 3 | 137 | 5867 | 31.46 | 798 | 780 | 161.7 |
| B | 5 | 65 | 323369 | 1956.3 | 857 | 837 | 164.9 |
| B | 4 | 48 | 80198 | 481.36 | 857 | 837 | 164.9 |
| B | 0 | 189 | 38314 | 227.31 | 857 | 837 | 164.9 |
| C | 3 | 233 | 129356 | 668.91 | 824 | 830 | 192.1 |
| C | 14 | 238 | 127286 | 658.13 | 824 | 830 | 192.1 |
| C | 7 | 247 | 33629 | 170.7 | 824 | 830 | 192.1 |
| D | 5 | 222 | 160399 | 793.63 | 828 | 805 | 201.1 |
| D | 13 | 168 | 127846 | 631.75 | 828 | 805 | 201.1 |
| D | 2 | 234 | 21563 | 103.23 | 828 | 805 | 201.1 |
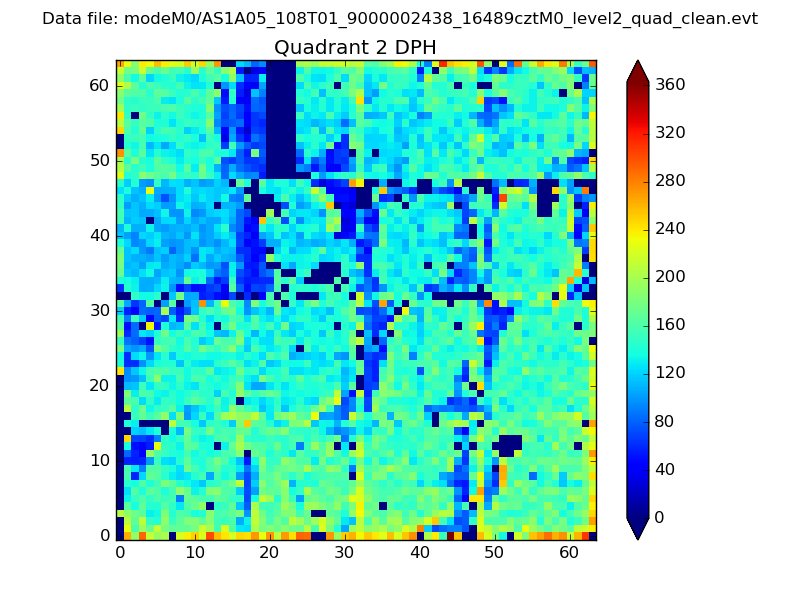
Histogram calculated using DETX and DETY for each event in the final _common_clean file
| Quadrant A | 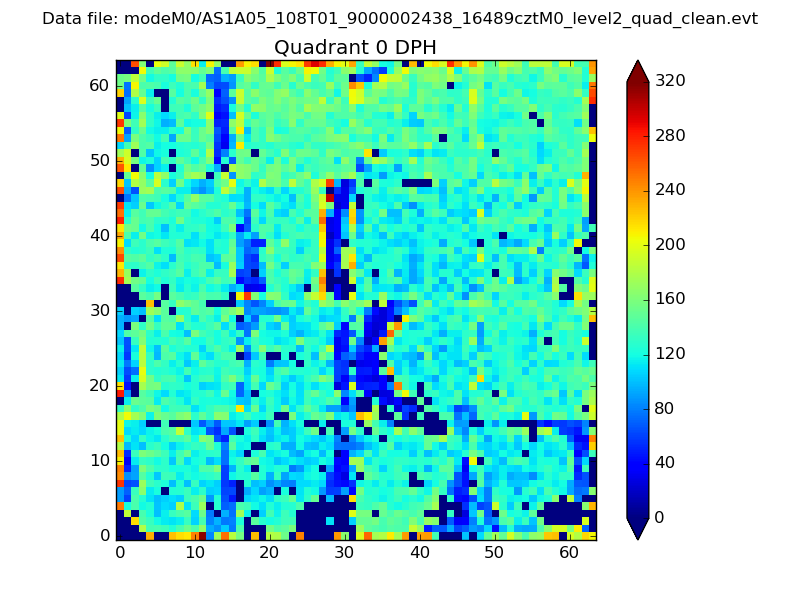 |
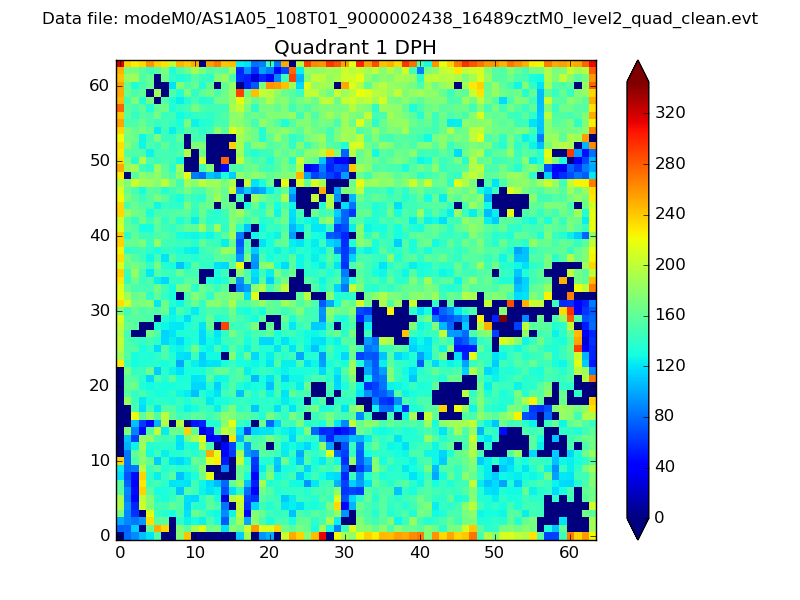 |
Quadrant B |
|---|---|---|---|
| Quadrant D | 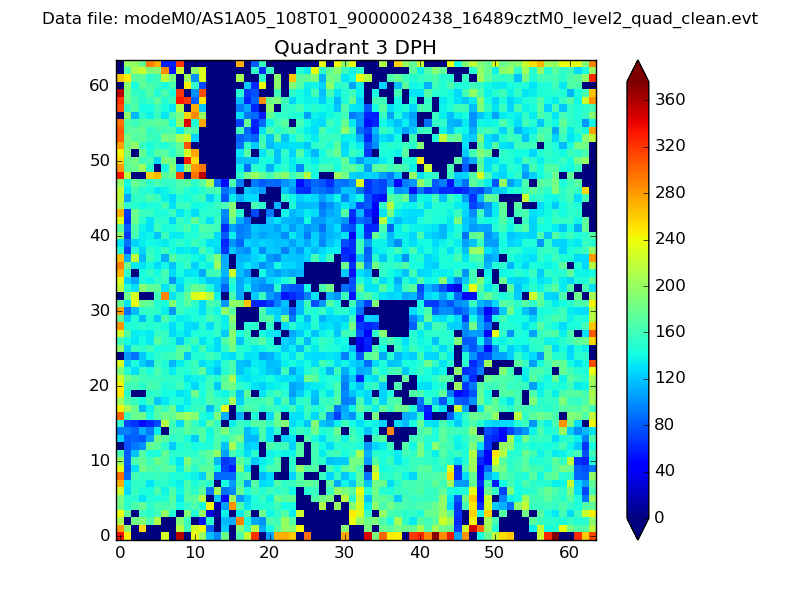 |
 |
Quadrant C |
| Plot type | Count rate plots | Images |
|---|---|---|
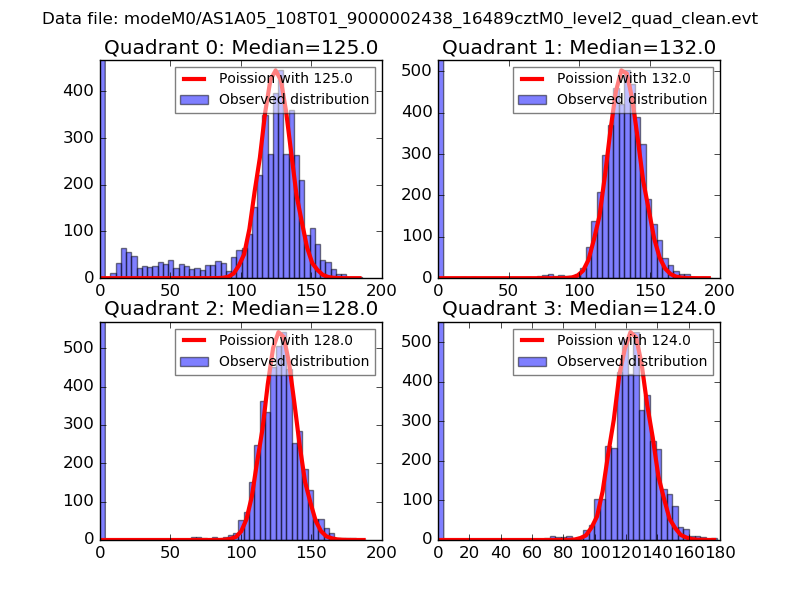
| Comparison with Poisson distribution Blue bars denote a histogram of data divided into 1 sec bins. Red curve is a Poisson curve with rate = median count rate of data. |
 |
 |
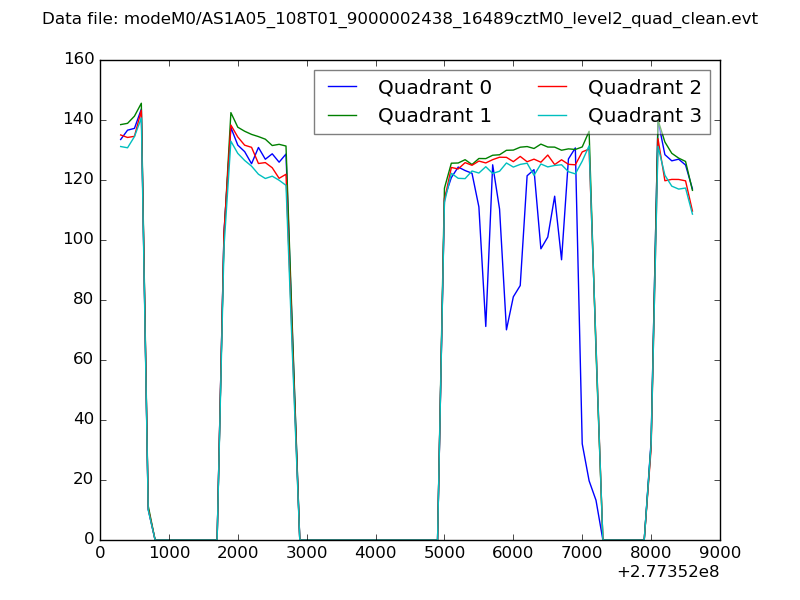
| Quadrant-wise count rates Data is divided into 100 sec bins |
 |
|
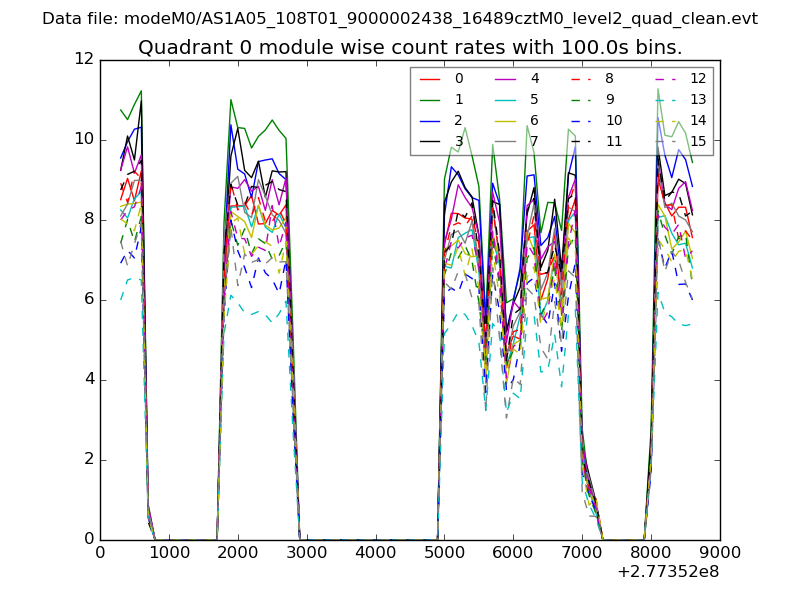
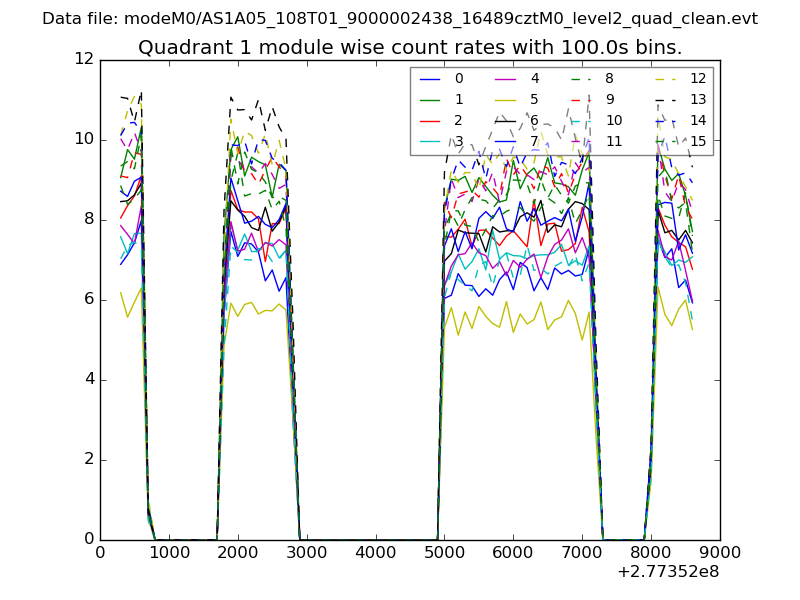
| Module-wise count rates for Quadrant A Data is divided into 100 sec bins |
 |
 |
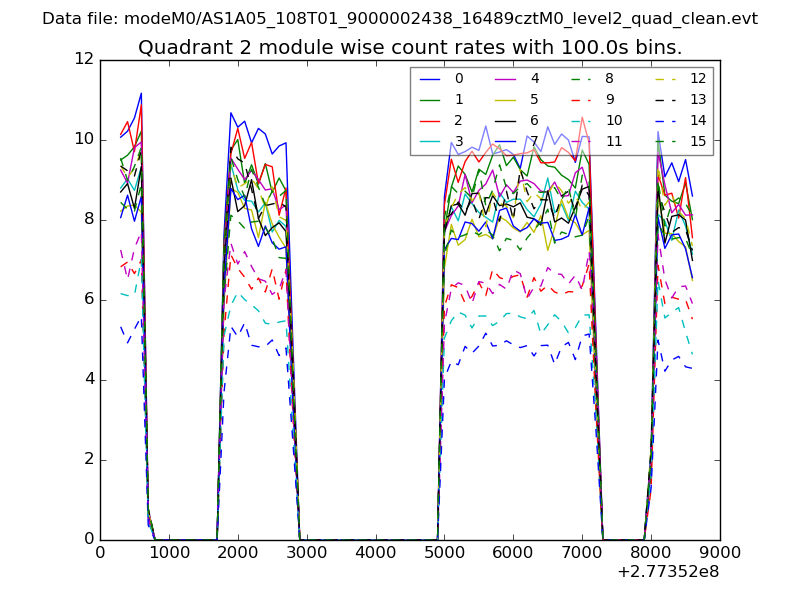
| Module-wise count rates for Quadrant B Data is divided into 100 sec bins |
 |
 |
| Module-wise count rates for Quadrant C Data is divided into 100 sec bins |
 |
 |
| Module-wise count rates for Quadrant D Data is divided into 100 sec bins |
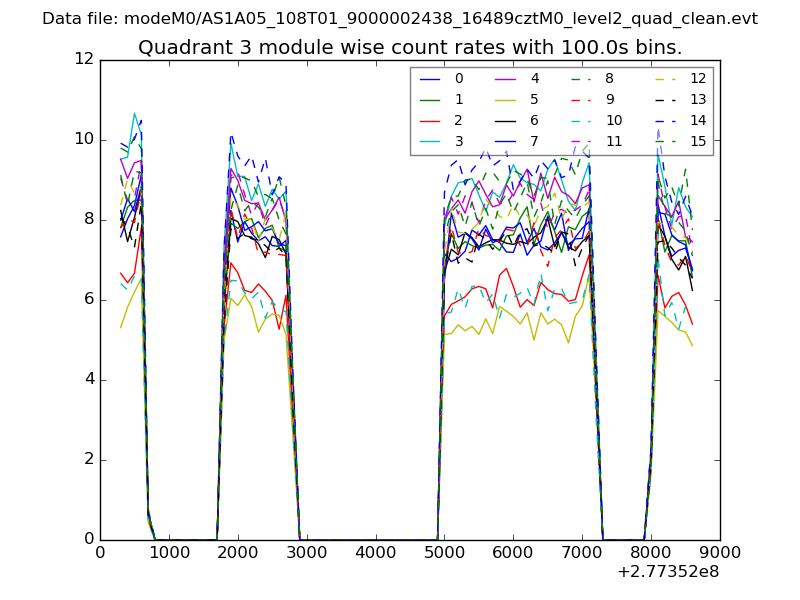 |
 |
| Parameter | Plot |
|---|---|
| CZT HV Monitor | 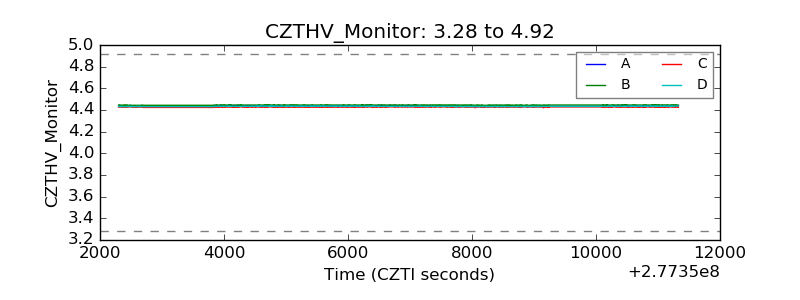 |
| D_VDD | 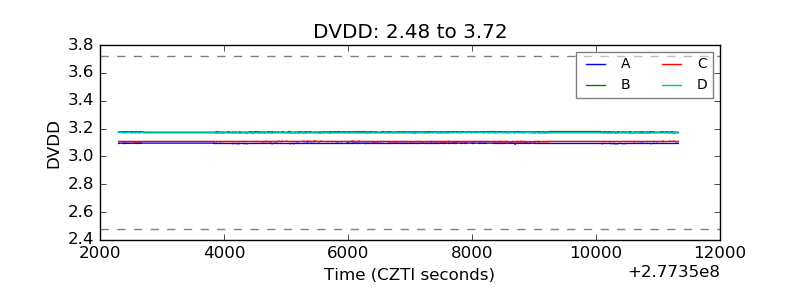 |
| Temperature 1 | 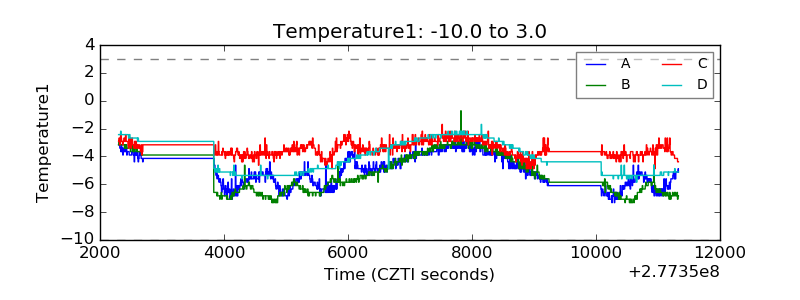 |
| Veto HV Monitor |  |
| Veto LLD | 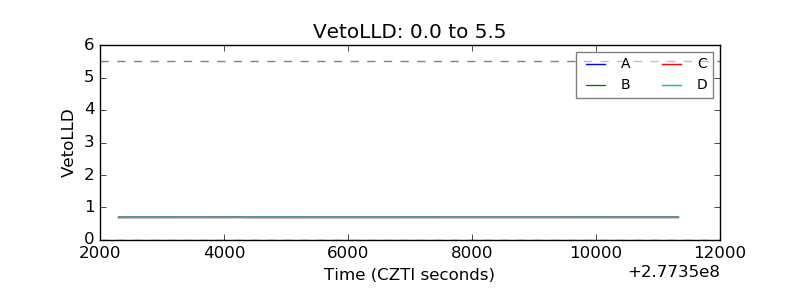 |
| Alpha Counter |  |
| _CPM_Rate |  |
| CZT Counter | 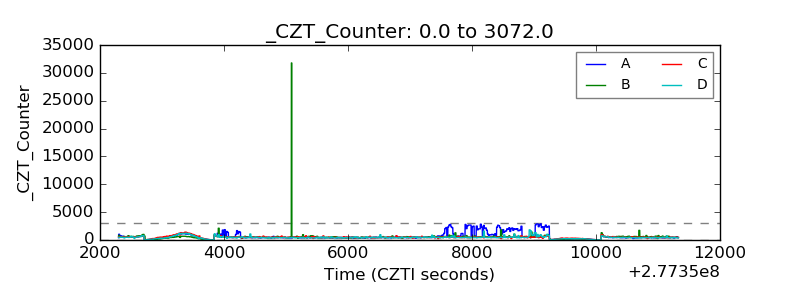 |
| +2.5 Volts monitor | 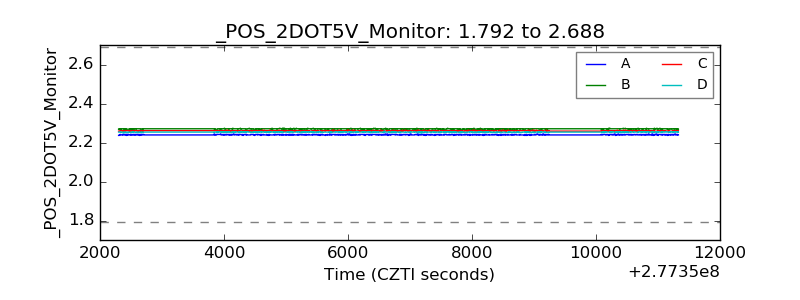 |
| +5 Volts monitor |  |
| _ROLL_ROT | 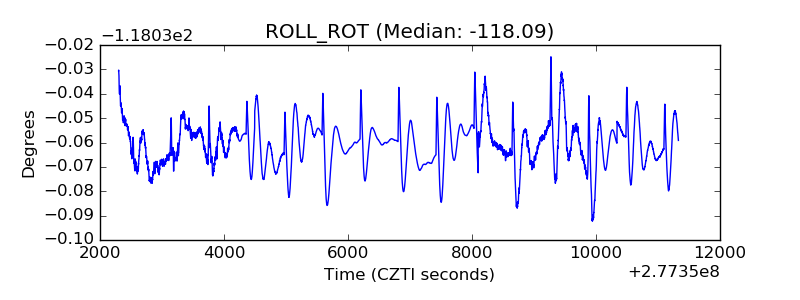 |
| _Roll_DEC | 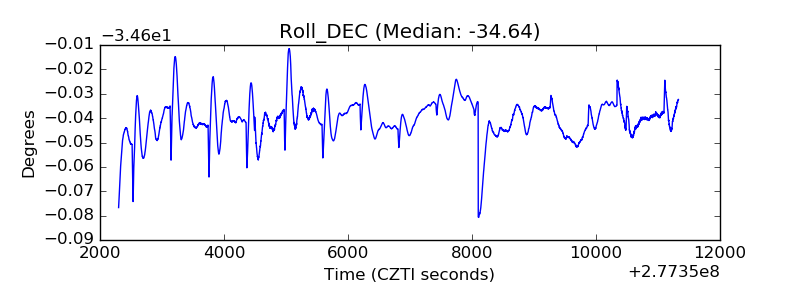 |
| _Roll_RA | 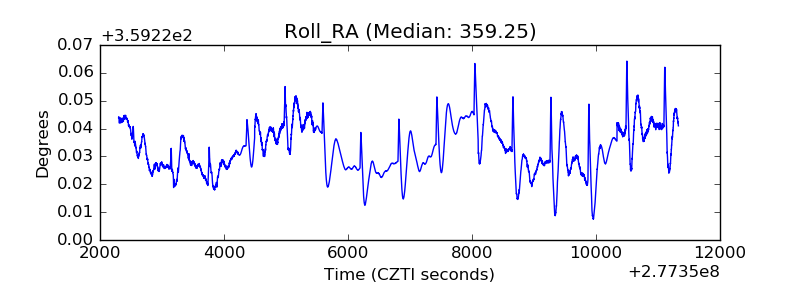 |
| Veto Counter |  |