| Param | Original file | Final file |
|---|---|---|
| Filename | modeM0/AS1A05_108T01_9000002438_16491cztM0_level2.evt | modeM0/AS1A05_108T01_9000002438_16491cztM0_level2_quad_clean.evt |
| Size (bytes) | 416,154,240 | 61,502,400 |
| Size | 396.9 MB | 58.7 MB |
| Events in quadrant A | 3,828,740 | 358,078 |
| Events in quadrant B | 2,617,283 | 389,687 |
| Events in quadrant C | 2,912,832 | 376,024 |
| Events in quadrant D | 2,884,896 | 367,984 |
| Mode M9 | |||
|---|---|---|---|
| Quadrant | BADHDUFLAG | Total packets | Discarded packets |
| A | 0 | 4 | 0 |
| B | 0 | 4 | 0 |
| C | 0 | 4 | 0 |
| D | 0 | 4 | 0 |
| Mode SS | |||
|---|---|---|---|
| Quadrant | BADHDUFLAG | Total packets | Discarded packets |
| A | 0 | 108 | 0 |
| B | 0 | 108 | 0 |
| C | 0 | 108 | 0 |
| D | 0 | 108 | 0 |
| Mode M0 | |||
|---|---|---|---|
| Quadrant | BADHDUFLAG | Total packets | Discarded packets |
| A | 0 | 15033 | 1 |
| B | 0 | 11213 | 1 |
| C | 0 | 11831 | 1 |
| D | 0 | 12335 | 1 |
| Quadrant | Total seconds | Saturated seconds | Saturation percentage |
|---|---|---|---|
| A | 5281 | 549 | 10.395758% |
| B | 5281 | 124 | 2.348040% |
| C | 5281 | 139 | 2.632077% |
| D | 5281 | 179 | 3.389510% |
Noise dominated data is calculated using 1-second bins in cleaned event files. If a bin has >2000 counts, and if more than 50% of those come from <1% of pixels, then it is considered to be noise-dominated and hence unusable.
| Quadrant | # 1 sec bins | Bins with >0 counts | Bins with >2000 counts | High rate bins dominated by noise | Noise dominated (total time) | Noise dominated (detector-on time) | Marked lightcurve |
|---|---|---|---|---|---|---|---|
| A | 5647 | 5283 | 404 | 404 | 7.15% | 7.65% | 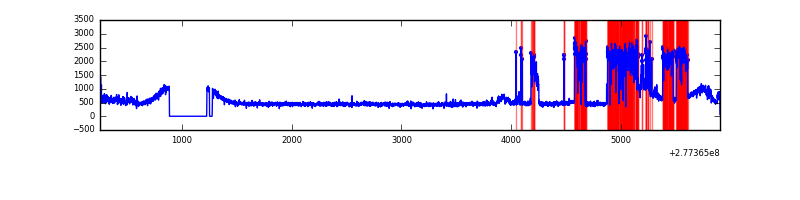 |
| B | 5647 | 5282 | 3 | 3 | 0.05% | 0.06% | 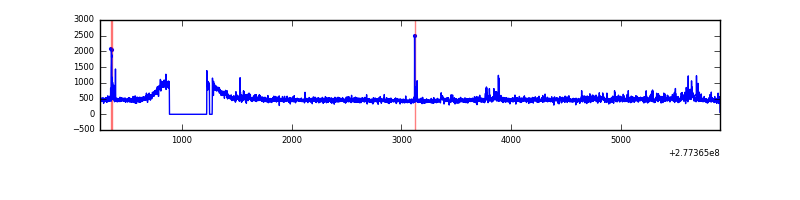 |
| C | 5647 | 5282 | 0 | 0 | 0.00% | 0.00% | 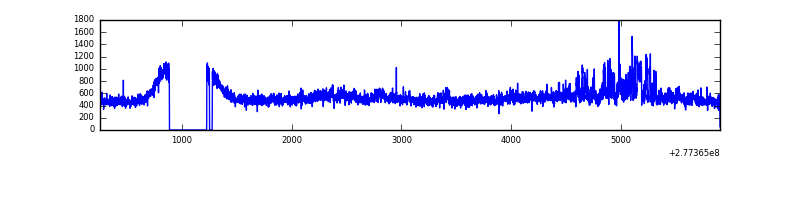 |
| D | 5647 | 5283 | 100 | 100 | 1.77% | 1.89% | 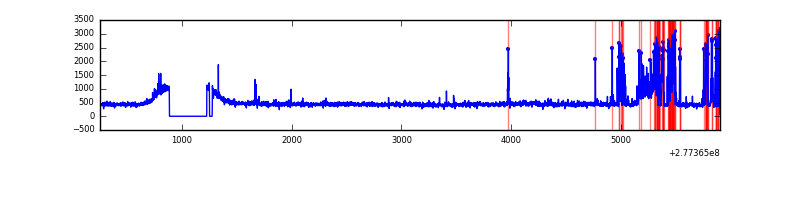 |
Top three noisy pixels from each quadrant. If the there are fewer than three noisy pixels in the level2.evt file, extra rows are filled as -1
| Pixel properties | Quadrant properties | ||||||
|---|---|---|---|---|---|---|---|
| Quadrant | DetID | PixID | Counts | Sigma | Mean | Median | Sigma |
| A | 15 | 174 | 1466885 | 11576.0 | 614 | 600 | 126.7 |
| A | 0 | 226 | 5430 | 38.13 | 614 | 600 | 126.7 |
| A | 3 | 137 | 4583 | 31.44 | 614 | 600 | 126.7 |
| B | 0 | 189 | 74886 | 596.81 | 632 | 616 | 124.4 |
| B | 4 | 48 | 33047 | 260.6 | 632 | 616 | 124.4 |
| B | 12 | 111 | 15011 | 115.67 | 632 | 616 | 124.4 |
| C | 3 | 233 | 434372 | 2993.57 | 611 | 614 | 144.9 |
| C | 14 | 238 | 92466 | 633.91 | 611 | 614 | 144.9 |
| C | 7 | 247 | 6480 | 40.48 | 611 | 614 | 144.9 |
| D | 13 | 248 | 466728 | 3027.5 | 619 | 600 | 154.0 |
| D | 1 | 52 | 48386 | 310.37 | 619 | 600 | 154.0 |
| D | 2 | 234 | 19966 | 125.78 | 619 | 600 | 154.0 |
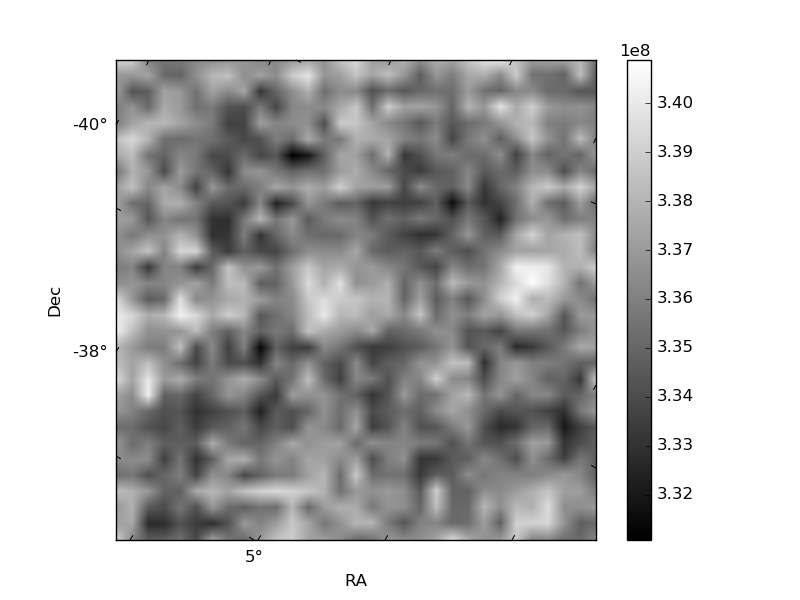
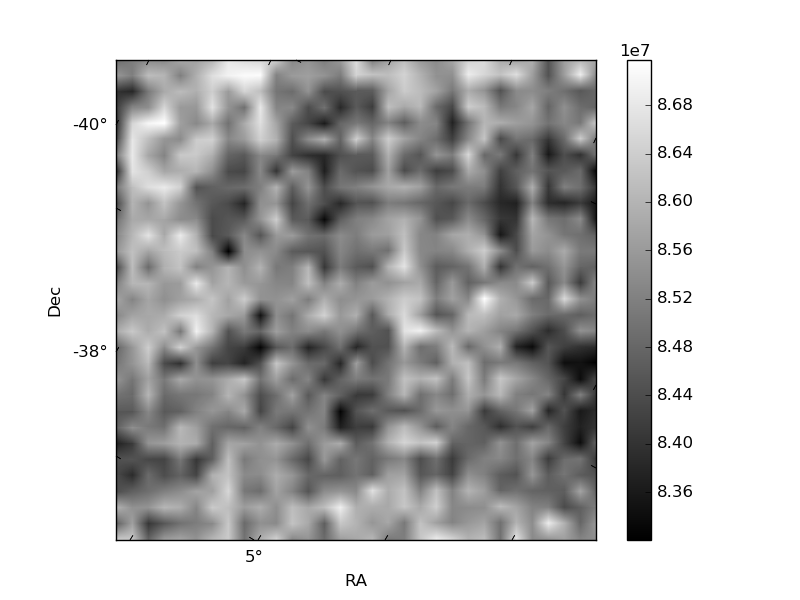
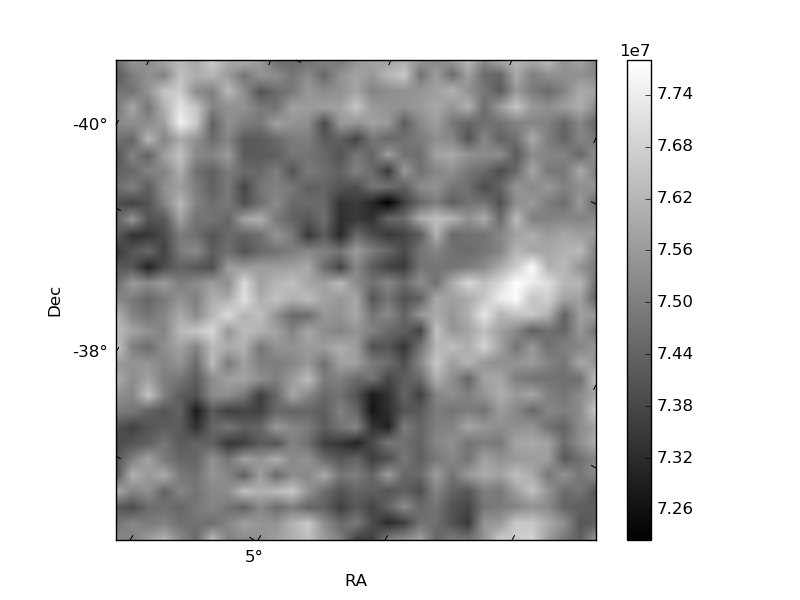
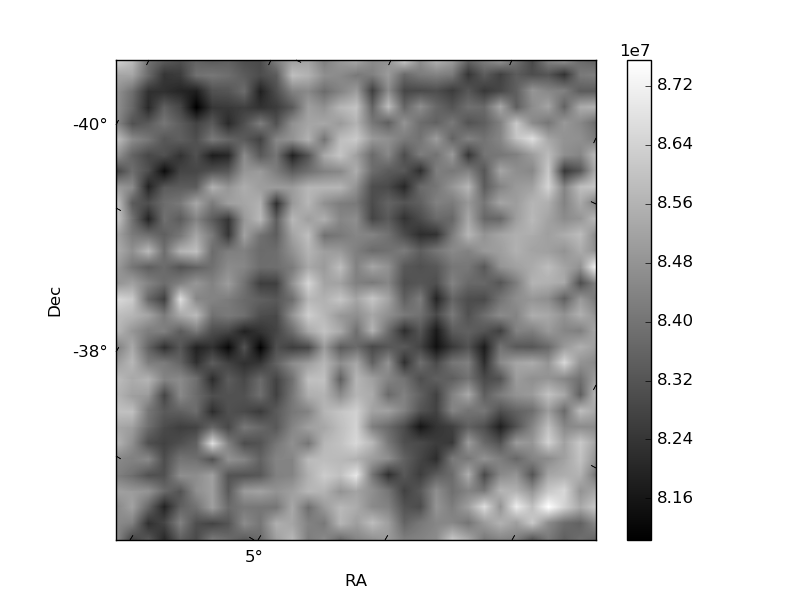
Histogram calculated using DETX and DETY for each event in the final _common_clean file
| Quadrant A | 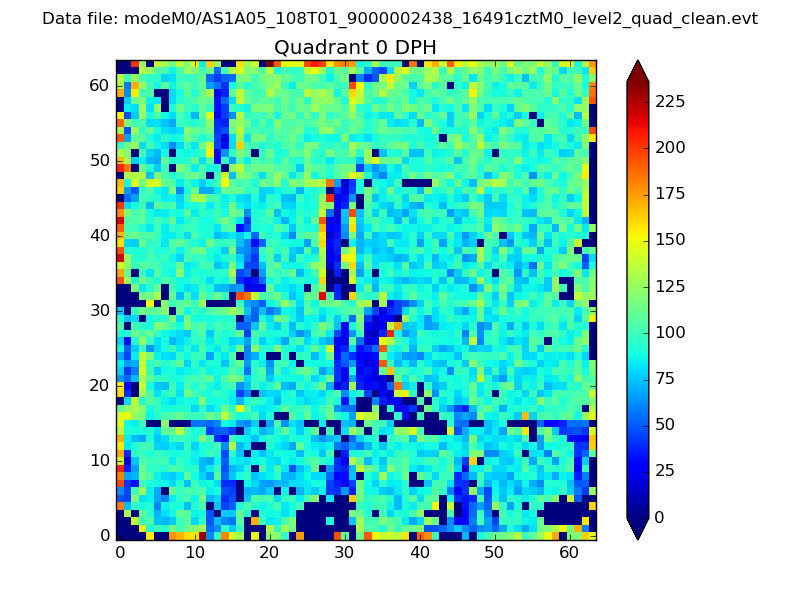 |
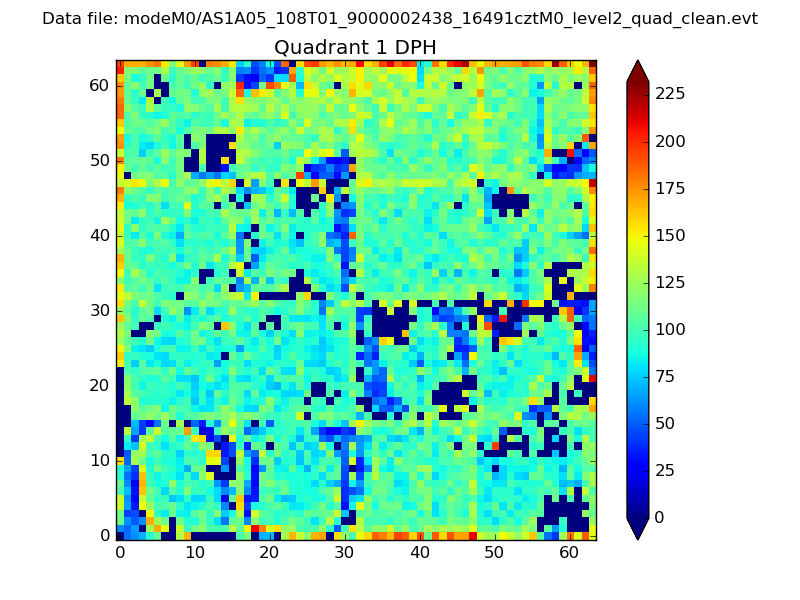 |
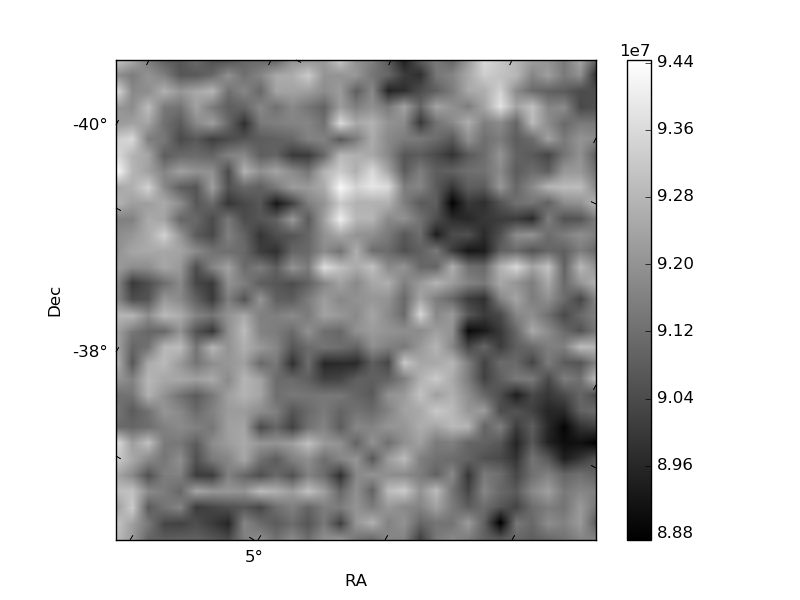
Quadrant B |
|---|---|---|---|
| Quadrant D | 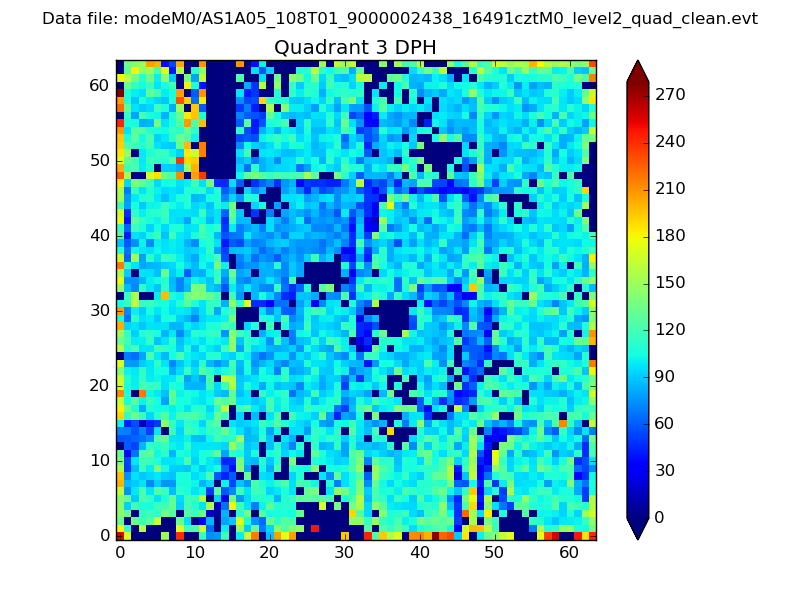 |
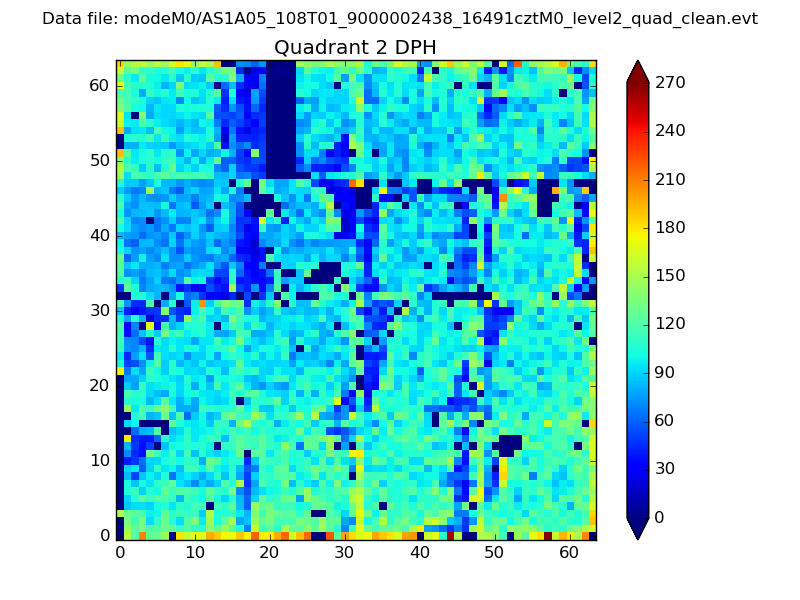 |
Quadrant C |
| Plot type | Count rate plots | Images |
|---|---|---|
| Comparison with Poisson distribution Blue bars denote a histogram of data divided into 1 sec bins. Red curve is a Poisson curve with rate = median count rate of data. |
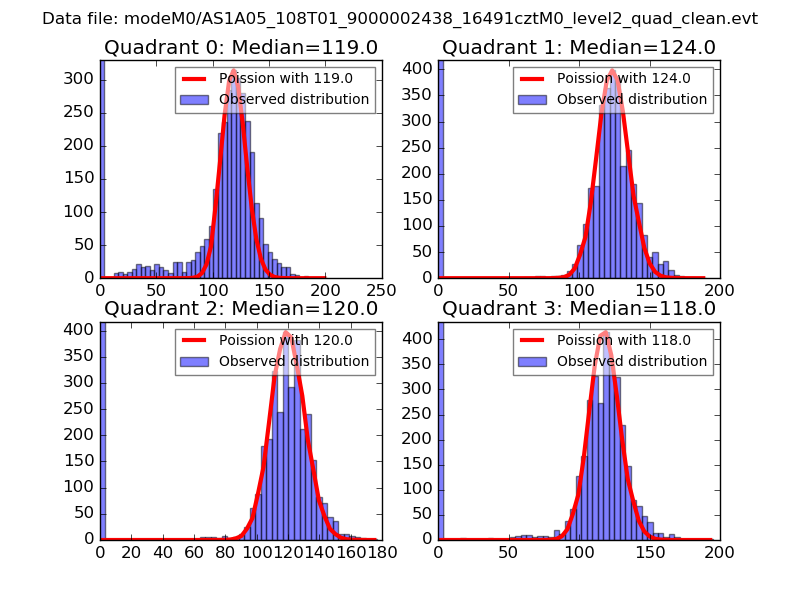 |
 |
| Quadrant-wise count rates Data is divided into 100 sec bins |
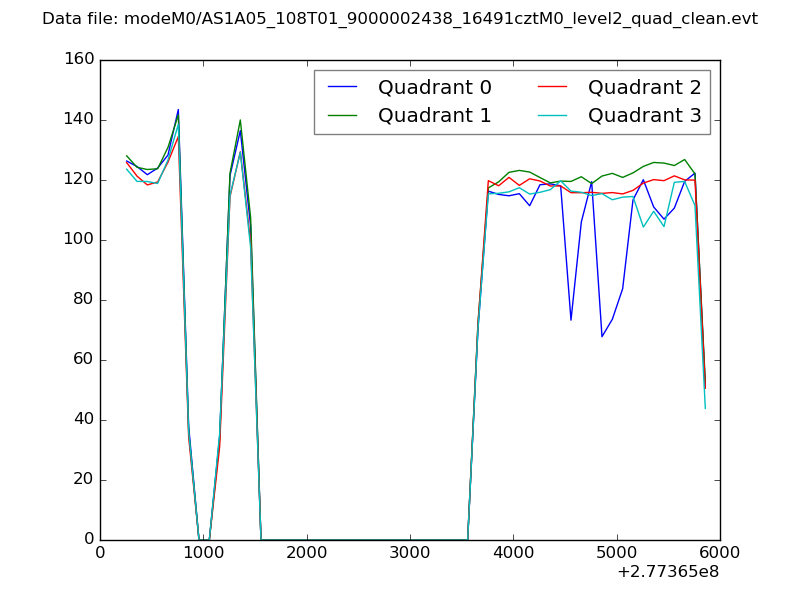 |
|
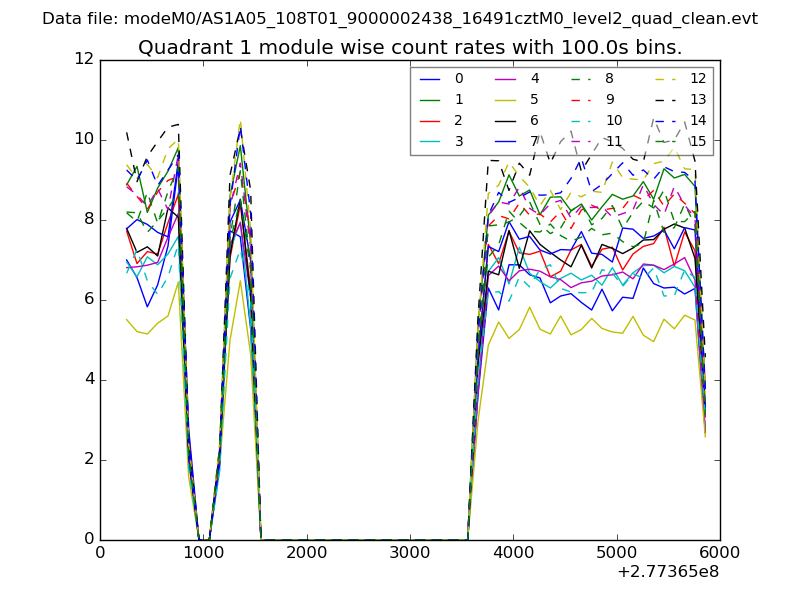
| Module-wise count rates for Quadrant A Data is divided into 100 sec bins |
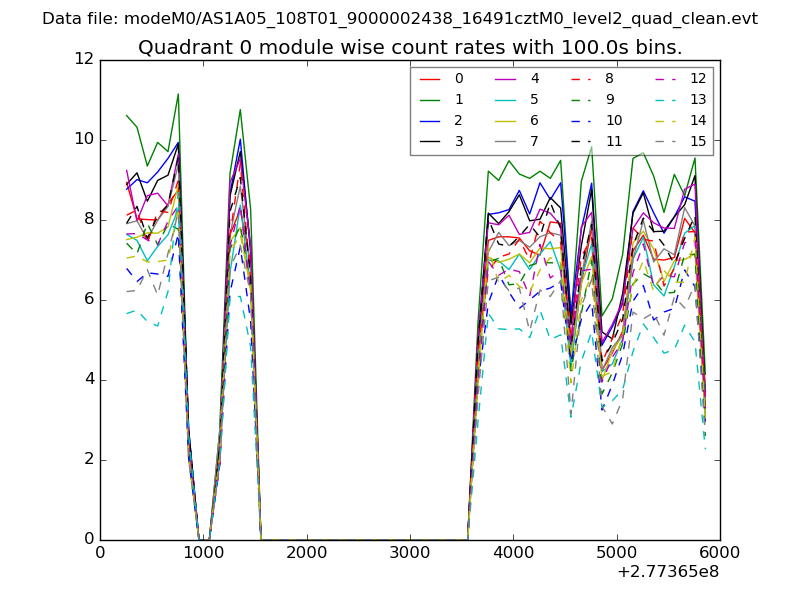 |
 |
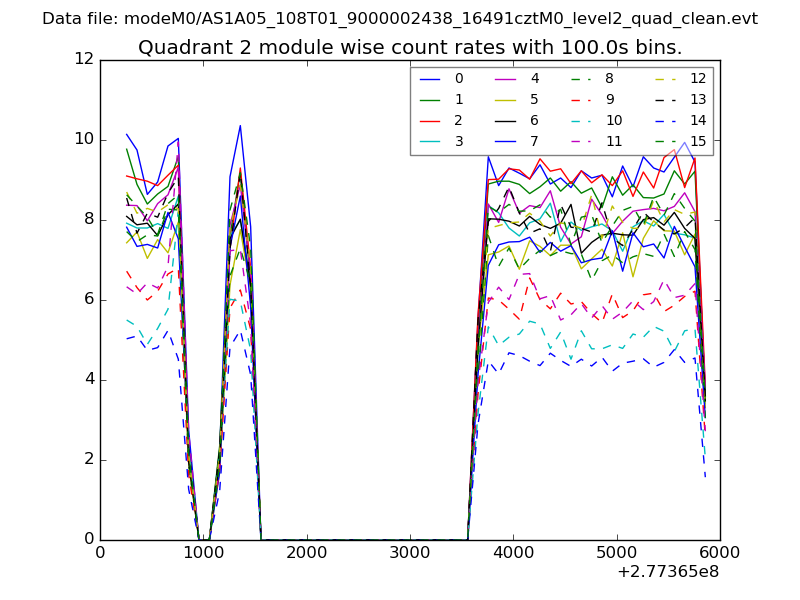
| Module-wise count rates for Quadrant B Data is divided into 100 sec bins |
 |
 |
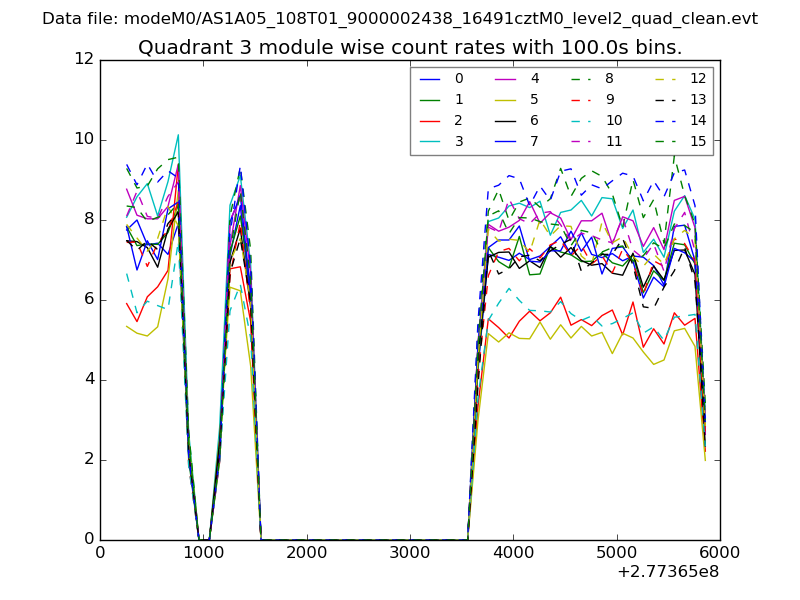
| Module-wise count rates for Quadrant C Data is divided into 100 sec bins |
 |
 |
| Module-wise count rates for Quadrant D Data is divided into 100 sec bins |
 |
 |
| Parameter | Plot |
|---|---|
| CZT HV Monitor | 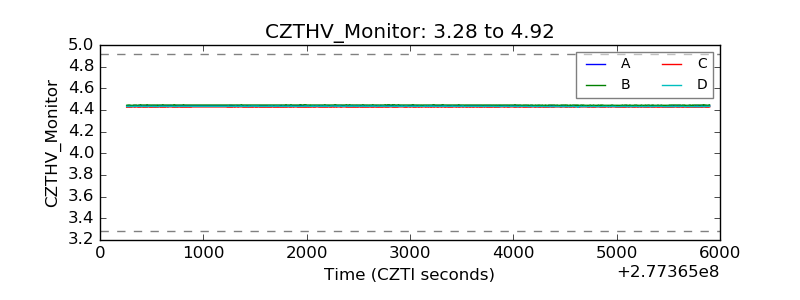 |
| D_VDD | 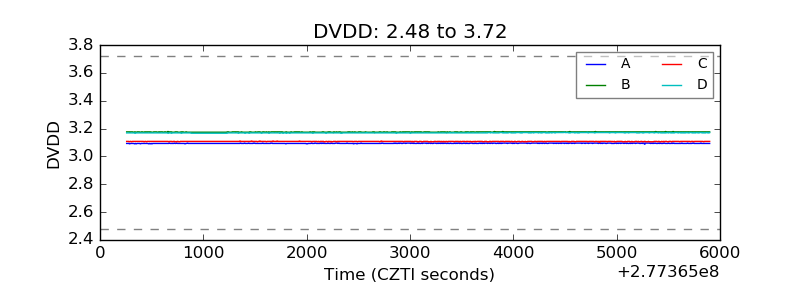 |
| Temperature 1 | 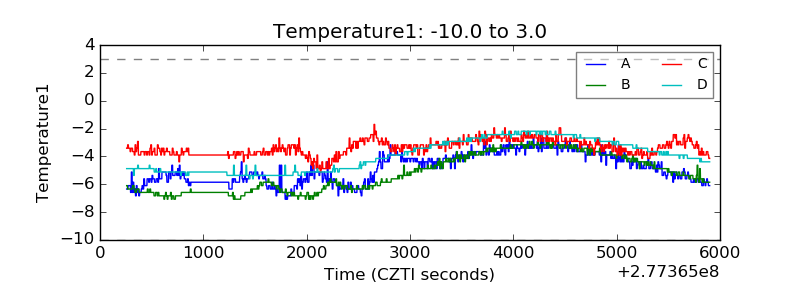 |
| Veto HV Monitor | 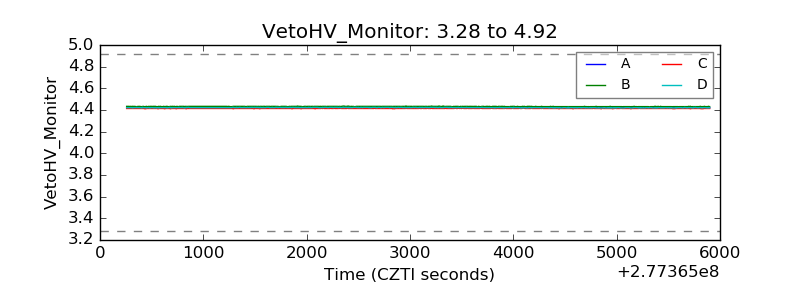 |
| Veto LLD | 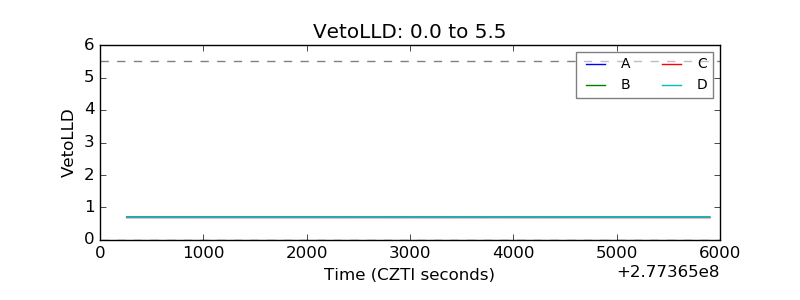 |
| Alpha Counter | 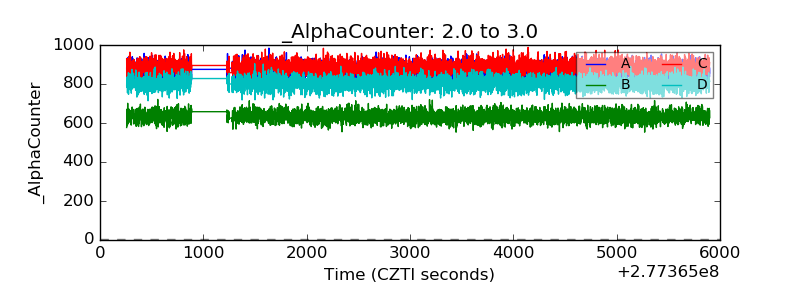 |
| _CPM_Rate | 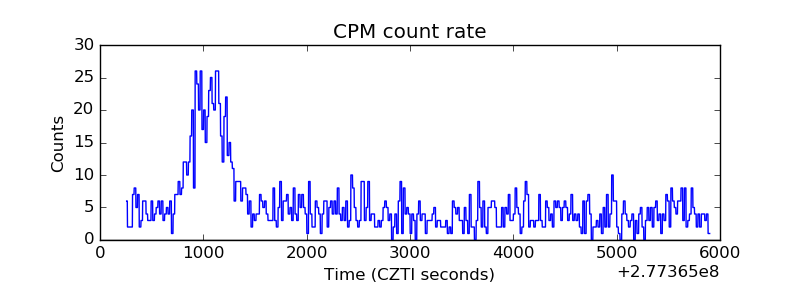 |
| CZT Counter | 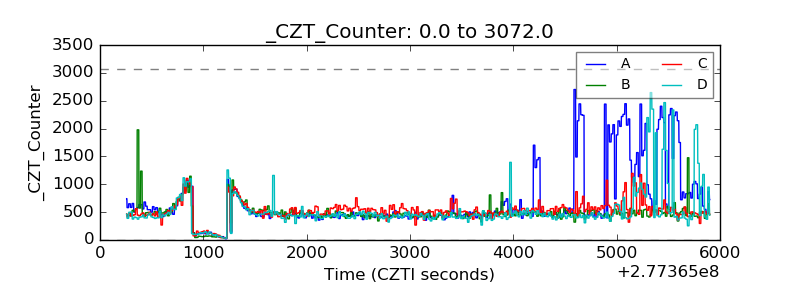 |
| +2.5 Volts monitor |  |
| +5 Volts monitor | 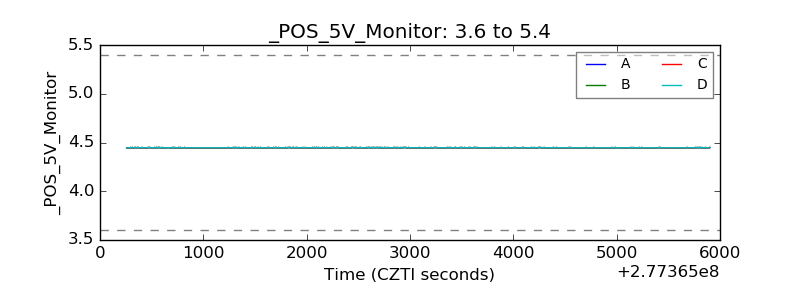 |
| _ROLL_ROT | 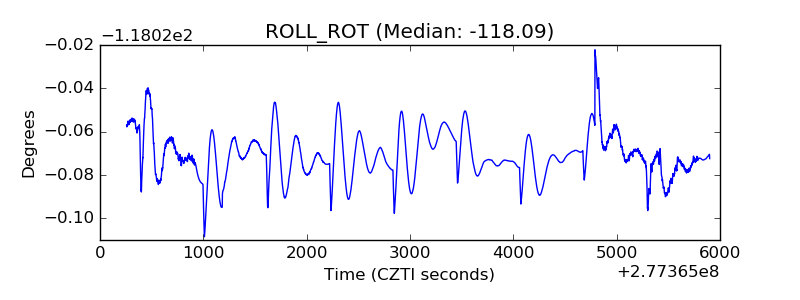 |
| _Roll_DEC | 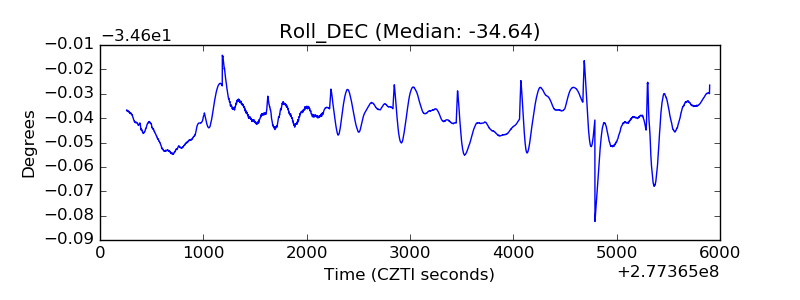 |
| _Roll_RA | 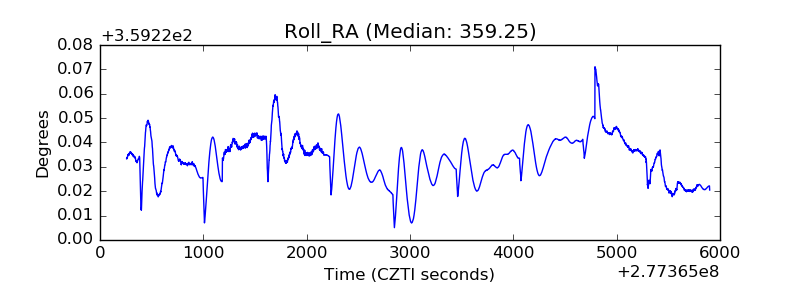 |
| Veto Counter | 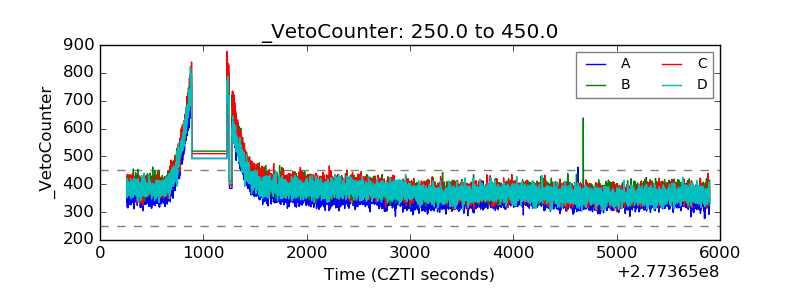 |