| Param | Original file | Final file |
|---|---|---|
| Filename | modeM0/AS1A05_174T01_9000002440cztM0_level2.fits | modeM0/AS1A05_174T01_9000002440cztM0_level2_quad_clean.evt |
| Size (bytes) | 1,674,109,440 | 1,577,525,760 |
| Size | 1.6 GB | 1.5 GB |
| Events in quadrant A | 10,185,726 | 9,332,246 |
| Events in quadrant B | 9,885,686 | 9,469,284 |
| Events in quadrant C | 9,756,396 | 8,562,640 |
| Events in quadrant D | 8,708,538 | 8,254,076 |
| Mode M9 | |||
|---|---|---|---|
| Quadrant | BADHDUFLAG | Total packets | Discarded packets |
| A | 0 | 274 | 0 |
| B | 0 | 274 | 0 |
| C | 0 | 274 | 0 |
| D | 0 | 274 | 0 |
| Mode SS | |||
|---|---|---|---|
| Quadrant | BADHDUFLAG | Total packets | Discarded packets |
| A | 0 | 3620 | 0 |
| B | 0 | 3620 | 0 |
| C | 0 | 3620 | 0 |
| D | 0 | 3620 | 0 |
| Mode M0 | |||
|---|---|---|---|
| Quadrant | BADHDUFLAG | Total packets | Discarded packets |
| A | 0 | 387212 | 0 |
| B | 0 | 378556 | 0 |
| C | 0 | 485399 | 0 |
| D | 0 | 390840 | 0 |
| Quadrant | Total seconds | Saturated seconds | Saturation percentage |
|---|---|---|---|
| A | 177489 | 2945 | 1.659258% |
| B | 177490 | 2955 | 1.664883% |
| C | 177488 | 12535 | 7.062449% |
| D | 177490 | 3157 | 1.778692% |
Noise dominated data is calculated using 1-second bins in cleaned event files. If a bin has >2000 counts, and if more than 50% of those come from <1% of pixels, then it is considered to be noise-dominated and hence unusable.
| Quadrant | # 1 sec bins | Bins with >0 counts | Bins with >2000 counts | High rate bins dominated by noise | Noise dominated (total time) | Noise dominated (detector-on time) | Marked lightcurve |
|---|---|---|---|---|---|---|---|
| A | 204635 | 177456 | 0 | 0 | 0.00% | 0.00% | 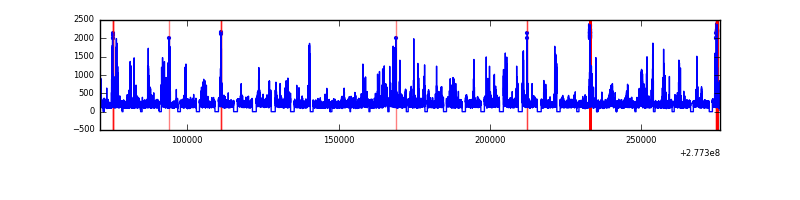 |
| B | 204635 | 177448 | 0 | 0 | 0.00% | 0.00% |  |
| C | 204635 | 177452 | 0 | 0 | 0.00% | 0.00% |  |
| D | 204635 | 177437 | 0 | 0 | 0.00% | 0.00% |  |
Top three noisy pixels from each quadrant. If the there are fewer than three noisy pixels in the level2.evt file, extra rows are filled as -1
| Pixel properties | Quadrant properties | ||||||
|---|---|---|---|---|---|---|---|
| Quadrant | DetID | PixID | Counts | Sigma | Mean | Median | Sigma |
| A | 0 | 29 | 9729 | 11.13 | 2643 | 2468 | 652.2 |
| A | 7 | 110 | 8237 | 8.85 | 2643 | 2468 | 652.2 |
| A | 0 | 30 | 7797 | 8.17 | 2643 | 2468 | 652.2 |
| B | 2 | 9 | 8107 | 10.99 | 2609 | 2479 | 512.1 |
| B | 2 | 8 | 6800 | 8.44 | 2609 | 2479 | 512.1 |
| B | 3 | 17 | 6599 | 8.04 | 2609 | 2479 | 512.1 |
| C | 1 | 80 | 7256 | 7.26 | 2577 | 2389 | 670.5 |
| C | 1 | 81 | 7166 | 7.12 | 2577 | 2389 | 670.5 |
| C | 12 | 241 | 7039 | 6.93 | 2577 | 2389 | 670.5 |
| D | 3 | 14 | 6444 | 6.33 | 2485 | 2252 | 662.3 |
| D | 6 | 231 | 6352 | 6.19 | 2485 | 2252 | 662.3 |
| D | 3 | 31 | 6163 | 5.91 | 2485 | 2252 | 662.3 |
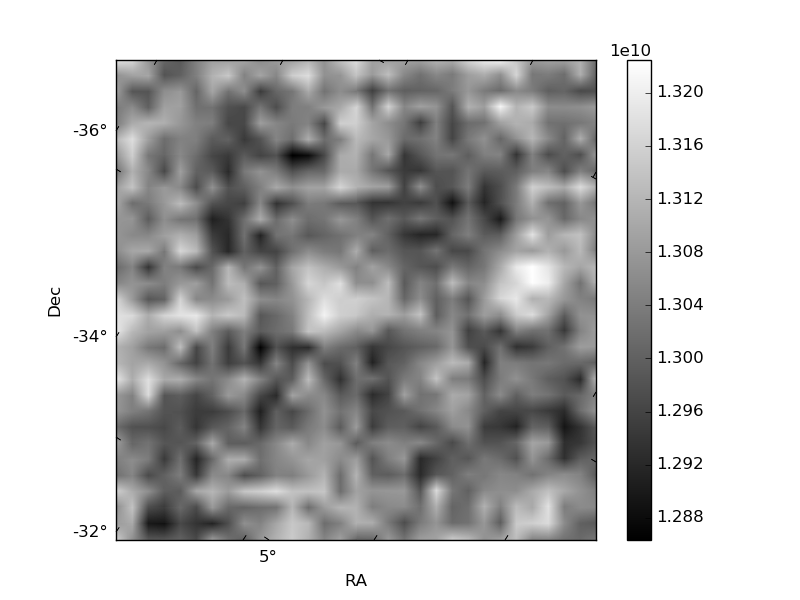
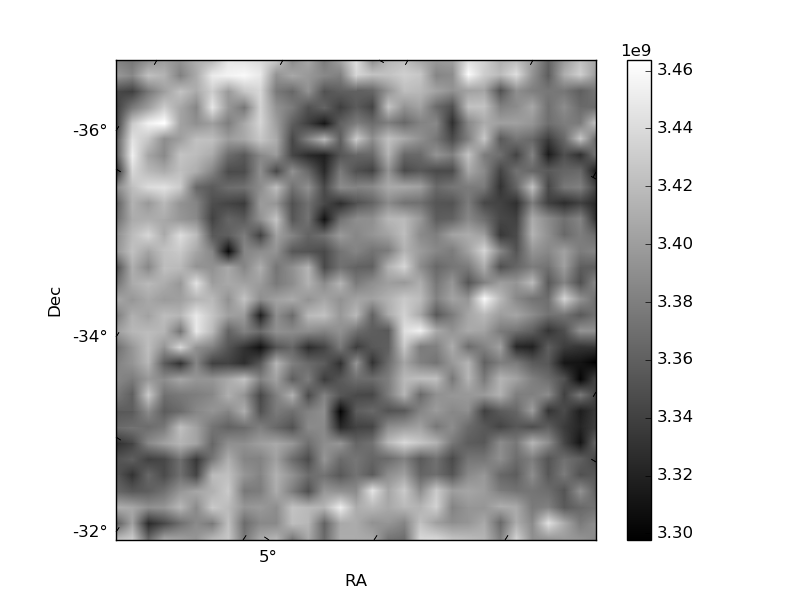
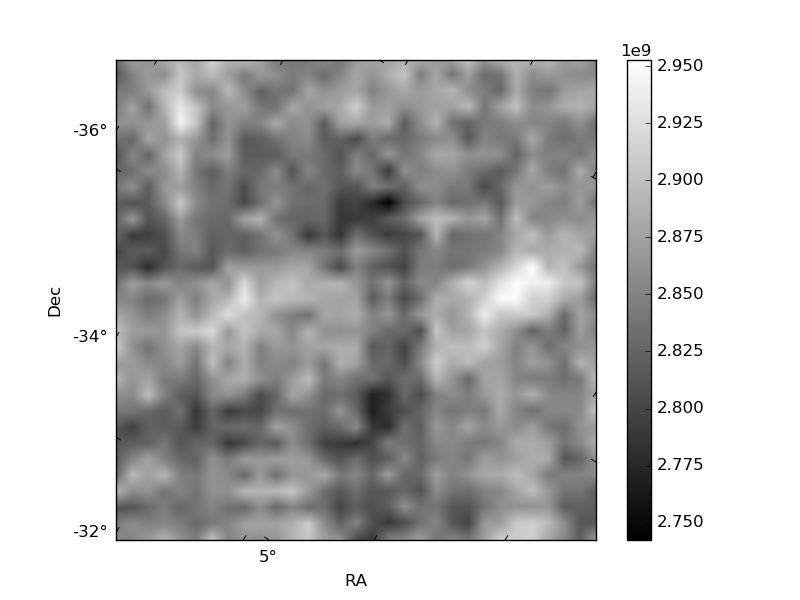
Histogram calculated using DETX and DETY for each event in the final _common_clean file
| Quadrant A |  |
 |
Quadrant B |
|---|---|---|---|
| Quadrant D |  |
 |
Quadrant C |
| Plot type | Count rate plots | Images |
|---|---|---|
| Comparison with Poisson distribution Blue bars denote a histogram of data divided into 1 sec bins. Red curve is a Poisson curve with rate = median count rate of data. |
 |
 |
| Quadrant-wise count rates Data is divided into 100 sec bins |
 |
|
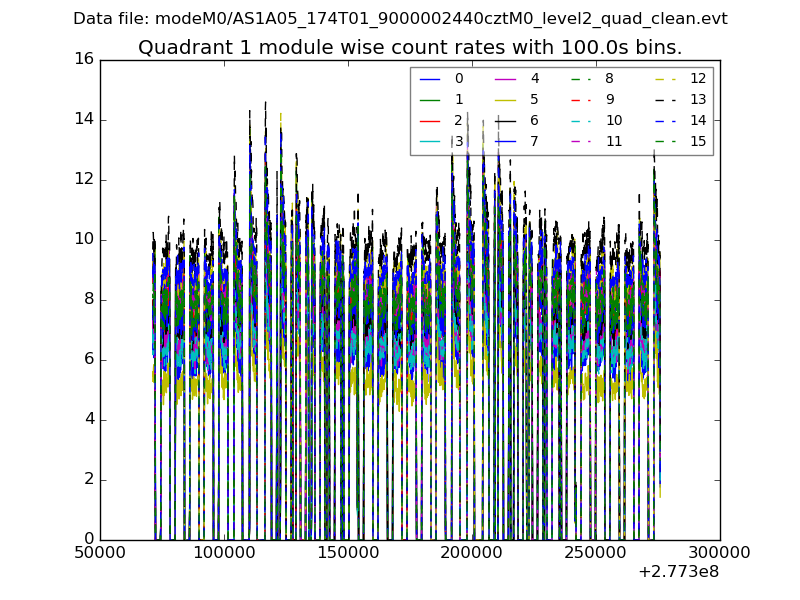
| Module-wise count rates for Quadrant A Data is divided into 100 sec bins |
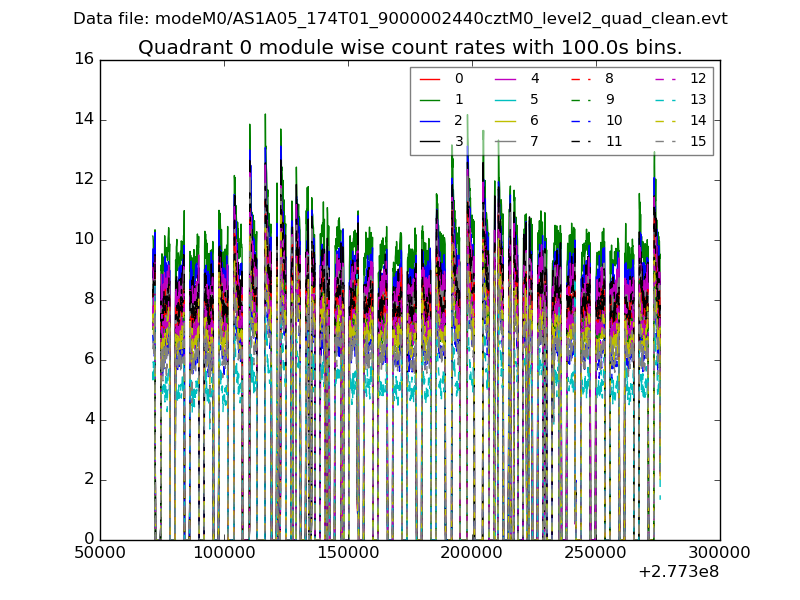 |
 |
| Module-wise count rates for Quadrant B Data is divided into 100 sec bins |
 |
 |
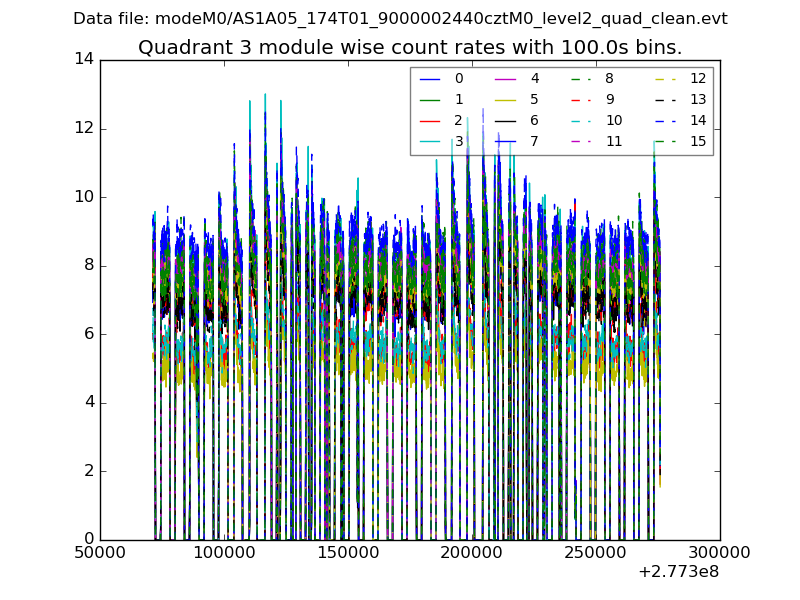
| Module-wise count rates for Quadrant C Data is divided into 100 sec bins |
 |
 |
| Module-wise count rates for Quadrant D Data is divided into 100 sec bins |
 |
 |
| Parameter | Plot |
|---|---|
| CZT HV Monitor |  |
| D_VDD |  |
| Temperature 1 |  |
| Veto HV Monitor |  |
| Veto LLD | 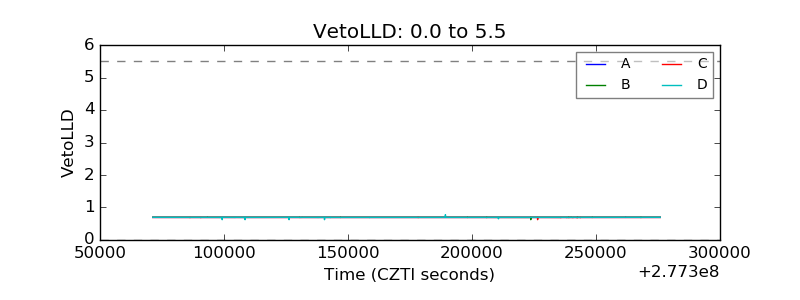 |
| Alpha Counter |  |
| _CPM_Rate | 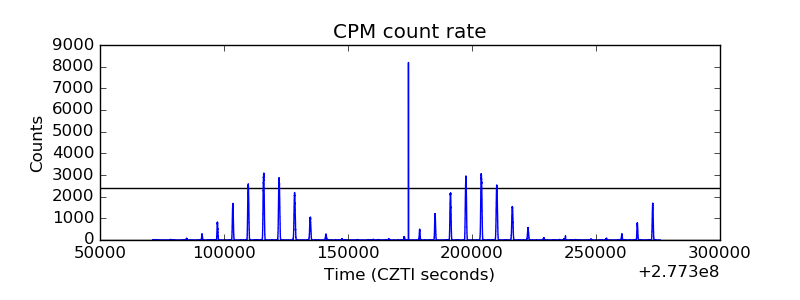 |
| CZT Counter |  |
| +2.5 Volts monitor |  |
| +5 Volts monitor |  |
| _ROLL_ROT |  |
| _Roll_DEC | 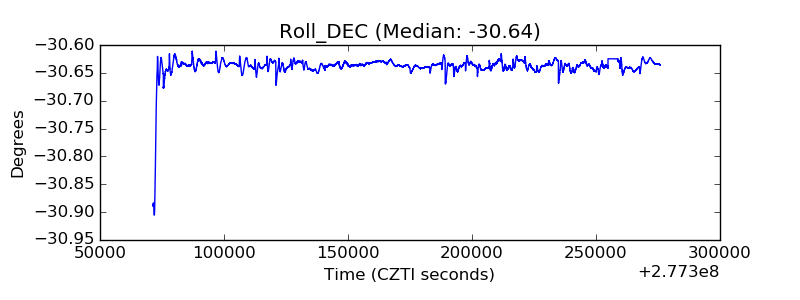 |
| _Roll_RA | 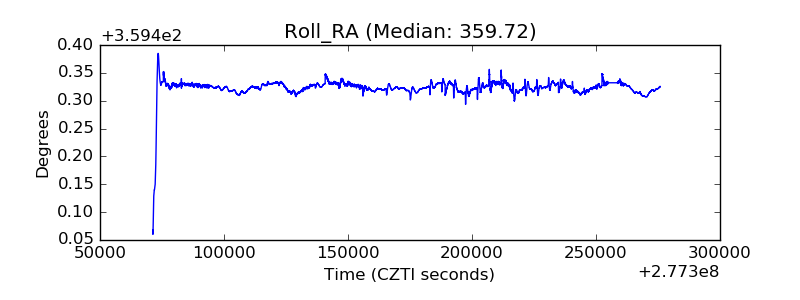 |
| Veto Counter |  |