| Param | Original file | Final file |
|---|---|---|
| Filename | modeM0/AS1A05_174T01_9000002440_16491cztM0_level2.evt | modeM0/AS1A05_174T01_9000002440_16491cztM0_level2_quad_clean.evt |
| Size (bytes) | 201,493,440 | 23,451,840 |
| Size | 192.2 MB | 22.4 MB |
| Events in quadrant A | 1,441,321 | 130,830 |
| Events in quadrant B | 1,457,127 | 132,219 |
| Events in quadrant C | 1,654,267 | 125,849 |
| Events in quadrant D | 1,362,710 | 126,294 |
| Mode M9 | |||
|---|---|---|---|
| Quadrant | BADHDUFLAG | Total packets | Discarded packets |
| A | 0 | 1 | 0 |
| B | 0 | 1 | 0 |
| C | 0 | 1 | 0 |
| D | 0 | 1 | 0 |
| Mode SS | |||
|---|---|---|---|
| Quadrant | BADHDUFLAG | Total packets | Discarded packets |
| A | 0 | 58 | 0 |
| B | 0 | 58 | 0 |
| C | 0 | 58 | 0 |
| D | 0 | 58 | 0 |
| Mode M0 | |||
|---|---|---|---|
| Quadrant | BADHDUFLAG | Total packets | Discarded packets |
| A | 0 | 6061 | 3 |
| B | 0 | 6054 | 2 |
| C | 0 | 6627 | 2 |
| D | 0 | 5945 | 2 |
| Quadrant | Total seconds | Saturated seconds | Saturation percentage |
|---|---|---|---|
| A | 2705 | 186 | 6.876155% |
| B | 2705 | 219 | 8.096118% |
| C | 2705 | 230 | 8.502773% |
| D | 2705 | 163 | 6.025878% |
Noise dominated data is calculated using 1-second bins in cleaned event files. If a bin has >2000 counts, and if more than 50% of those come from <1% of pixels, then it is considered to be noise-dominated and hence unusable.
| Quadrant | # 1 sec bins | Bins with >0 counts | Bins with >2000 counts | High rate bins dominated by noise | Noise dominated (total time) | Noise dominated (detector-on time) | Marked lightcurve |
|---|---|---|---|---|---|---|---|
| A | 2881 | 2707 | 0 | 0 | 0.00% | 0.00% | 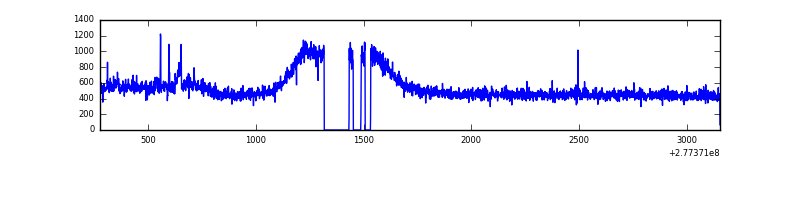 |
| B | 2881 | 2706 | 4 | 4 | 0.14% | 0.15% | 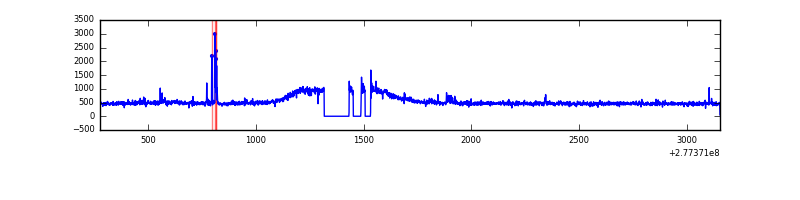 |
| C | 2881 | 2706 | 0 | 0 | 0.00% | 0.00% | 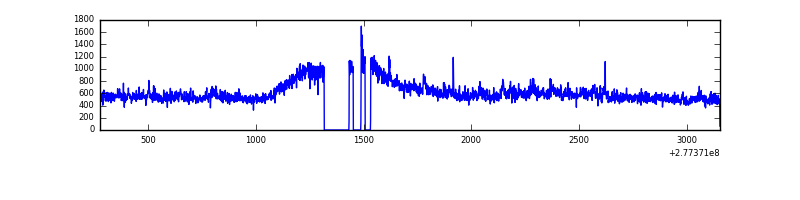 |
| D | 2881 | 2706 | 1 | 1 | 0.03% | 0.04% | 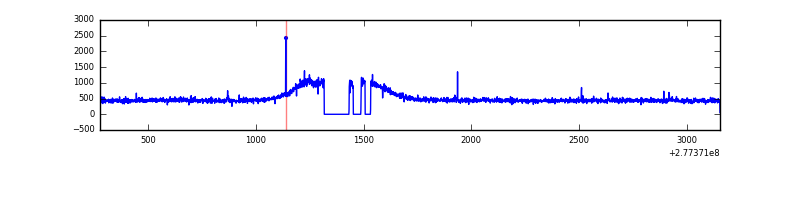 |
Top three noisy pixels from each quadrant. If the there are fewer than three noisy pixels in the level2.evt file, extra rows are filled as -1
| Pixel properties | Quadrant properties | ||||||
|---|---|---|---|---|---|---|---|
| Quadrant | DetID | PixID | Counts | Sigma | Mean | Median | Sigma |
| A | 15 | 174 | 59894 | 784.51 | 359 | 349 | 75.9 |
| A | 0 | 226 | 3101 | 36.26 | 359 | 349 | 75.9 |
| A | 3 | 137 | 2869 | 33.2 | 359 | 349 | 75.9 |
| B | 4 | 173 | 25227 | 341.04 | 358 | 347 | 73.0 |
| B | 15 | 35 | 12107 | 161.2 | 358 | 347 | 73.0 |
| B | 12 | 111 | 9098 | 119.95 | 358 | 347 | 73.0 |
| C | 3 | 233 | 240782 | 2815.65 | 349 | 350 | 85.4 |
| C | 14 | 238 | 50813 | 590.96 | 349 | 350 | 85.4 |
| C | 13 | 61 | 2513 | 25.33 | 349 | 350 | 85.4 |
| D | 2 | 234 | 9080 | 95.25 | 358 | 346 | 91.7 |
| D | 13 | 248 | 6223 | 64.09 | 358 | 346 | 91.7 |
| D | 13 | 249 | 3810 | 37.78 | 358 | 346 | 91.7 |
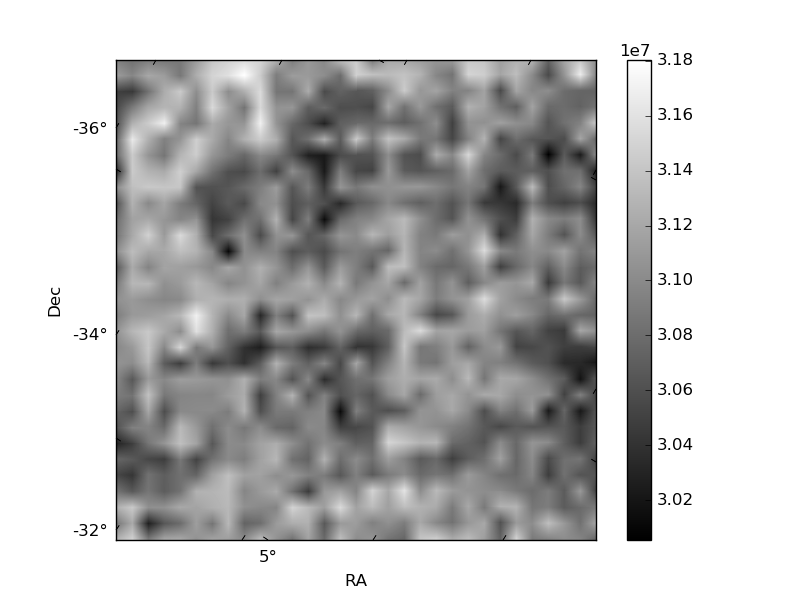
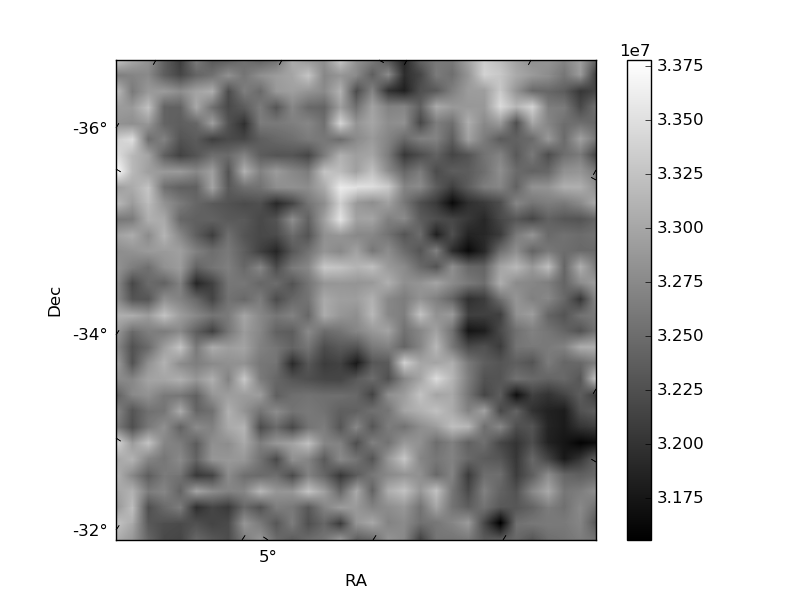
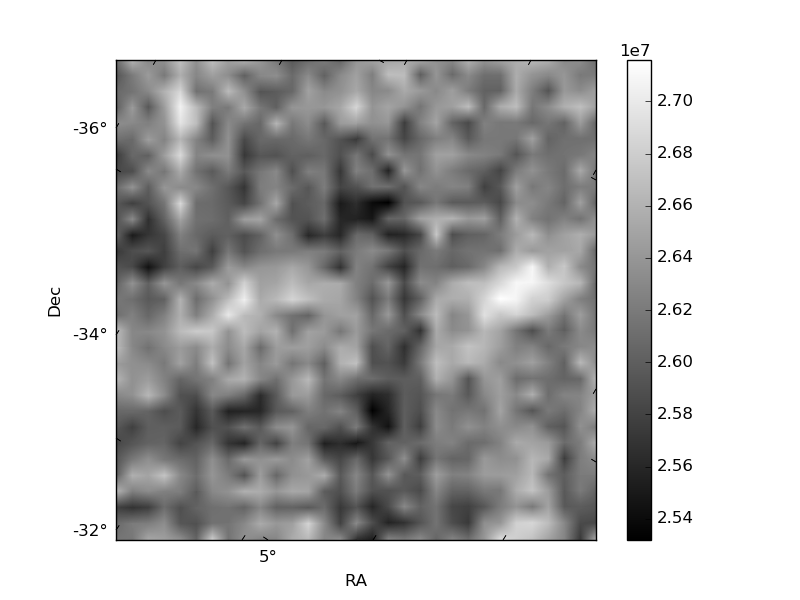
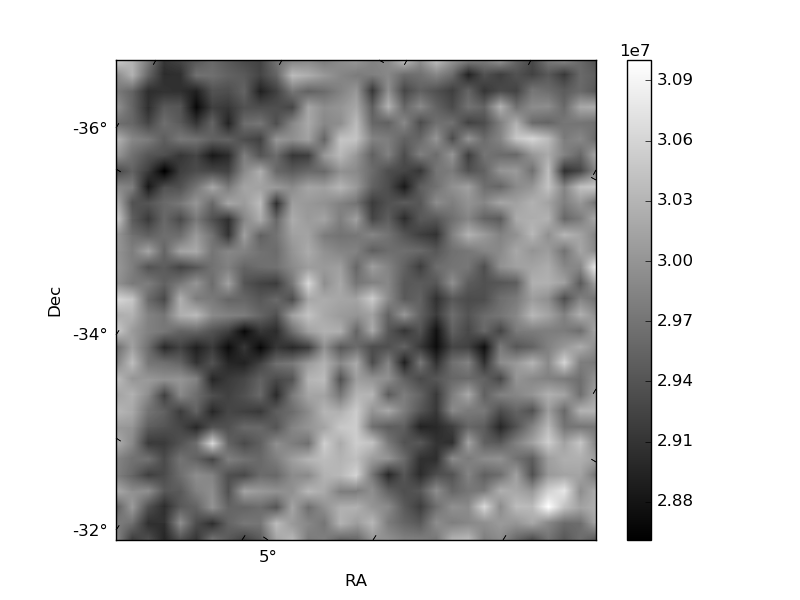
Histogram calculated using DETX and DETY for each event in the final _common_clean file
| Quadrant A |  |
 |
Quadrant B |
|---|---|---|---|
| Quadrant D |  |
 |
Quadrant C |
| Plot type | Count rate plots | Images |
|---|---|---|
| Comparison with Poisson distribution Blue bars denote a histogram of data divided into 1 sec bins. Red curve is a Poisson curve with rate = median count rate of data. |
 |
 |
| Quadrant-wise count rates Data is divided into 100 sec bins |
 |
|
| Module-wise count rates for Quadrant A Data is divided into 100 sec bins |
 |
 |
| Module-wise count rates for Quadrant B Data is divided into 100 sec bins |
 |
 |
| Module-wise count rates for Quadrant C Data is divided into 100 sec bins |
 |
 |
| Module-wise count rates for Quadrant D Data is divided into 100 sec bins |
 |
 |
| Parameter | Plot |
|---|---|
| CZT HV Monitor |  |
| D_VDD | 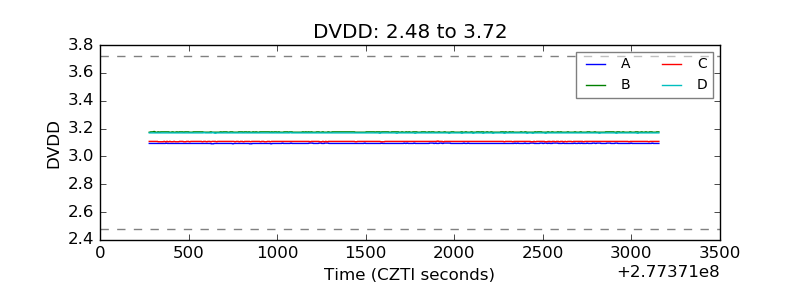 |
| Temperature 1 | 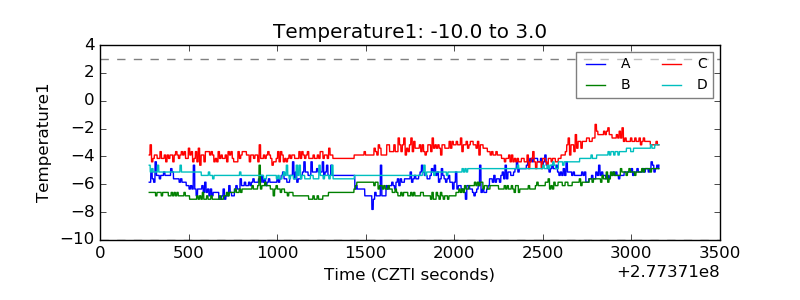 |
| Veto HV Monitor |  |
| Veto LLD |  |
| Alpha Counter |  |
| _CPM_Rate |  |
| CZT Counter |  |
| +2.5 Volts monitor |  |
| +5 Volts monitor |  |
| _ROLL_ROT |  |
| _Roll_DEC |  |
| _Roll_RA |  |
| Veto Counter |  |