| Param | Original file | Final file |
|---|---|---|
| Filename | modeM0/AS1A05_174T01_9000002440_16492cztM0_level2.evt | modeM0/AS1A05_174T01_9000002440_16492cztM0_level2_quad_clean.evt |
| Size (bytes) | 584,726,400 | 78,503,040 |
| Size | 557.6 MB | 74.9 MB |
| Events in quadrant A | 4,372,794 | 459,521 |
| Events in quadrant B | 4,254,083 | 468,665 |
| Events in quadrant C | 4,613,106 | 455,270 |
| Events in quadrant D | 3,937,669 | 449,623 |
| Mode M9 | |||
|---|---|---|---|
| Quadrant | BADHDUFLAG | Total packets | Discarded packets |
| A | 0 | 4 | 0 |
| B | 0 | 4 | 0 |
| C | 0 | 4 | 0 |
| D | 0 | 4 | 0 |
| Mode SS | |||
|---|---|---|---|
| Quadrant | BADHDUFLAG | Total packets | Discarded packets |
| A | 0 | 164 | 0 |
| B | 0 | 164 | 0 |
| C | 0 | 164 | 0 |
| D | 0 | 164 | 0 |
| Mode M0 | |||
|---|---|---|---|
| Quadrant | BADHDUFLAG | Total packets | Discarded packets |
| A | 0 | 18207 | 4 |
| B | 0 | 17623 | 3 |
| C | 0 | 19061 | 3 |
| D | 0 | 17275 | 3 |
| Quadrant | Total seconds | Saturated seconds | Saturation percentage |
|---|---|---|---|
| A | 7808 | 403 | 5.161373% |
| B | 7808 | 444 | 5.686475% |
| C | 7808 | 466 | 5.968238% |
| D | 7808 | 331 | 4.239242% |
Noise dominated data is calculated using 1-second bins in cleaned event files. If a bin has >2000 counts, and if more than 50% of those come from <1% of pixels, then it is considered to be noise-dominated and hence unusable.
| Quadrant | # 1 sec bins | Bins with >0 counts | Bins with >2000 counts | High rate bins dominated by noise | Noise dominated (total time) | Noise dominated (detector-on time) | Marked lightcurve |
|---|---|---|---|---|---|---|---|
| A | 8314 | 7810 | 59 | 59 | 0.71% | 0.76% | 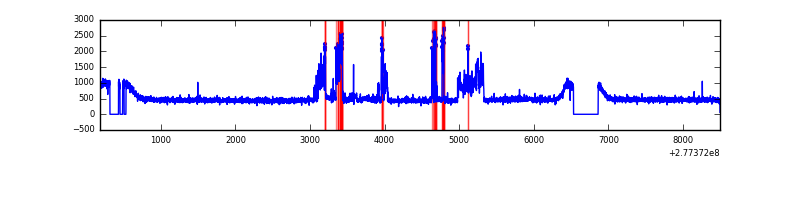 |
| B | 8314 | 7809 | 53 | 53 | 0.64% | 0.68% | 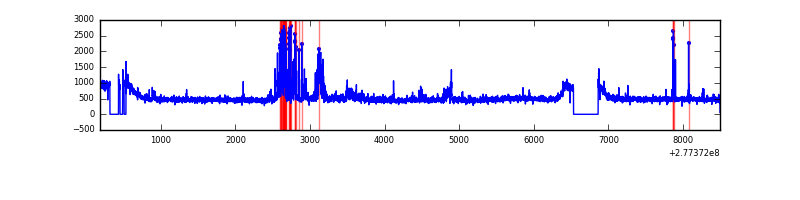 |
| C | 8314 | 7809 | 0 | 0 | 0.00% | 0.00% | 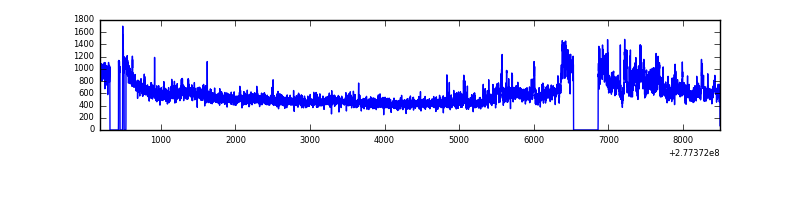 |
| D | 8314 | 7809 | 55 | 55 | 0.66% | 0.70% | 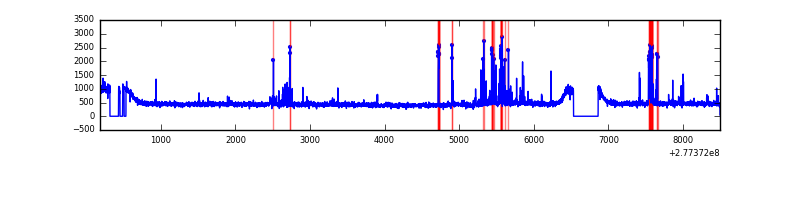 |
Top three noisy pixels from each quadrant. If the there are fewer than three noisy pixels in the level2.evt file, extra rows are filled as -1
| Pixel properties | Quadrant properties | ||||||
|---|---|---|---|---|---|---|---|
| Quadrant | DetID | PixID | Counts | Sigma | Mean | Median | Sigma |
| A | 15 | 174 | 668752 | 3384.49 | 963 | 939 | 197.3 |
| A | 0 | 226 | 8218 | 36.89 | 963 | 939 | 197.3 |
| A | 3 | 137 | 7505 | 33.27 | 963 | 939 | 197.3 |
| B | 0 | 189 | 140014 | 734.83 | 960 | 931 | 189.3 |
| B | 4 | 48 | 136662 | 717.12 | 960 | 931 | 189.3 |
| B | 15 | 35 | 132404 | 694.62 | 960 | 931 | 189.3 |
| C | 3 | 233 | 846677 | 3842.38 | 927 | 933 | 220.1 |
| C | 14 | 238 | 140354 | 633.42 | 927 | 933 | 220.1 |
| C | 7 | 247 | 14411 | 61.23 | 927 | 933 | 220.1 |
| D | 12 | 218 | 126903 | 539.33 | 950 | 921 | 233.6 |
| D | 5 | 222 | 97607 | 413.91 | 950 | 921 | 233.6 |
| D | 13 | 248 | 53092 | 223.35 | 950 | 921 | 233.6 |
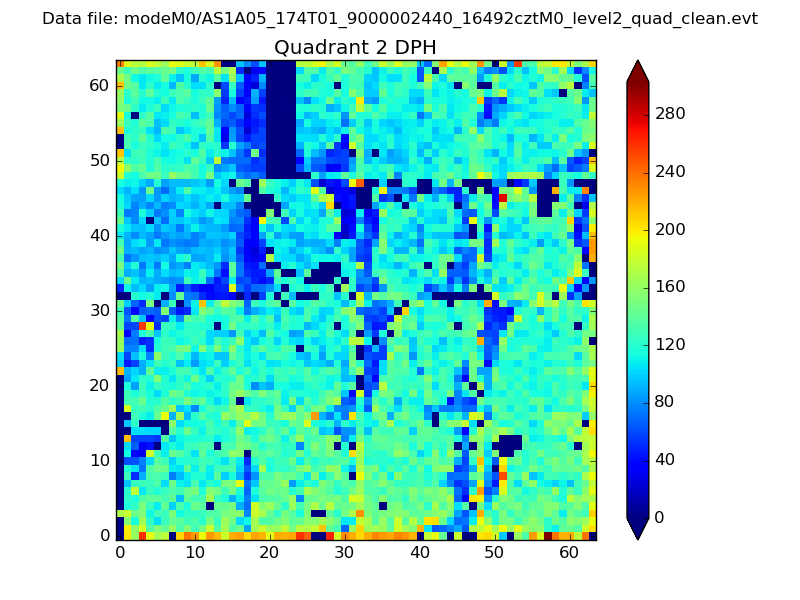
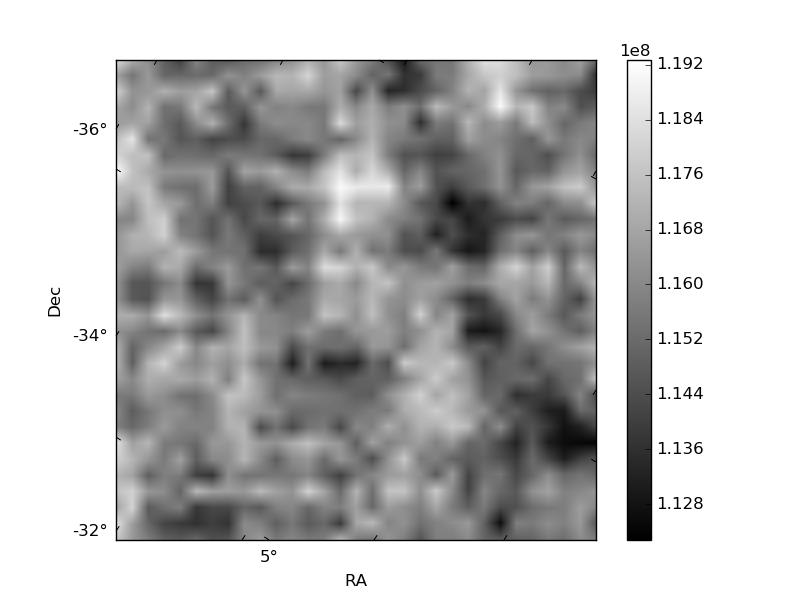
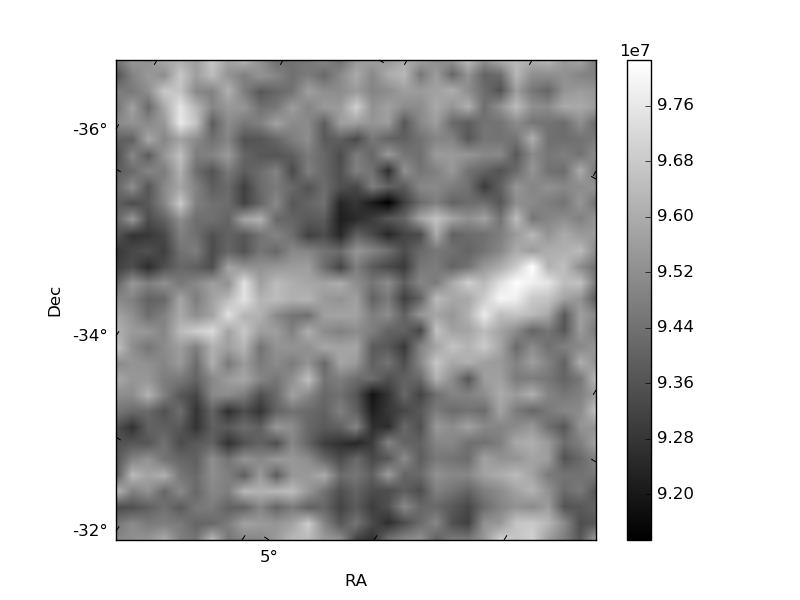
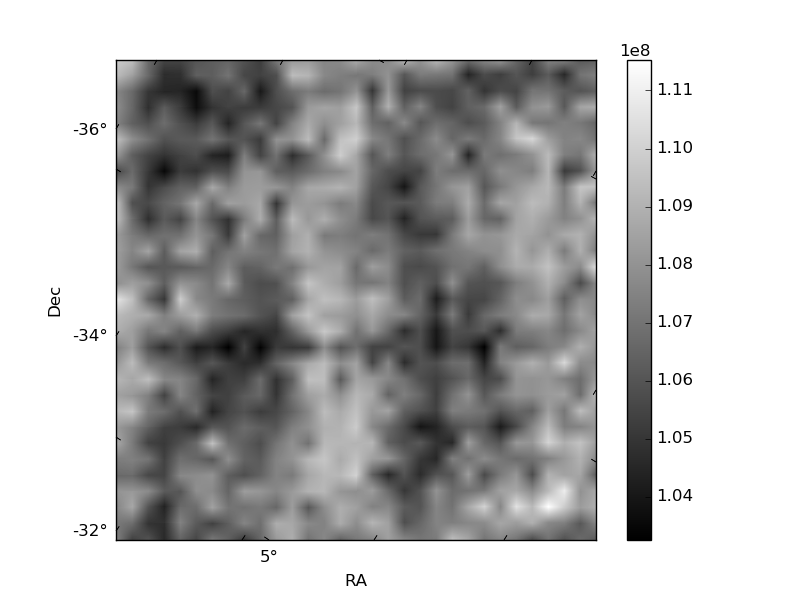
Histogram calculated using DETX and DETY for each event in the final _common_clean file
| Quadrant A | 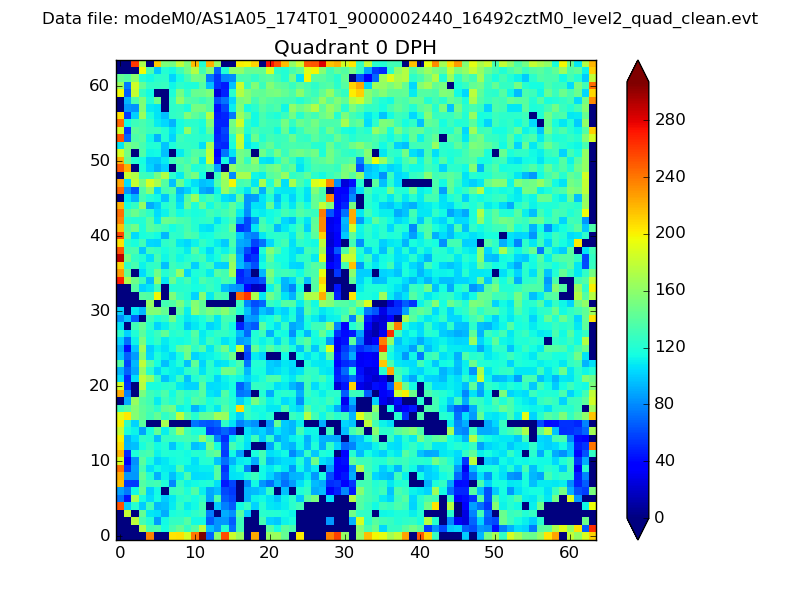 |
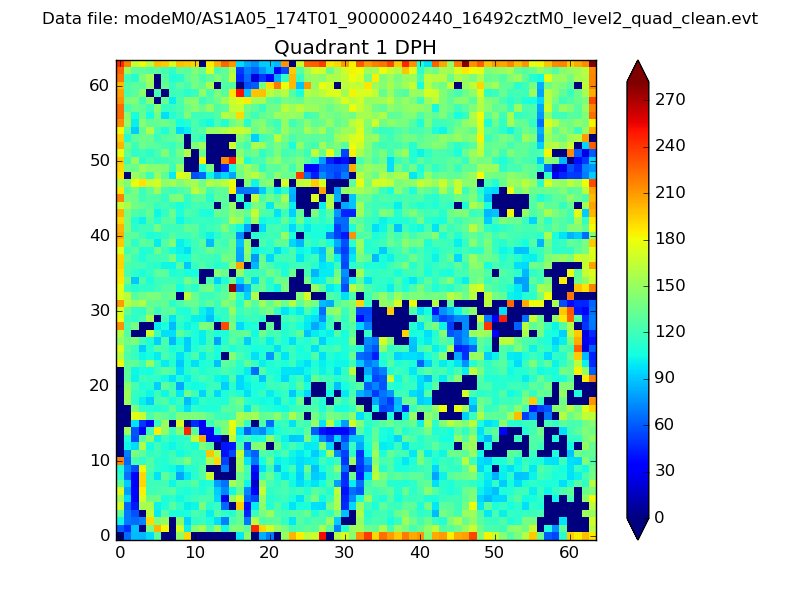 |
Quadrant B |
|---|---|---|---|
| Quadrant D | 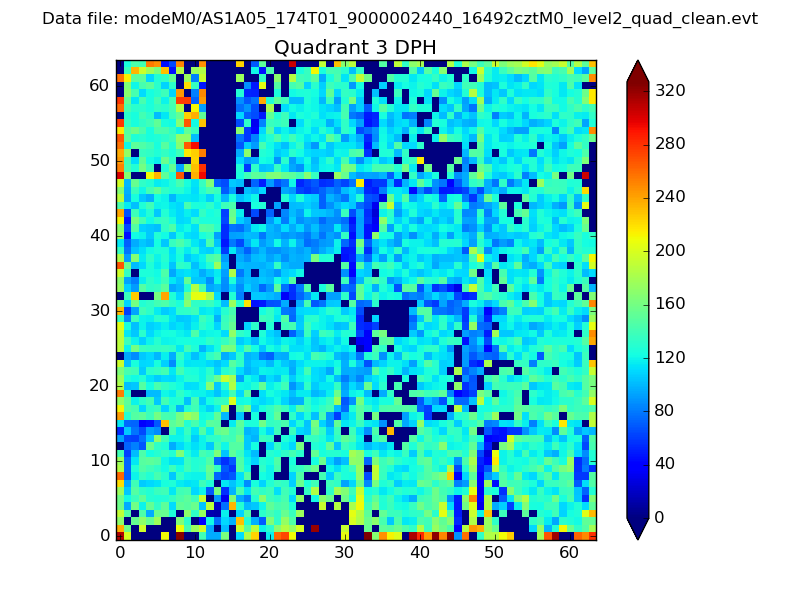 |
 |
Quadrant C |
| Plot type | Count rate plots | Images |
|---|---|---|
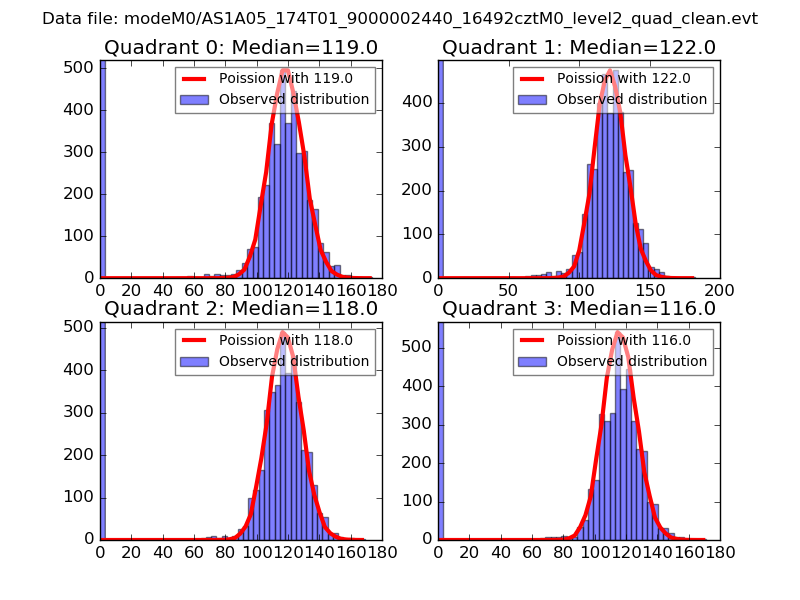
| Comparison with Poisson distribution Blue bars denote a histogram of data divided into 1 sec bins. Red curve is a Poisson curve with rate = median count rate of data. |
 |
 |
| Quadrant-wise count rates Data is divided into 100 sec bins |
 |
|
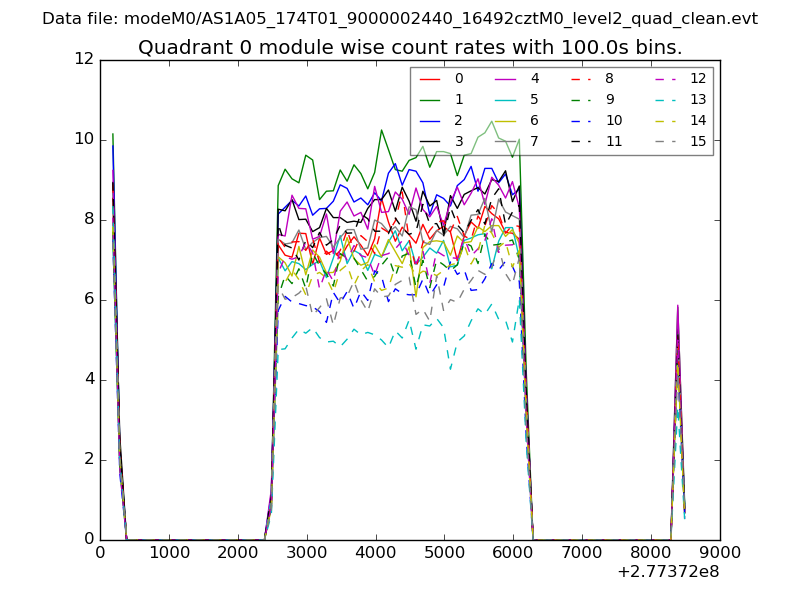
| Module-wise count rates for Quadrant A Data is divided into 100 sec bins |
 |
 |
| Module-wise count rates for Quadrant B Data is divided into 100 sec bins |
 |
 |
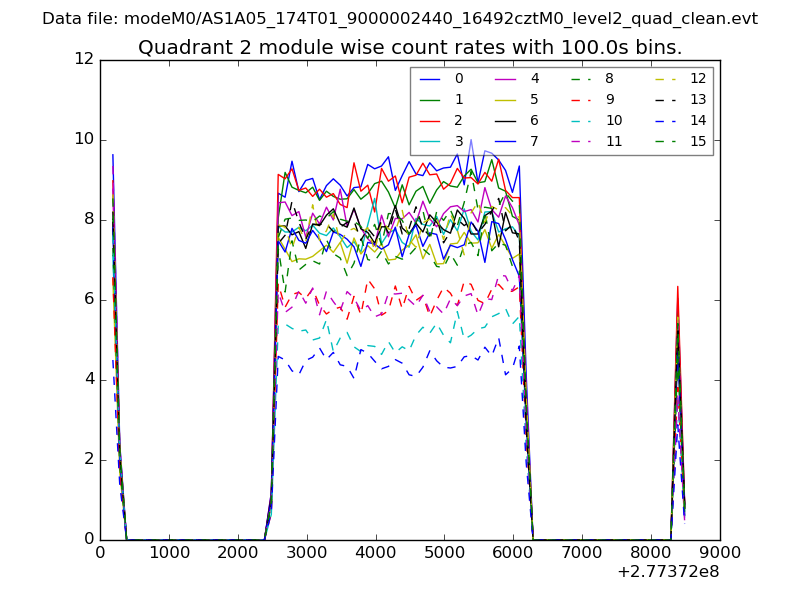
| Module-wise count rates for Quadrant C Data is divided into 100 sec bins |
 |
 |
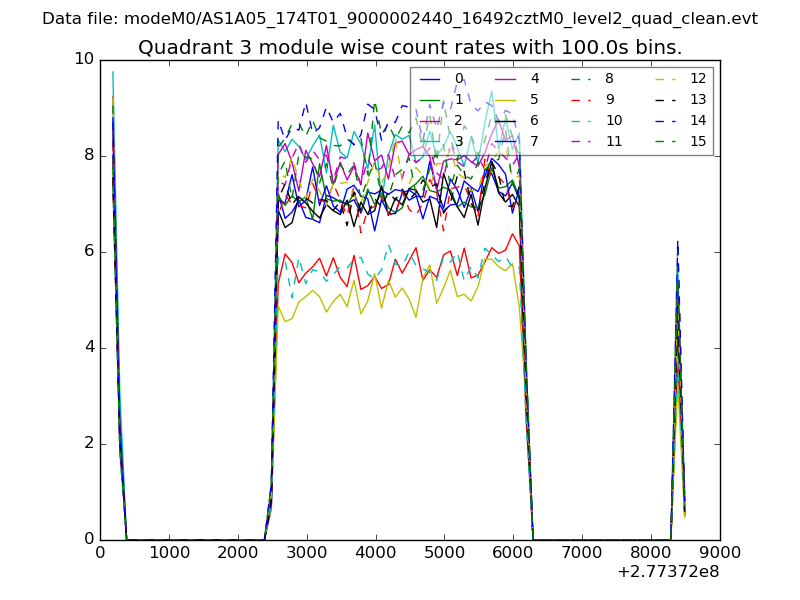
| Module-wise count rates for Quadrant D Data is divided into 100 sec bins |
 |
 |
| Parameter | Plot |
|---|---|
| CZT HV Monitor | 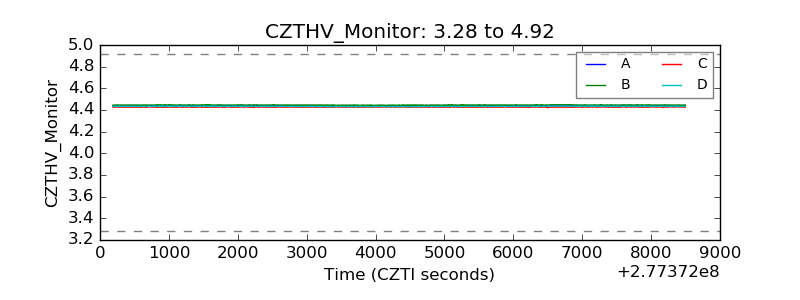 |
| D_VDD | 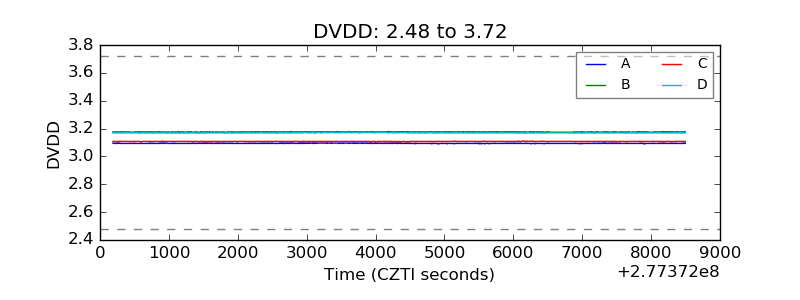 |
| Temperature 1 | 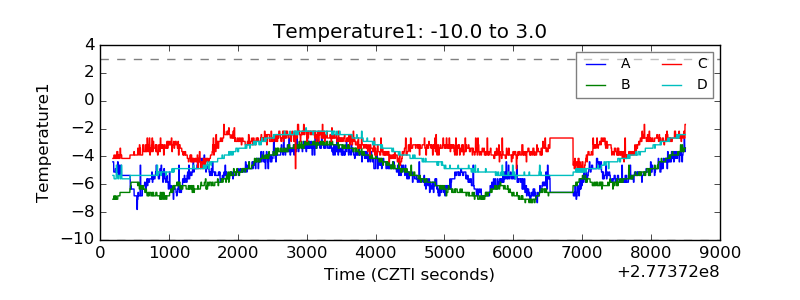 |
| Veto HV Monitor | 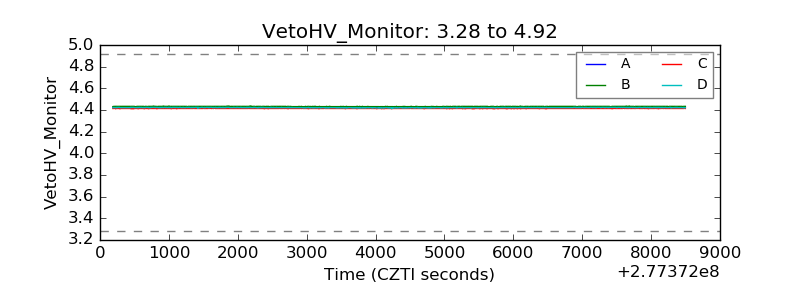 |
| Veto LLD | 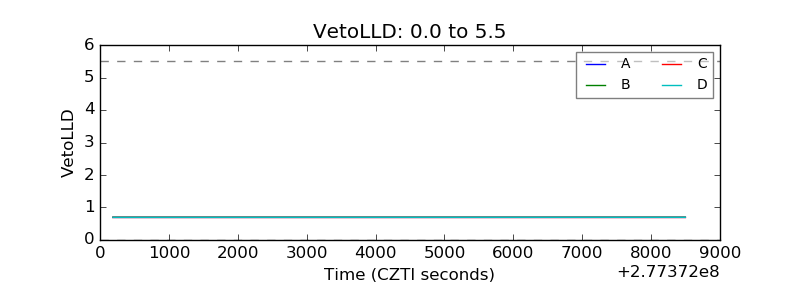 |
| Alpha Counter | 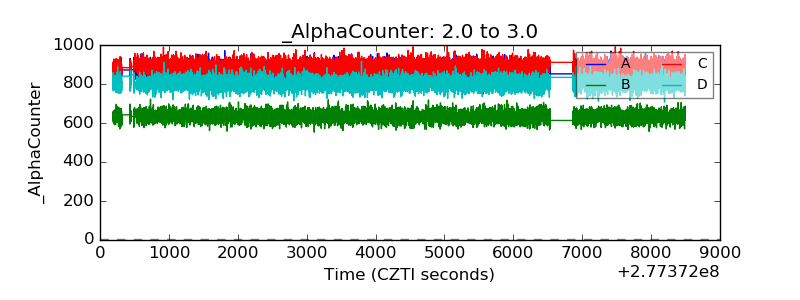 |
| _CPM_Rate |  |
| CZT Counter | 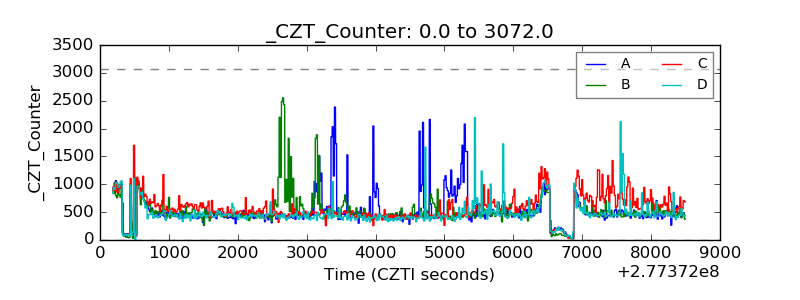 |
| +2.5 Volts monitor |  |
| +5 Volts monitor |  |
| _ROLL_ROT |  |
| _Roll_DEC | 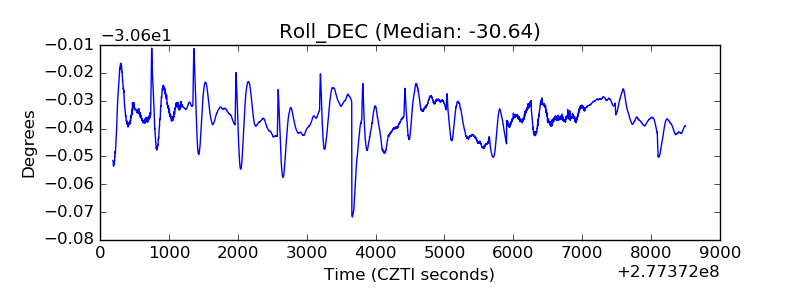 |
| _Roll_RA | 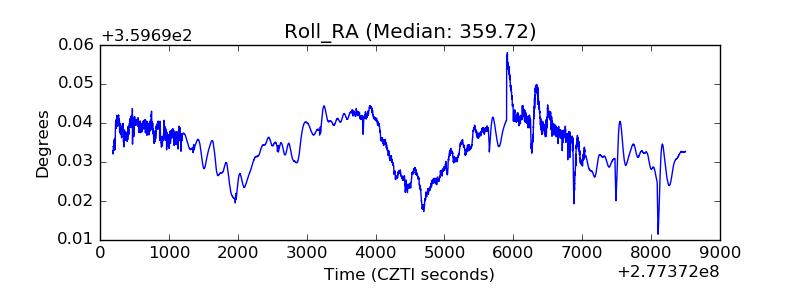 |
| Veto Counter | 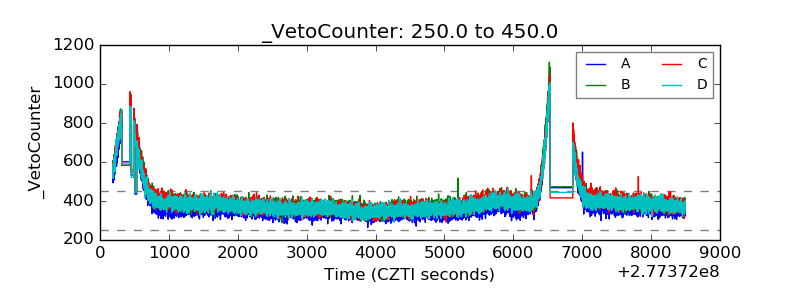 |