| Param | Original file | Final file |
|---|---|---|
| Filename | modeM0/AS1A05_174T01_9000002440_16494cztM0_level2.evt | modeM0/AS1A05_174T01_9000002440_16494cztM0_level2_quad_clean.evt |
| Size (bytes) | 1,289,252,160 | 167,388,480 |
| Size | 1.2 GB | 159.6 MB |
| Events in quadrant A | 7,201,527 | 1,053,158 |
| Events in quadrant B | 6,957,191 | 1,077,175 |
| Events in quadrant C | 14,455,806 | 992,732 |
| Events in quadrant D | 9,494,606 | 987,098 |
| Mode M9 | |||
|---|---|---|---|
| Quadrant | BADHDUFLAG | Total packets | Discarded packets |
| A | 0 | 16 | 0 |
| B | 0 | 16 | 0 |
| C | 0 | 16 | 0 |
| D | 0 | 16 | 0 |
| Mode SS | |||
|---|---|---|---|
| Quadrant | BADHDUFLAG | Total packets | Discarded packets |
| A | 0 | 284 | 0 |
| B | 0 | 284 | 0 |
| C | 0 | 284 | 0 |
| D | 0 | 284 | 0 |
| Mode M0 | |||
|---|---|---|---|
| Quadrant | BADHDUFLAG | Total packets | Discarded packets |
| A | 0 | 30661 | 4 |
| B | 0 | 29371 | 3 |
| C | 0 | 52939 | 3 |
| D | 0 | 37562 | 3 |
| Quadrant | Total seconds | Saturated seconds | Saturation percentage |
|---|---|---|---|
| A | 13891 | 377 | 2.713987% |
| B | 13891 | 363 | 2.613203% |
| C | 13891 | 1763 | 12.691671% |
| D | 13891 | 935 | 6.730977% |
Noise dominated data is calculated using 1-second bins in cleaned event files. If a bin has >2000 counts, and if more than 50% of those come from <1% of pixels, then it is considered to be noise-dominated and hence unusable.
| Quadrant | # 1 sec bins | Bins with >0 counts | Bins with >2000 counts | High rate bins dominated by noise | Noise dominated (total time) | Noise dominated (detector-on time) | Marked lightcurve |
|---|---|---|---|---|---|---|---|
| A | 15457 | 13892 | 37 | 37 | 0.24% | 0.27% | 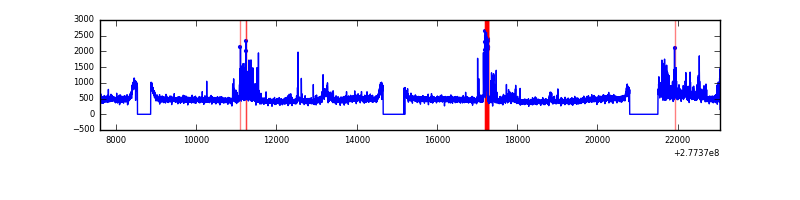 |
| B | 15457 | 13892 | 9 | 9 | 0.06% | 0.06% | 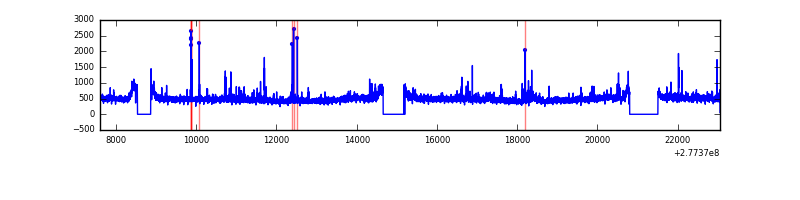 |
| C | 15457 | 13893 | 524 | 524 | 3.39% | 3.77% | 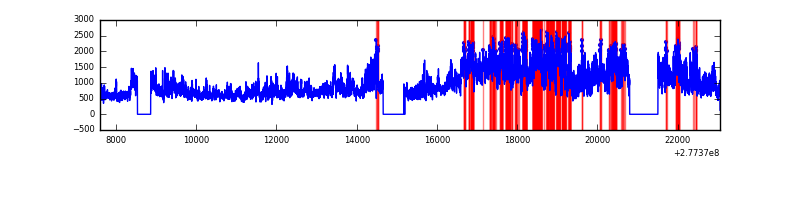 |
| D | 15457 | 13893 | 750 | 750 | 4.85% | 5.40% | 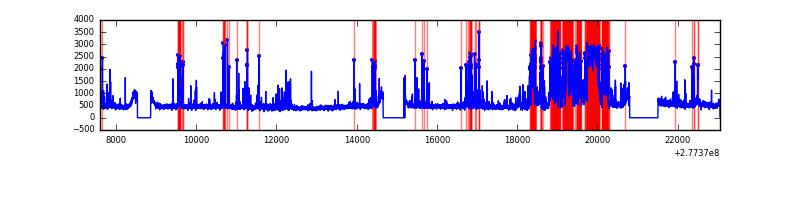 |
Top three noisy pixels from each quadrant. If the there are fewer than three noisy pixels in the level2.evt file, extra rows are filled as -1
| Pixel properties | Quadrant properties | ||||||
|---|---|---|---|---|---|---|---|
| Quadrant | DetID | PixID | Counts | Sigma | Mean | Median | Sigma |
| A | 15 | 174 | 779628 | 2298.58 | 1671 | 1633 | 338.5 |
| A | 0 | 226 | 14464 | 37.91 | 1671 | 1633 | 338.5 |
| A | 3 | 137 | 12633 | 32.5 | 1671 | 1633 | 338.5 |
| B | 15 | 35 | 120328 | 364.81 | 1674 | 1629 | 325.4 |
| B | 3 | 209 | 59607 | 178.19 | 1674 | 1629 | 325.4 |
| B | 4 | 48 | 53952 | 160.81 | 1674 | 1629 | 325.4 |
| C | 3 | 233 | 8052324 | 21874.54 | 1571 | 1577 | 368.0 |
| C | 14 | 238 | 237561 | 641.19 | 1571 | 1577 | 368.0 |
| C | 7 | 247 | 26752 | 68.4 | 1571 | 1577 | 368.0 |
| D | 5 | 222 | 2885733 | 7395.9 | 1598 | 1549 | 390.0 |
| D | 12 | 218 | 226282 | 576.28 | 1598 | 1549 | 390.0 |
| D | 1 | 52 | 147195 | 373.48 | 1598 | 1549 | 390.0 |
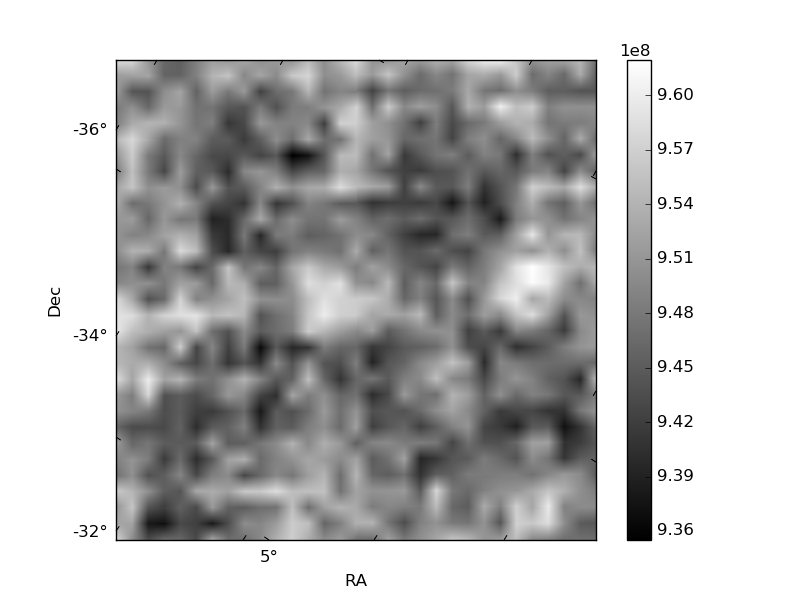
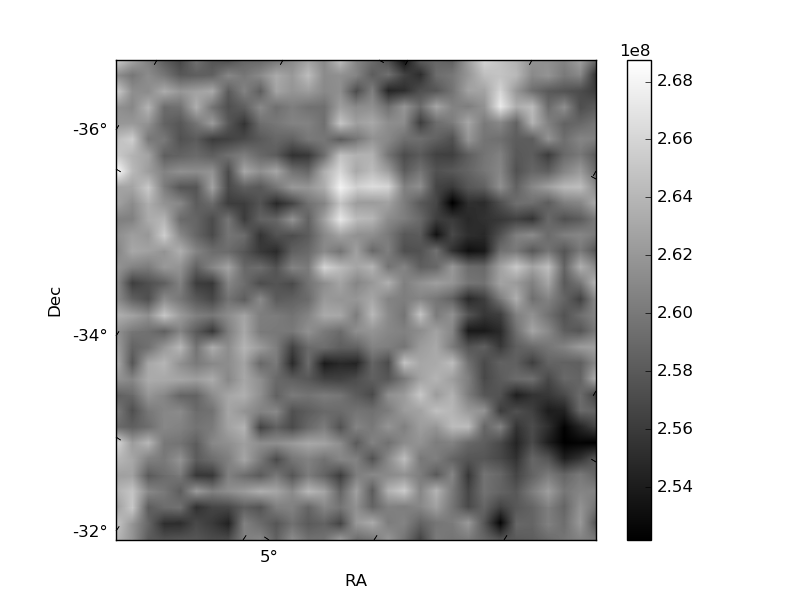
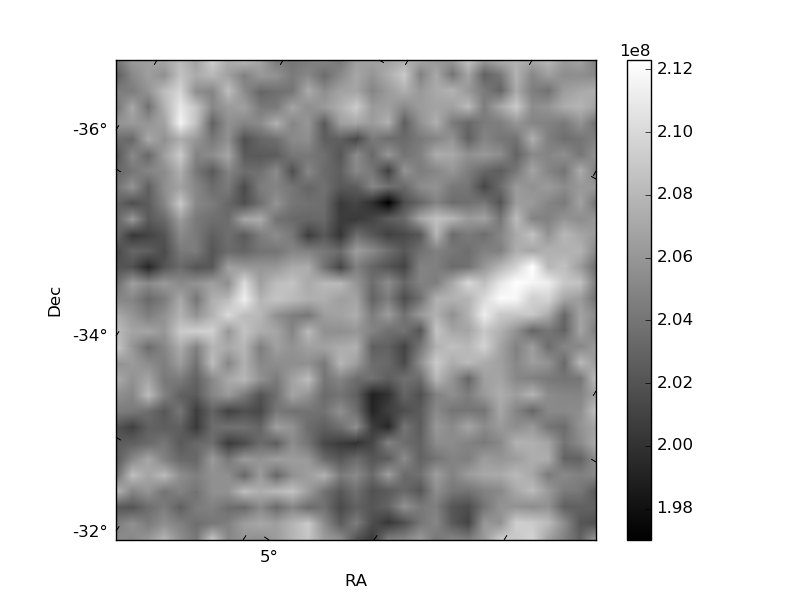
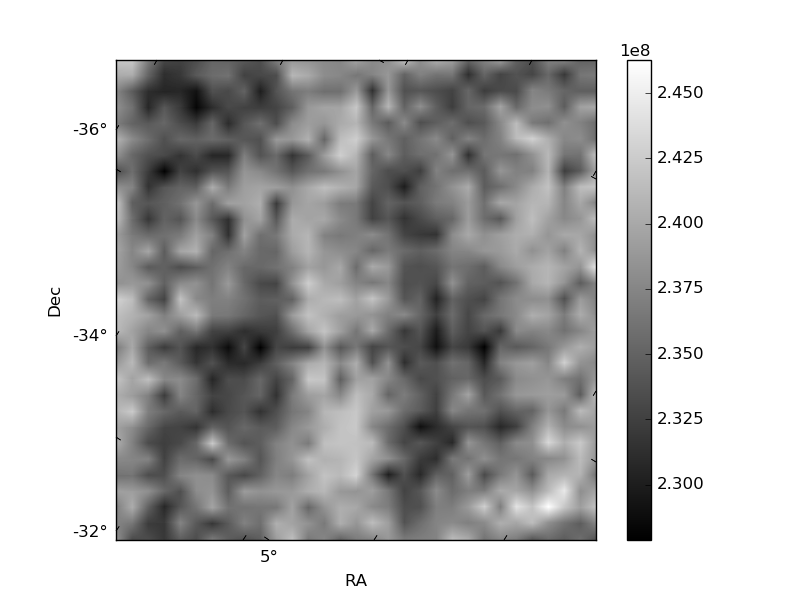
Histogram calculated using DETX and DETY for each event in the final _common_clean file
| Quadrant A | 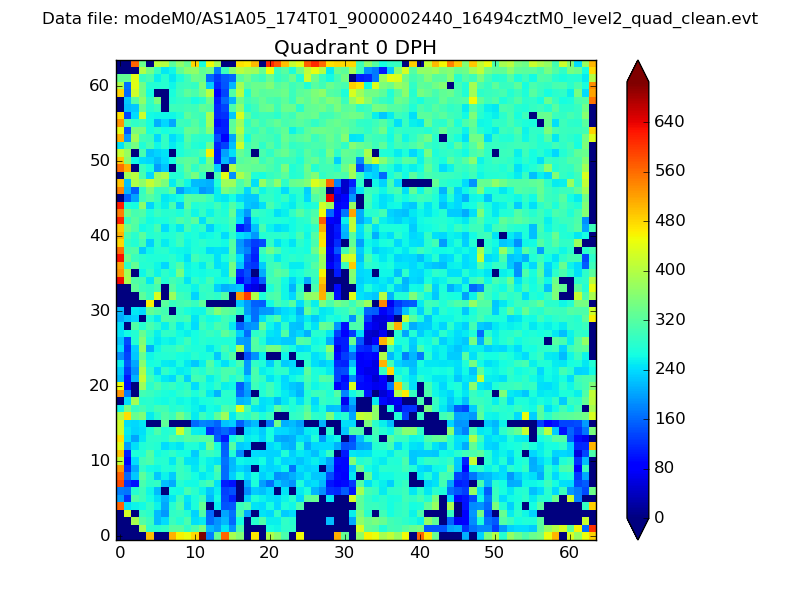 |
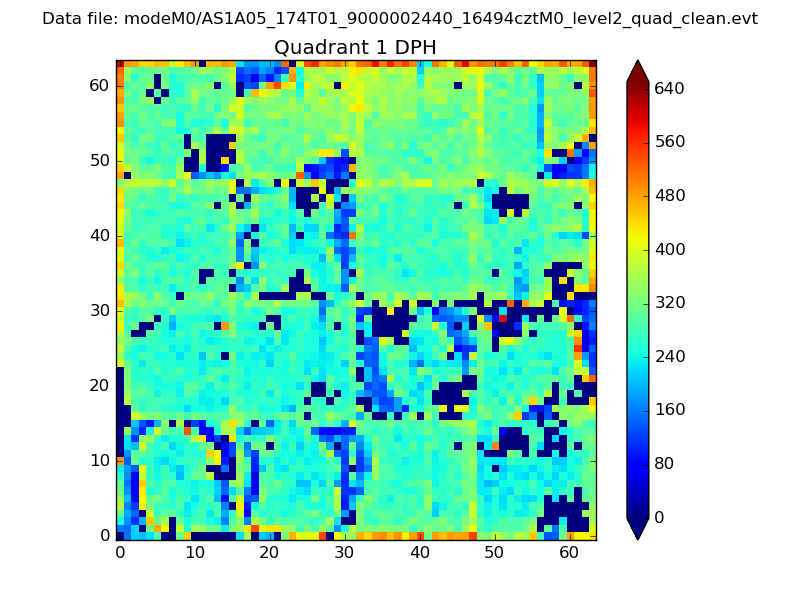 |
Quadrant B |
|---|---|---|---|
| Quadrant D | 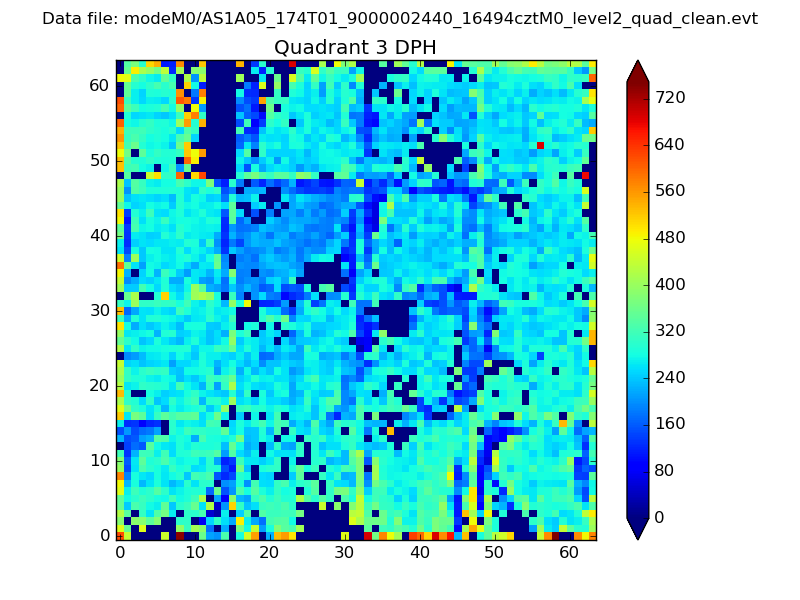 |
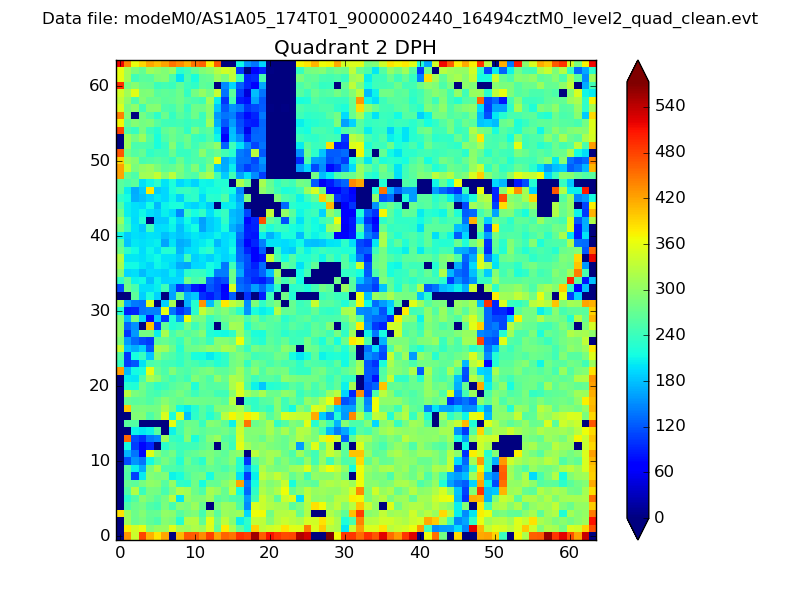 |
Quadrant C |
| Plot type | Count rate plots | Images |
|---|---|---|
| Comparison with Poisson distribution Blue bars denote a histogram of data divided into 1 sec bins. Red curve is a Poisson curve with rate = median count rate of data. |
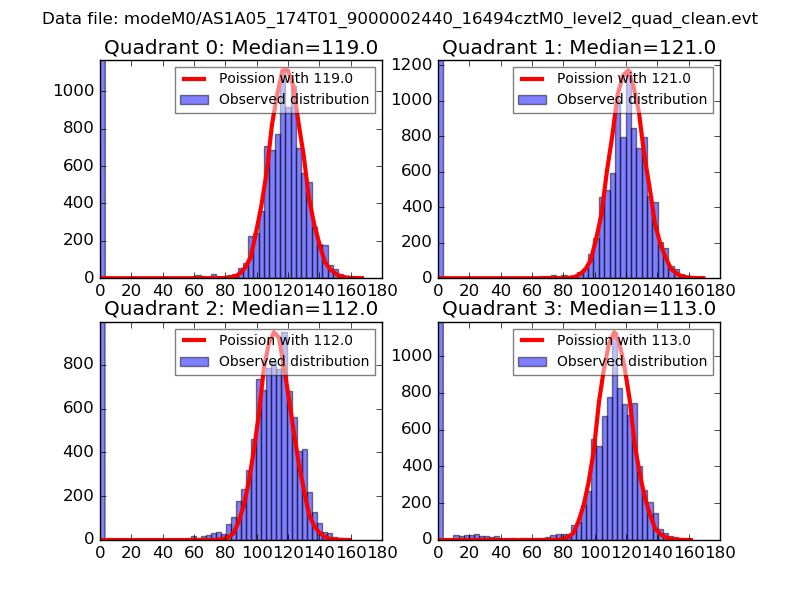 |
 |
| Quadrant-wise count rates Data is divided into 100 sec bins |
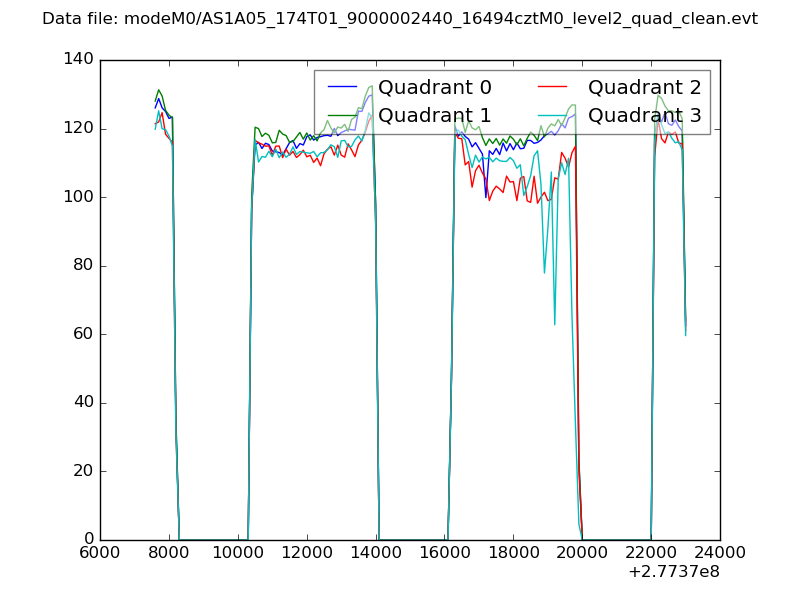 |
|
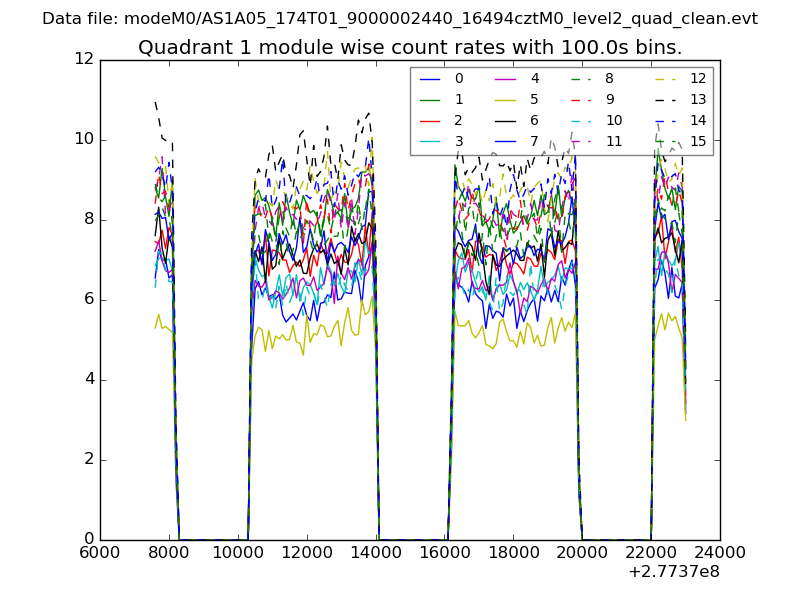
| Module-wise count rates for Quadrant A Data is divided into 100 sec bins |
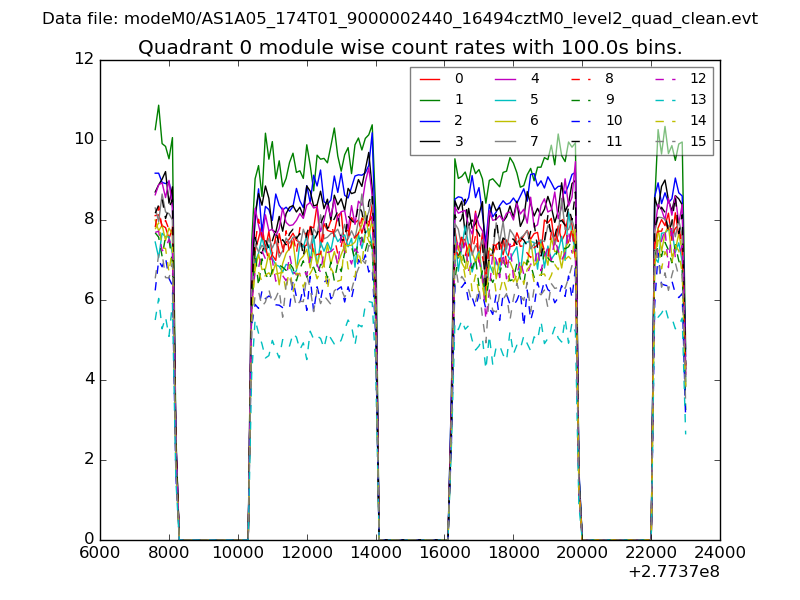 |
 |
| Module-wise count rates for Quadrant B Data is divided into 100 sec bins |
 |
 |
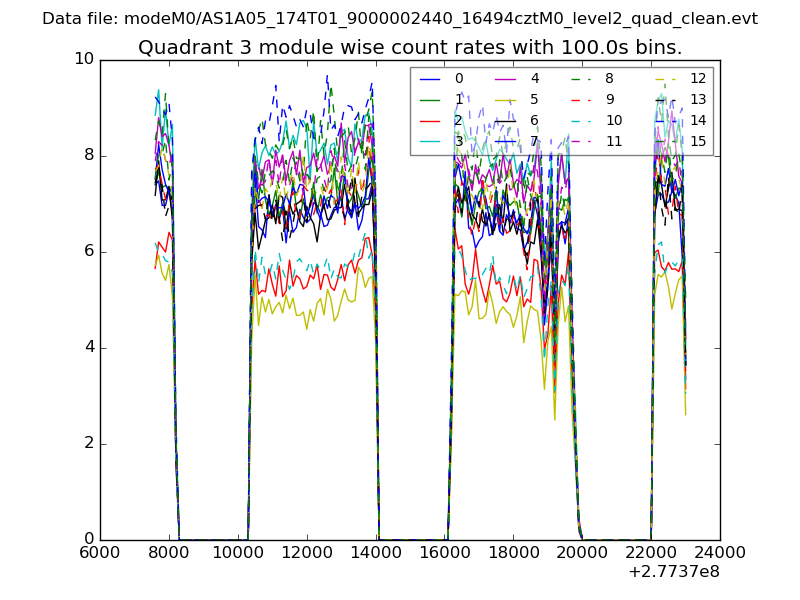
| Module-wise count rates for Quadrant C Data is divided into 100 sec bins |
 |
 |
| Module-wise count rates for Quadrant D Data is divided into 100 sec bins |
 |
 |
| Parameter | Plot |
|---|---|
| CZT HV Monitor | 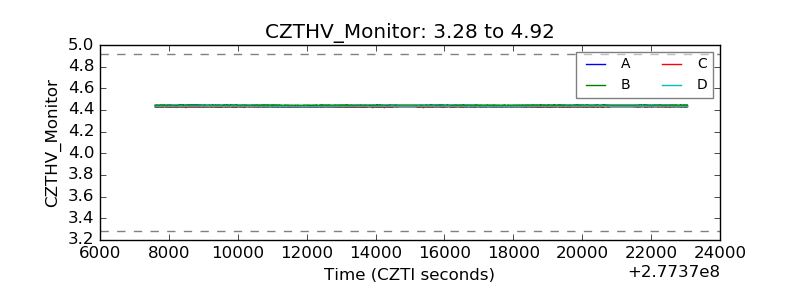 |
| D_VDD | 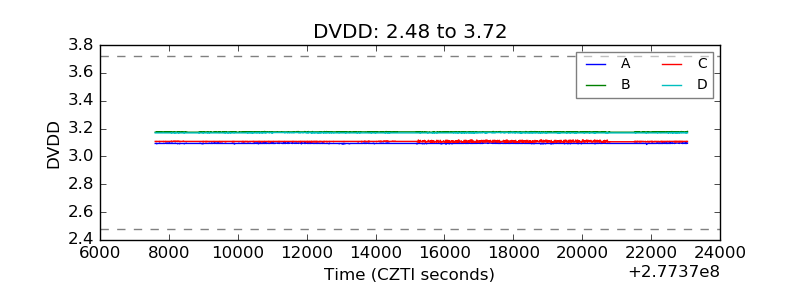 |
| Temperature 1 | 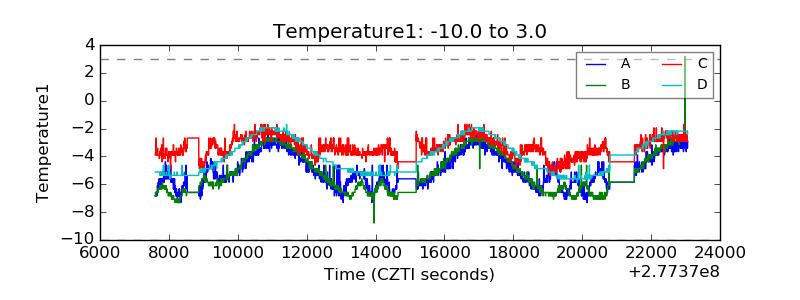 |
| Veto HV Monitor | 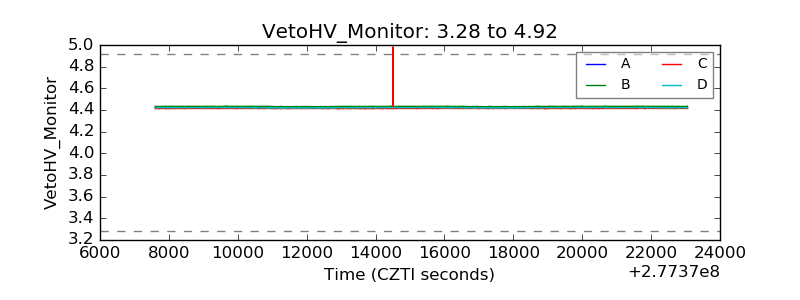 |
| Veto LLD | 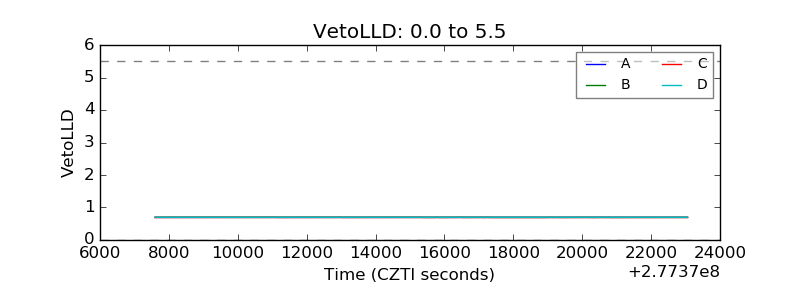 |
| Alpha Counter | 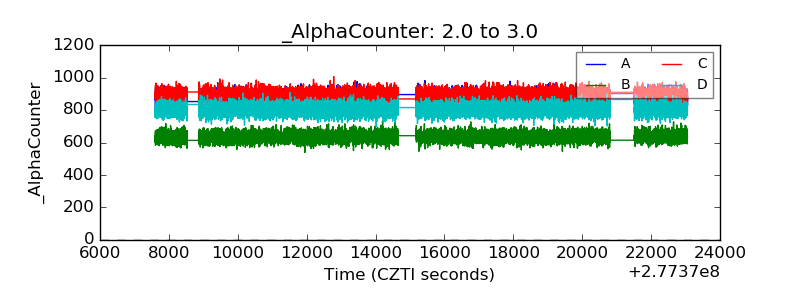 |
| _CPM_Rate | 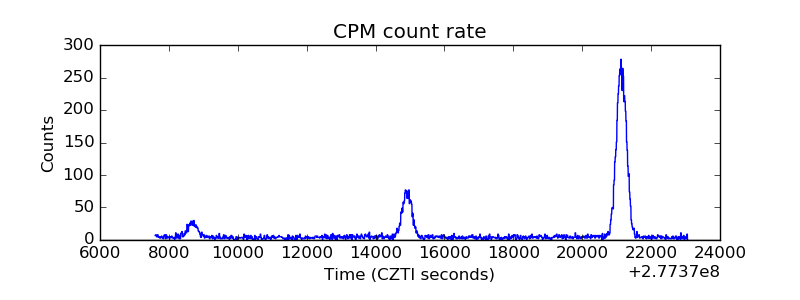 |
| CZT Counter | 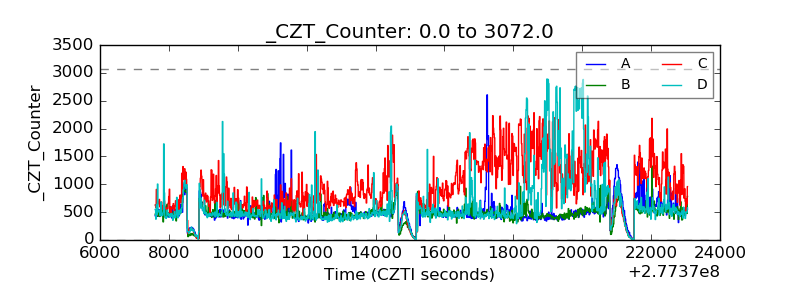 |
| +2.5 Volts monitor |  |
| +5 Volts monitor |  |
| _ROLL_ROT | 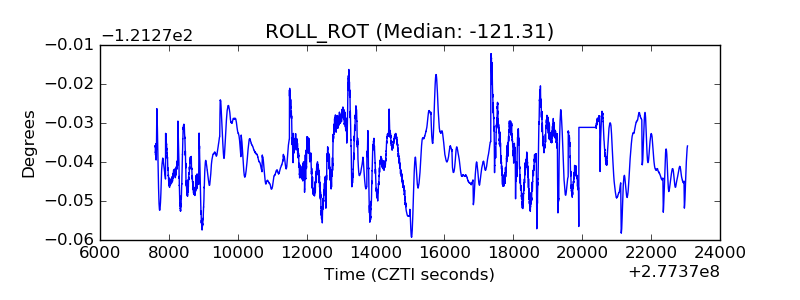 |
| _Roll_DEC | 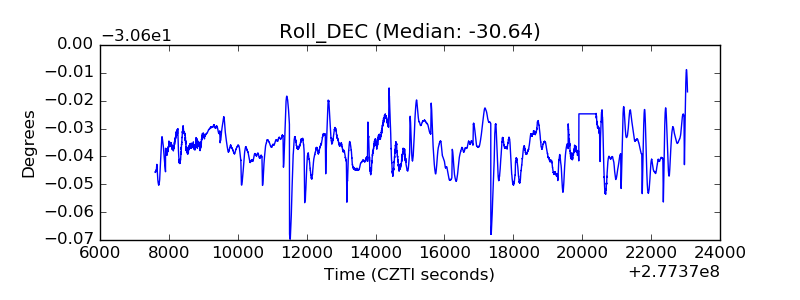 |
| _Roll_RA | 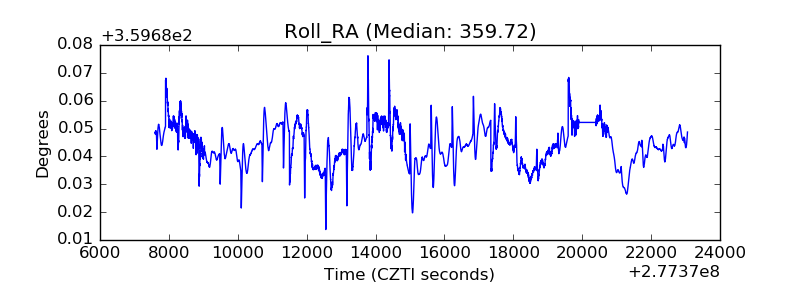 |
| Veto Counter | 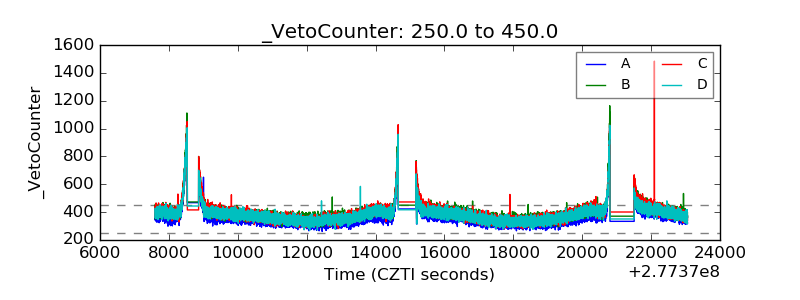 |