| Param | Original file | Final file |
|---|---|---|
| Filename | modeM0/AS1A05_174T01_9000002440_16498cztM0_level2.evt | modeM0/AS1A05_174T01_9000002440_16498cztM0_level2_quad_clean.evt |
| Size (bytes) | 541,166,400 | 98,942,400 |
| Size | 516.1 MB | 94.4 MB |
| Events in quadrant A | 3,469,134 | 646,642 |
| Events in quadrant B | 3,391,678 | 667,819 |
| Events in quadrant C | 4,344,454 | 618,706 |
| Events in quadrant D | 4,739,236 | 605,468 |
| Mode M9 | |||
|---|---|---|---|
| Quadrant | BADHDUFLAG | Total packets | Discarded packets |
| A | 0 | 13 | 0 |
| B | 0 | 13 | 0 |
| C | 0 | 13 | 0 |
| D | 0 | 14 | 0 |
| Mode SS | |||
|---|---|---|---|
| Quadrant | BADHDUFLAG | Total packets | Discarded packets |
| A | 0 | 134 | 0 |
| B | 0 | 134 | 0 |
| C | 0 | 134 | 0 |
| D | 0 | 134 | 0 |
| Mode M0 | |||
|---|---|---|---|
| Quadrant | BADHDUFLAG | Total packets | Discarded packets |
| A | 0 | 14732 | 3 |
| B | 0 | 14375 | 2 |
| C | 0 | 17776 | 2 |
| D | 0 | 18580 | 2 |
| Quadrant | Total seconds | Saturated seconds | Saturation percentage |
|---|---|---|---|
| A | 6562 | 84 | 1.280098% |
| B | 6562 | 81 | 1.234380% |
| C | 6562 | 128 | 1.950625% |
| D | 6562 | 200 | 3.047851% |
Noise dominated data is calculated using 1-second bins in cleaned event files. If a bin has >2000 counts, and if more than 50% of those come from <1% of pixels, then it is considered to be noise-dominated and hence unusable.
| Quadrant | # 1 sec bins | Bins with >0 counts | Bins with >2000 counts | High rate bins dominated by noise | Noise dominated (total time) | Noise dominated (detector-on time) | Marked lightcurve |
|---|---|---|---|---|---|---|---|
| A | 7718 | 6563 | 29 | 29 | 0.38% | 0.44% | 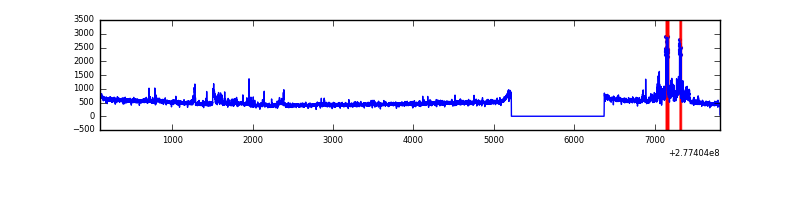 |
| B | 7718 | 6563 | 14 | 14 | 0.18% | 0.21% | 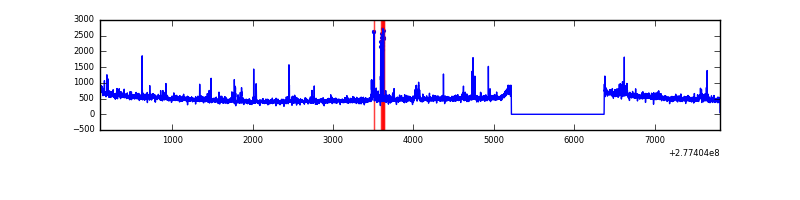 |
| C | 7718 | 6563 | 0 | 0 | 0.00% | 0.00% | 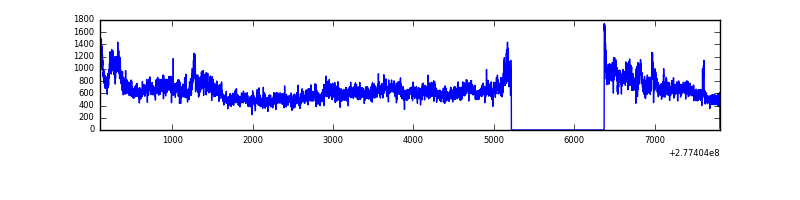 |
| D | 7718 | 6563 | 107 | 107 | 1.39% | 1.63% | 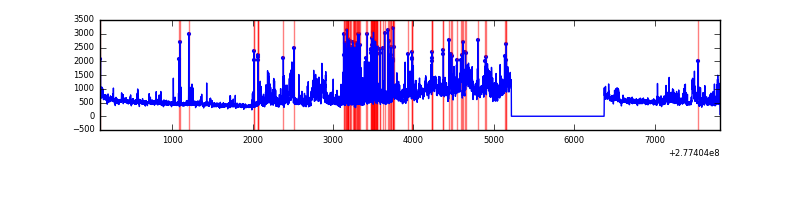 |
Top three noisy pixels from each quadrant. If the there are fewer than three noisy pixels in the level2.evt file, extra rows are filled as -1
| Pixel properties | Quadrant properties | ||||||
|---|---|---|---|---|---|---|---|
| Quadrant | DetID | PixID | Counts | Sigma | Mean | Median | Sigma |
| A | 15 | 174 | 356822 | 2184.53 | 809 | 795 | 163.0 |
| A | 0 | 226 | 7078 | 38.55 | 809 | 795 | 163.0 |
| A | 3 | 137 | 5971 | 31.76 | 809 | 795 | 163.0 |
| B | 10 | 16 | 74745 | 477.38 | 813 | 795 | 154.9 |
| B | 15 | 35 | 60585 | 385.97 | 813 | 795 | 154.9 |
| B | 0 | 198 | 21047 | 130.74 | 813 | 795 | 154.9 |
| C | 3 | 233 | 1240696 | 6930.97 | 764 | 770 | 178.9 |
| C | 14 | 238 | 118324 | 657.11 | 764 | 770 | 178.9 |
| C | 7 | 247 | 9514 | 48.88 | 764 | 770 | 178.9 |
| D | 5 | 222 | 1611028 | 8531.12 | 768 | 747 | 188.8 |
| D | 12 | 218 | 91857 | 482.69 | 768 | 747 | 188.8 |
| D | 8 | 195 | 63050 | 330.08 | 768 | 747 | 188.8 |
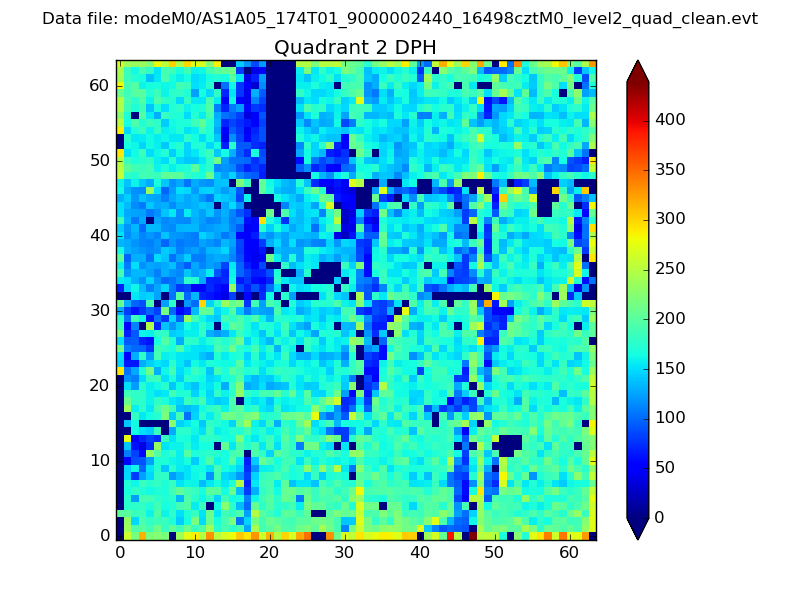
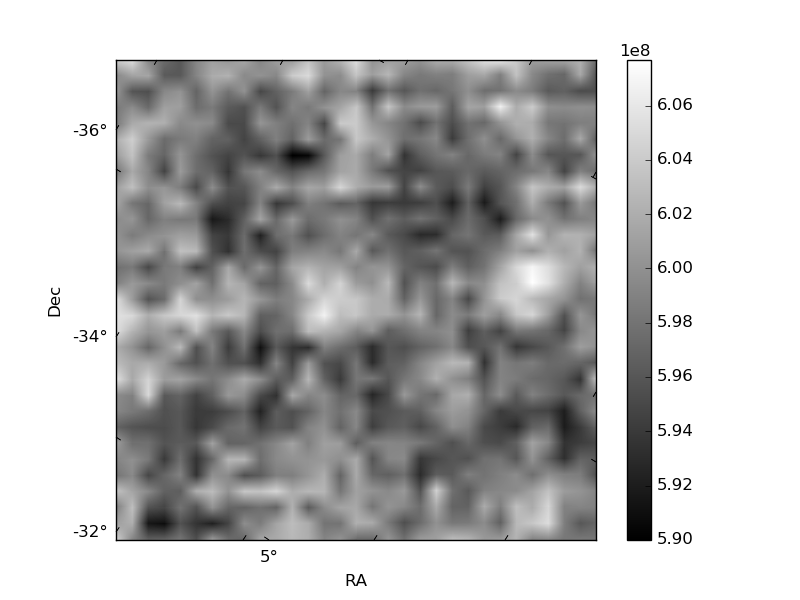
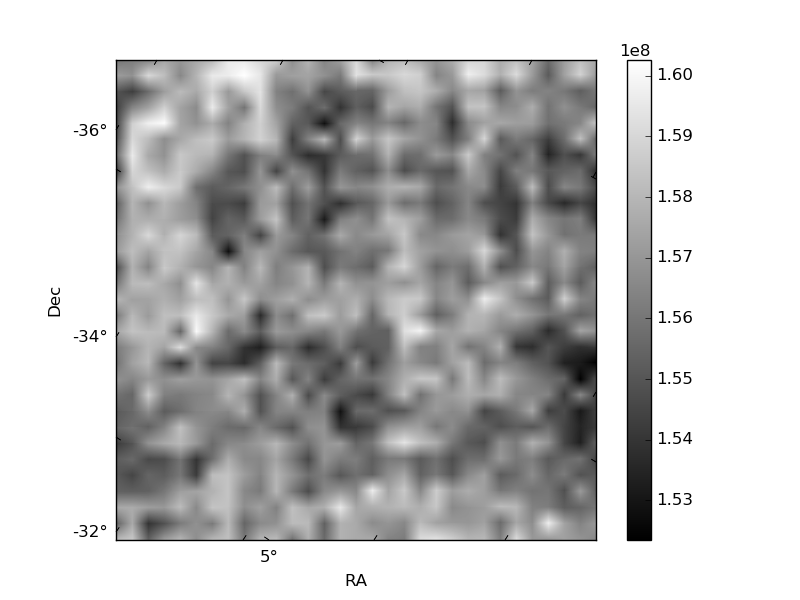
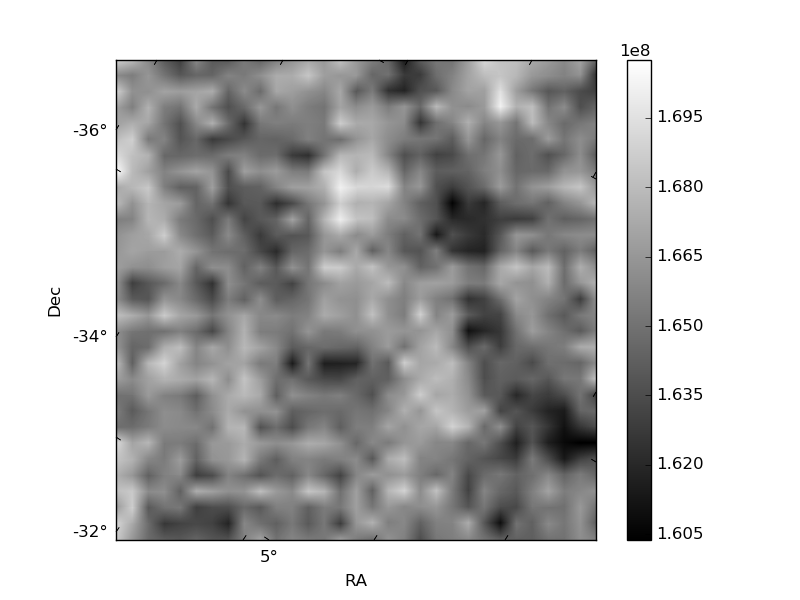
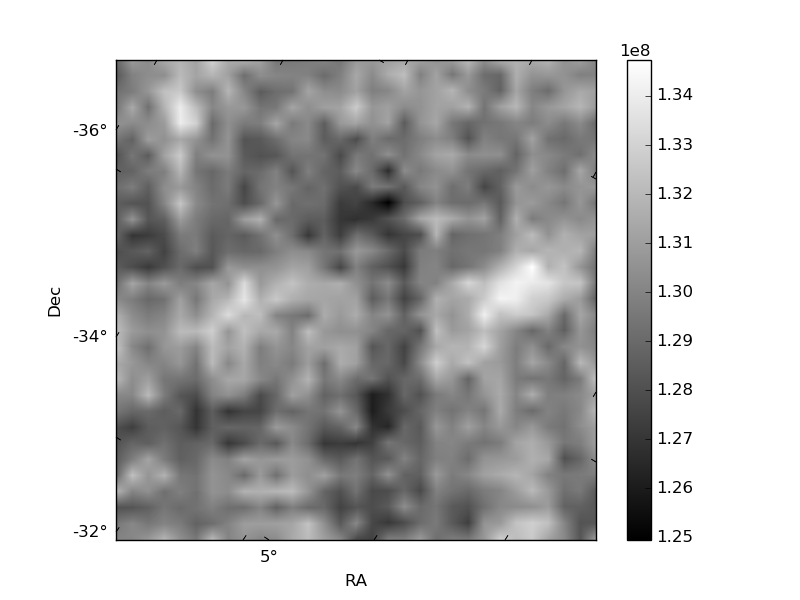
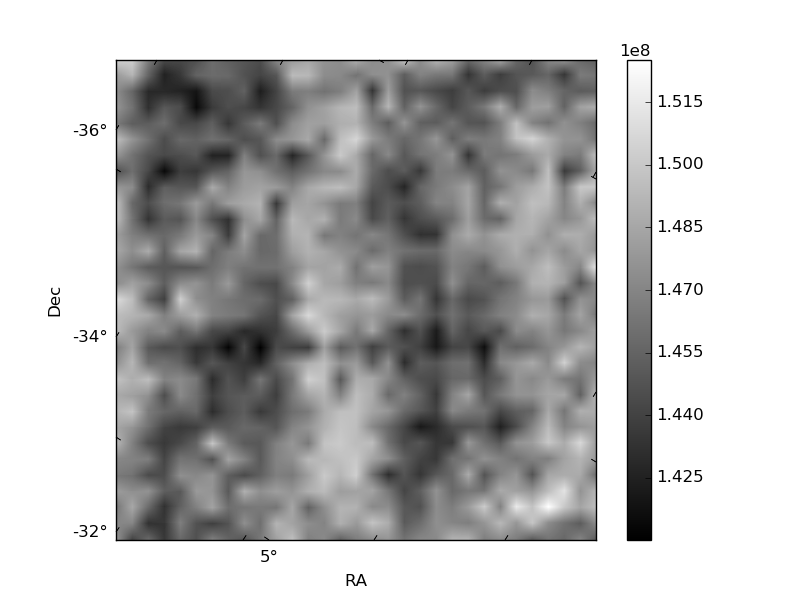
Histogram calculated using DETX and DETY for each event in the final _common_clean file
| Quadrant A | 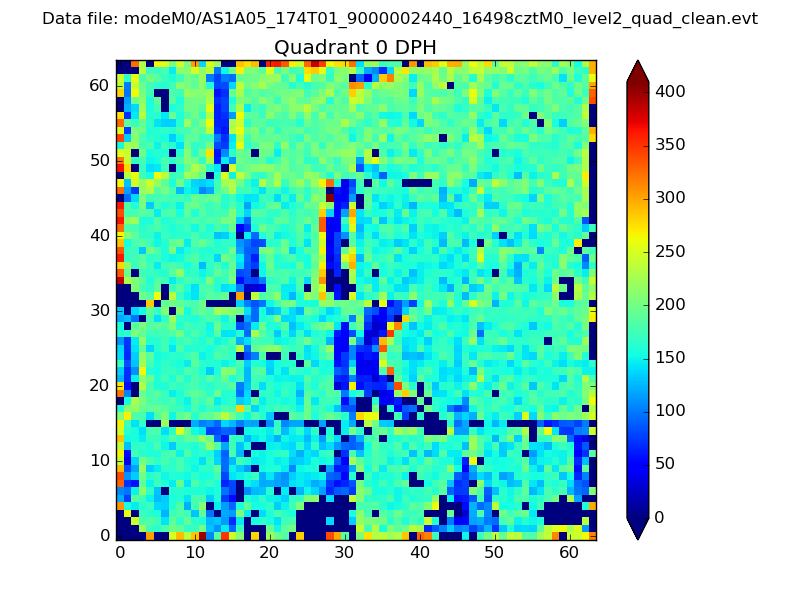 |
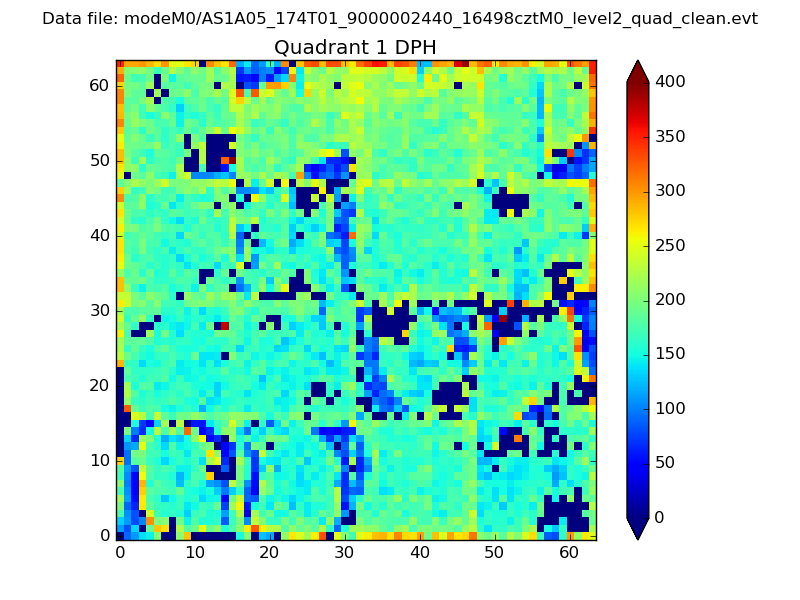 |
Quadrant B |
|---|---|---|---|
| Quadrant D | 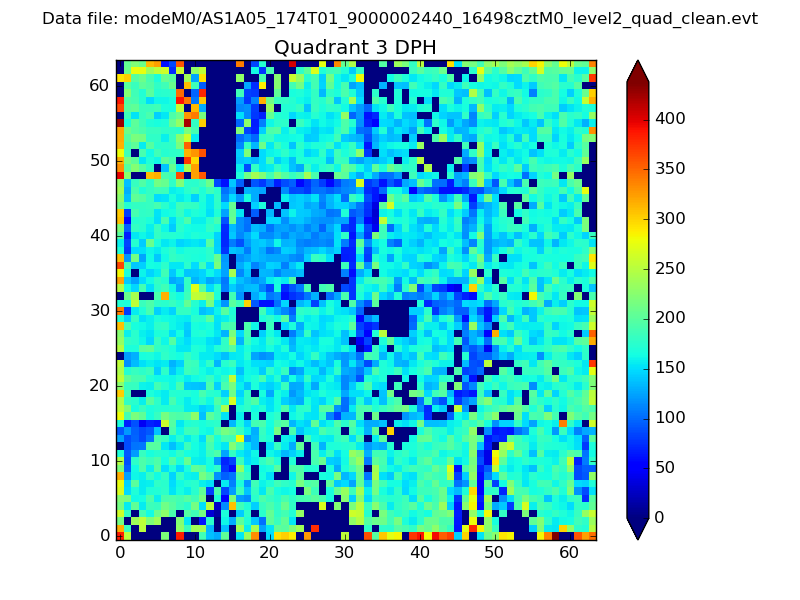 |
 |
Quadrant C |
| Plot type | Count rate plots | Images |
|---|---|---|
| Comparison with Poisson distribution Blue bars denote a histogram of data divided into 1 sec bins. Red curve is a Poisson curve with rate = median count rate of data. |
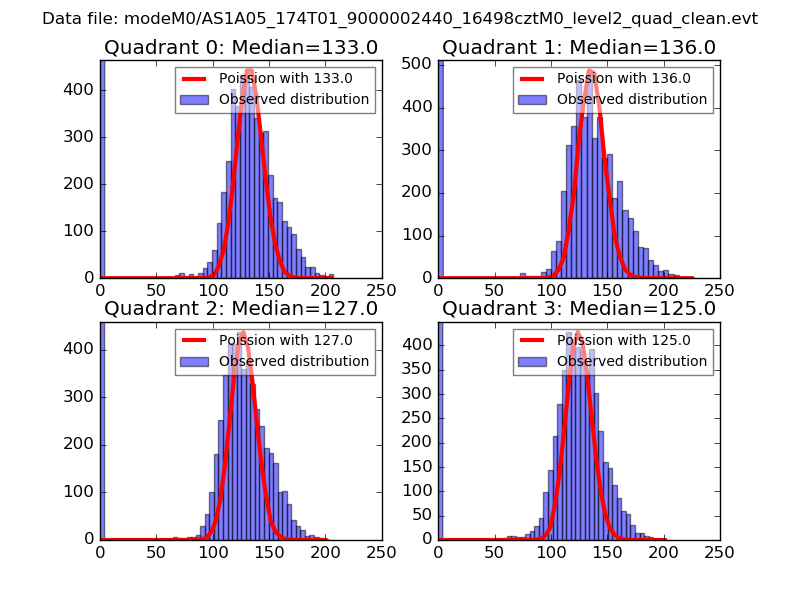 |
 |
| Quadrant-wise count rates Data is divided into 100 sec bins |
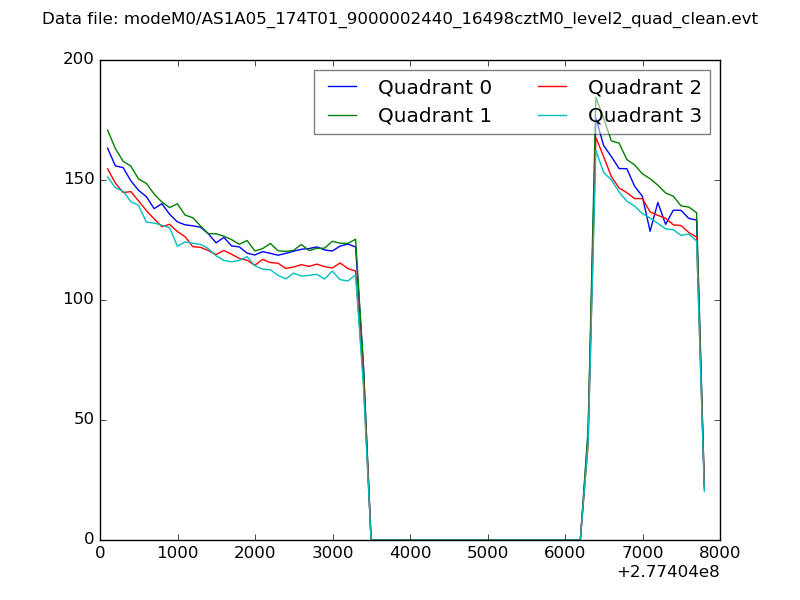 |
|
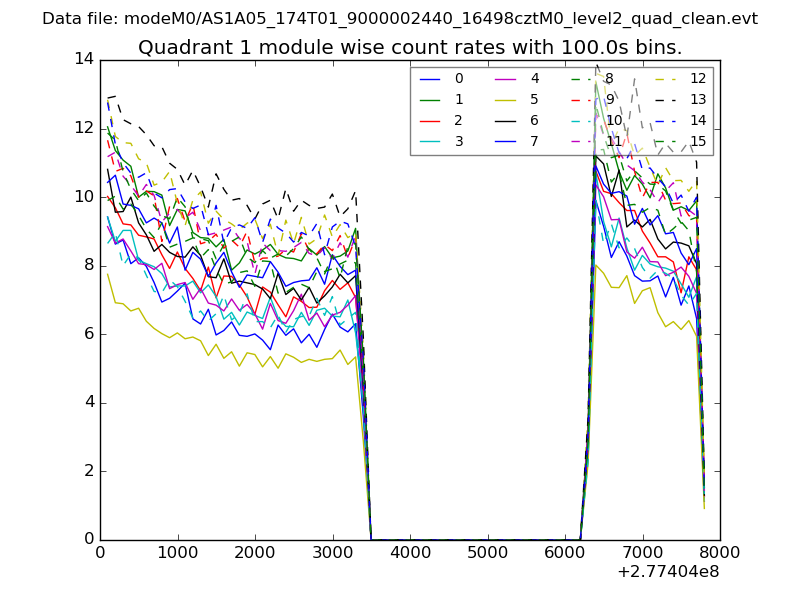
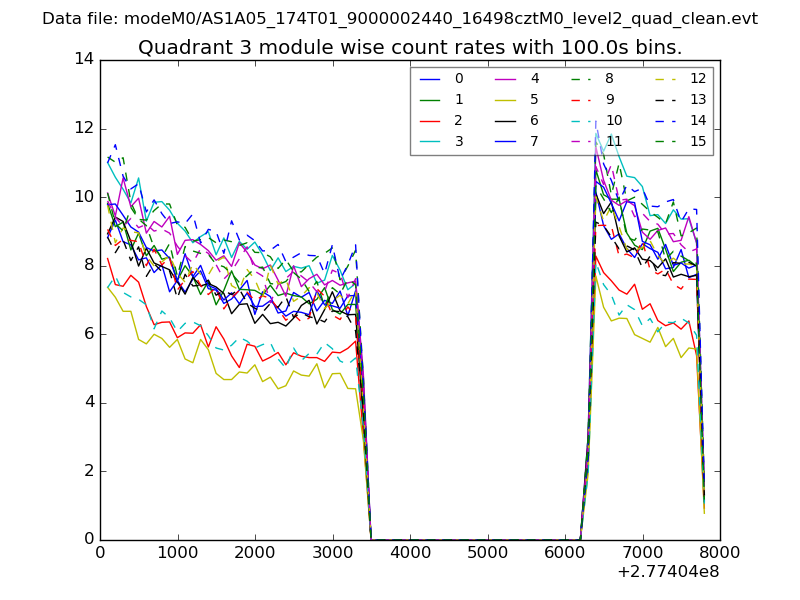
| Module-wise count rates for Quadrant A Data is divided into 100 sec bins |
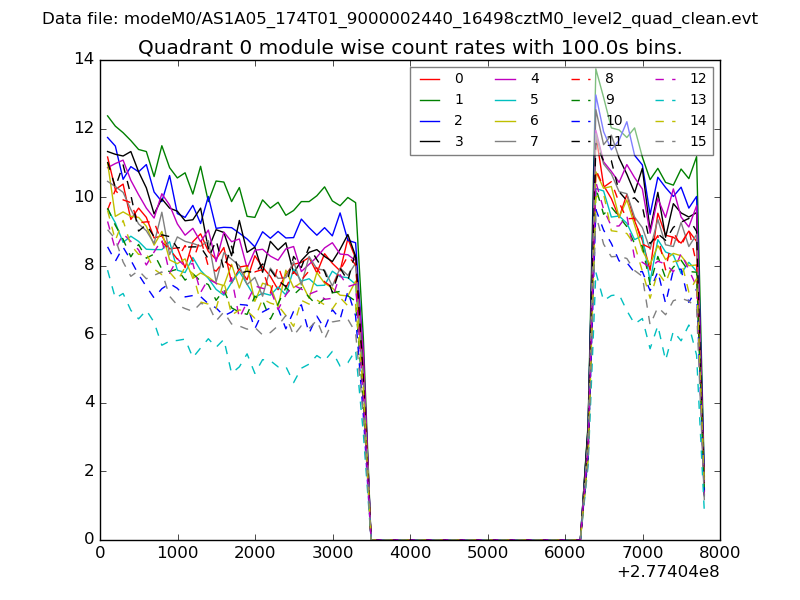 |
 |
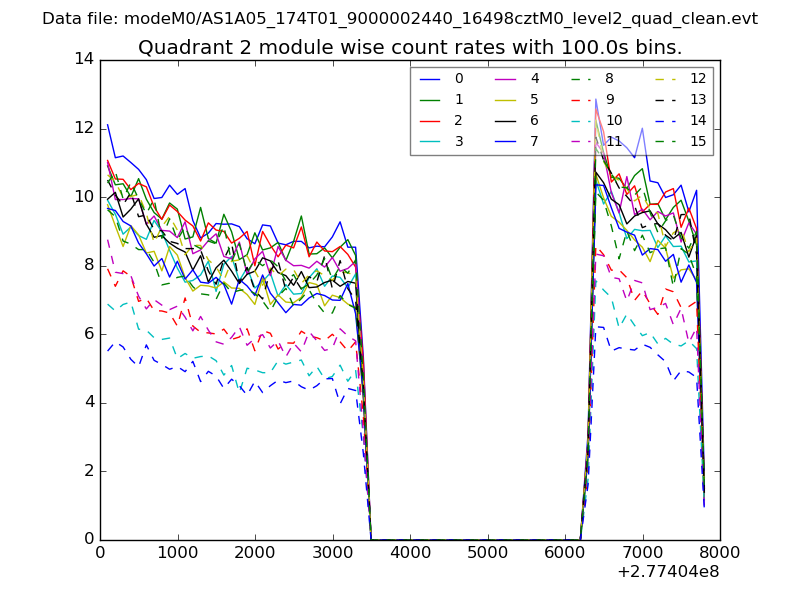
| Module-wise count rates for Quadrant B Data is divided into 100 sec bins |
 |
 |
| Module-wise count rates for Quadrant C Data is divided into 100 sec bins |
 |
 |
| Module-wise count rates for Quadrant D Data is divided into 100 sec bins |
 |
 |
| Parameter | Plot |
|---|---|
| CZT HV Monitor | 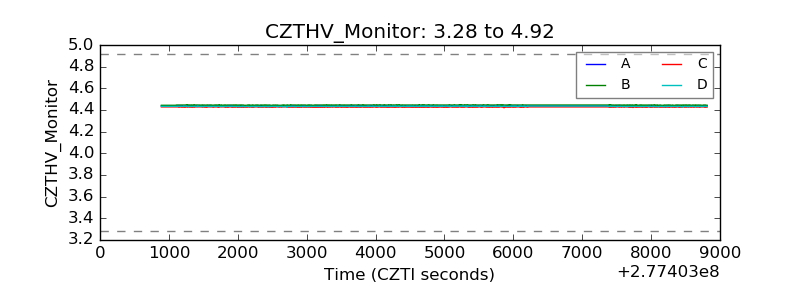 |
| D_VDD | 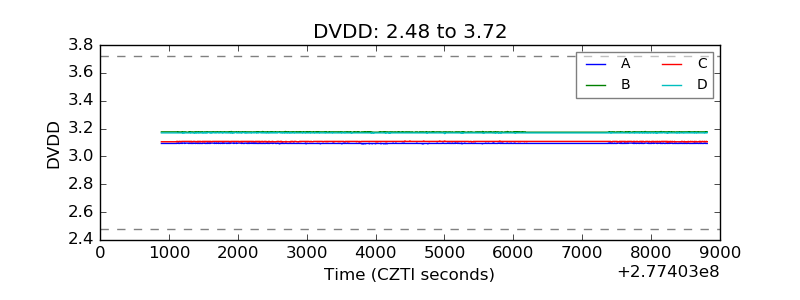 |
| Temperature 1 | 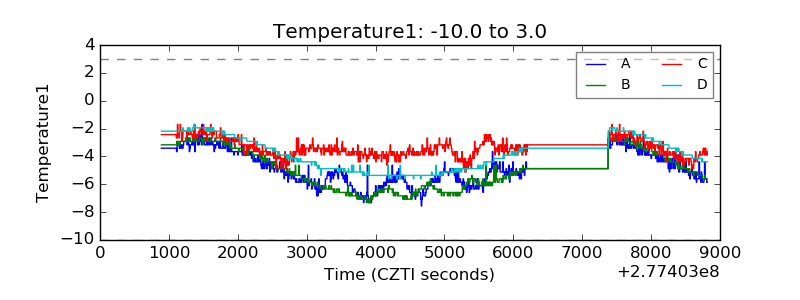 |
| Veto HV Monitor | 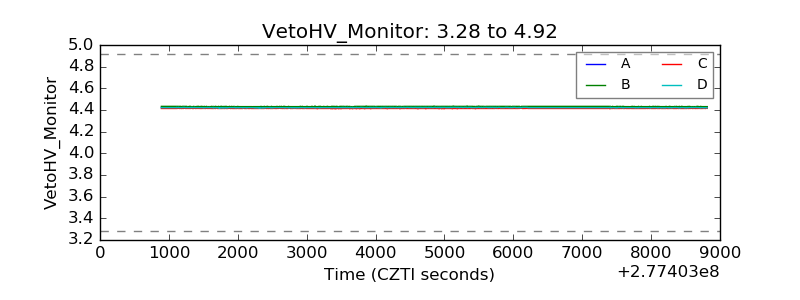 |
| Veto LLD | 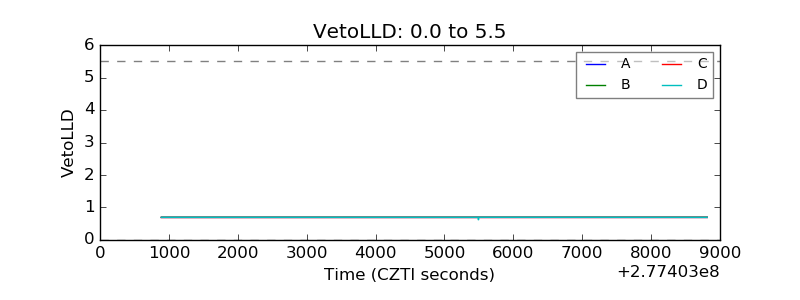 |
| Alpha Counter |  |
| _CPM_Rate | 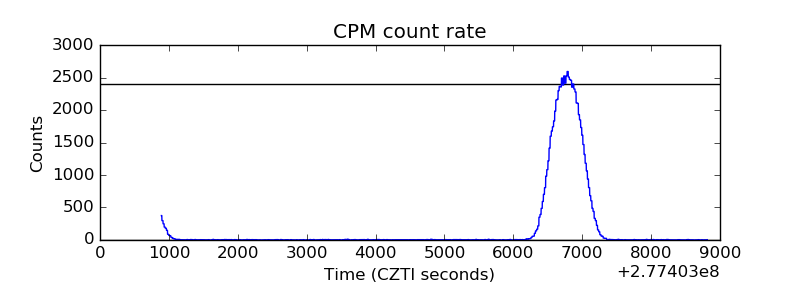 |
| CZT Counter | 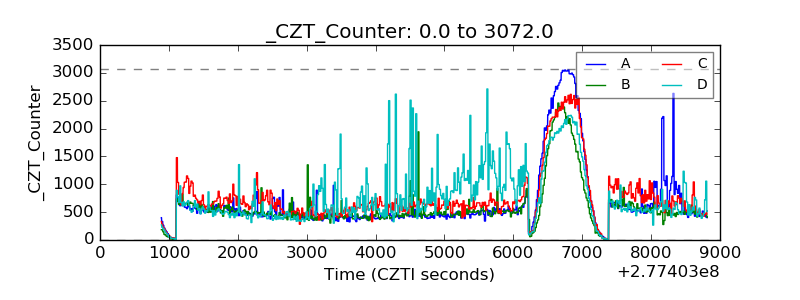 |
| +2.5 Volts monitor | 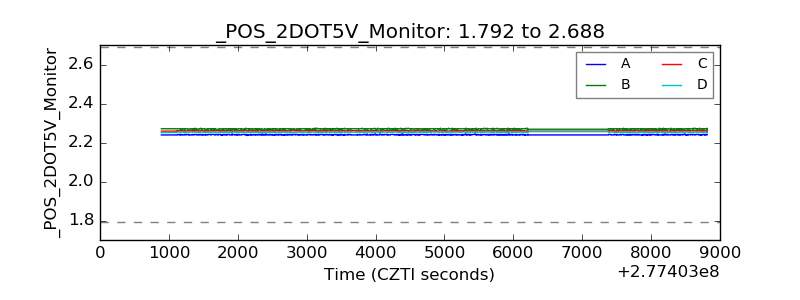 |
| +5 Volts monitor |  |
| _ROLL_ROT | 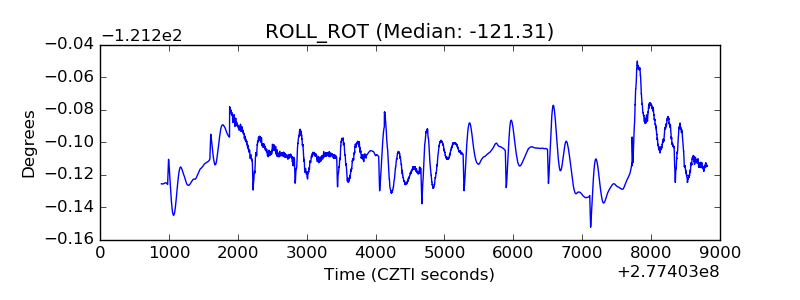 |
| _Roll_DEC | 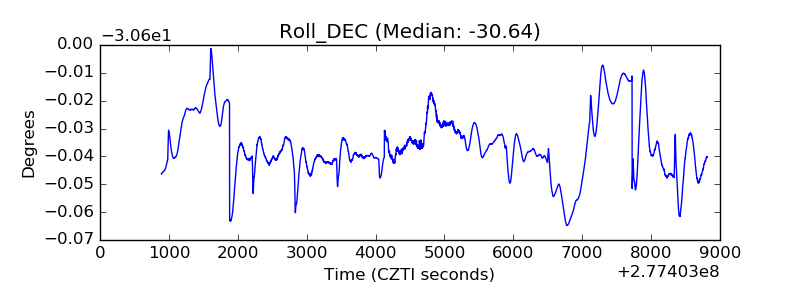 |
| _Roll_RA | 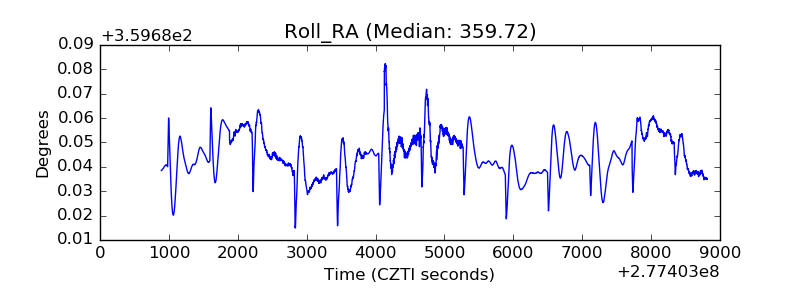 |
| Veto Counter | 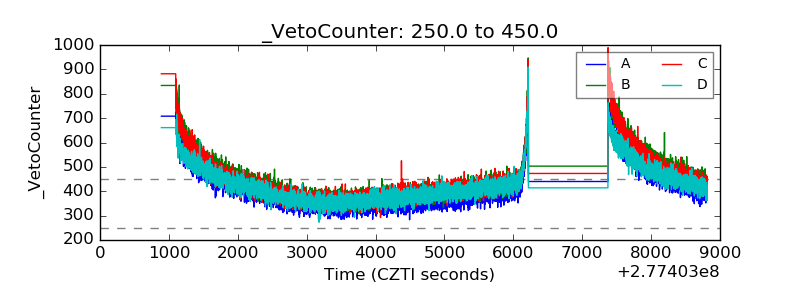 |