| Param | Original file | Final file |
|---|---|---|
| Filename | modeM0/AS1A05_174T01_9000002440_16501cztM0_level2.evt | modeM0/AS1A05_174T01_9000002440_16501cztM0_level2_quad_clean.evt |
| Size (bytes) | 475,804,800 | 95,103,360 |
| Size | 453.8 MB | 90.7 MB |
| Events in quadrant A | 3,349,422 | 612,693 |
| Events in quadrant B | 3,354,308 | 636,429 |
| Events in quadrant C | 3,506,895 | 601,955 |
| Events in quadrant D | 3,760,715 | 578,552 |
| Mode M9 | |||
|---|---|---|---|
| Quadrant | BADHDUFLAG | Total packets | Discarded packets |
| A | 0 | 21 | 0 |
| B | 0 | 21 | 0 |
| C | 0 | 21 | 0 |
| D | 0 | 22 | 0 |
| Mode SS | |||
|---|---|---|---|
| Quadrant | BADHDUFLAG | Total packets | Discarded packets |
| A | 0 | 130 | 0 |
| B | 0 | 130 | 0 |
| C | 0 | 130 | 0 |
| D | 0 | 130 | 0 |
| Mode M0 | |||
|---|---|---|---|
| Quadrant | BADHDUFLAG | Total packets | Discarded packets |
| A | 0 | 13920 | 3 |
| B | 0 | 14010 | 2 |
| C | 0 | 14473 | 2 |
| D | 0 | 15654 | 2 |
| Quadrant | Total seconds | Saturated seconds | Saturation percentage |
|---|---|---|---|
| A | 6461 | 18 | 0.278595% |
| B | 6461 | 37 | 0.572667% |
| C | 6461 | 31 | 0.479802% |
| D | 6461 | 195 | 3.018109% |
Noise dominated data is calculated using 1-second bins in cleaned event files. If a bin has >2000 counts, and if more than 50% of those come from <1% of pixels, then it is considered to be noise-dominated and hence unusable.
| Quadrant | # 1 sec bins | Bins with >0 counts | Bins with >2000 counts | High rate bins dominated by noise | Noise dominated (total time) | Noise dominated (detector-on time) | Marked lightcurve |
|---|---|---|---|---|---|---|---|
| A | 7822 | 6463 | 0 | 0 | 0.00% | 0.00% | 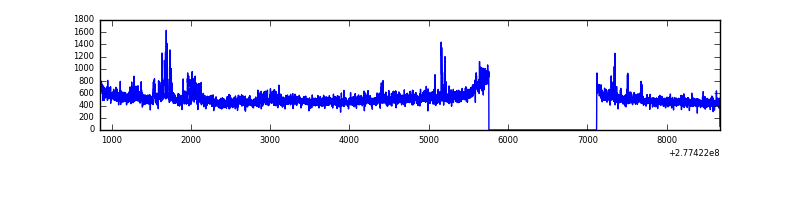 |
| B | 7822 | 6463 | 3 | 3 | 0.04% | 0.05% | 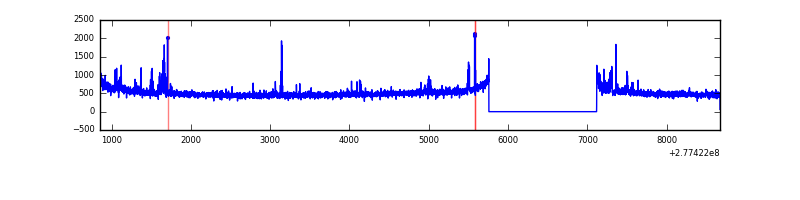 |
| C | 7822 | 6463 | 1 | 1 | 0.01% | 0.02% | 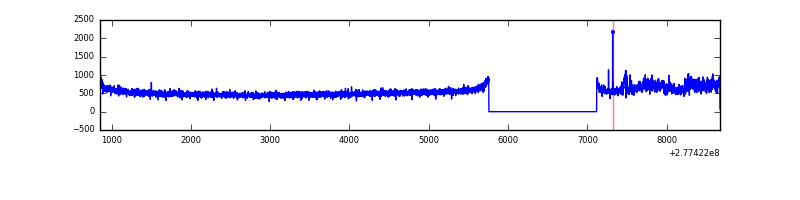 |
| D | 7822 | 6463 | 134 | 134 | 1.71% | 2.07% | 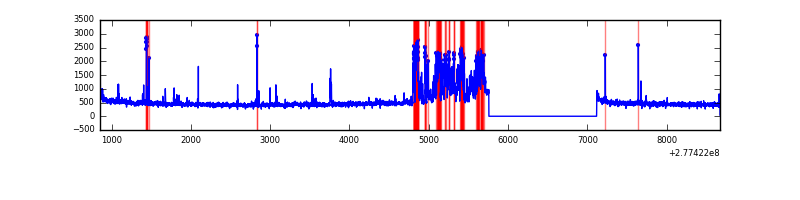 |
Top three noisy pixels from each quadrant. If the there are fewer than three noisy pixels in the level2.evt file, extra rows are filled as -1
| Pixel properties | Quadrant properties | ||||||
|---|---|---|---|---|---|---|---|
| Quadrant | DetID | PixID | Counts | Sigma | Mean | Median | Sigma |
| A | 15 | 174 | 224082 | 1380.85 | 804 | 789 | 161.7 |
| A | 3 | 1 | 30071 | 181.08 | 804 | 789 | 161.7 |
| A | 0 | 226 | 7168 | 39.44 | 804 | 789 | 161.7 |
| B | 0 | 198 | 49839 | 321.18 | 815 | 797 | 152.7 |
| B | 15 | 35 | 48188 | 310.37 | 815 | 797 | 152.7 |
| B | 5 | 236 | 28123 | 178.96 | 815 | 797 | 152.7 |
| C | 7 | 247 | 282464 | 1549.41 | 781 | 789 | 181.8 |
| C | 14 | 238 | 122246 | 668.1 | 781 | 789 | 181.8 |
| C | 3 | 233 | 57532 | 312.13 | 781 | 789 | 181.8 |
| D | 13 | 249 | 705083 | 3756.54 | 774 | 752 | 187.5 |
| D | 5 | 222 | 55853 | 293.88 | 774 | 752 | 187.5 |
| D | 2 | 33 | 40465 | 211.81 | 774 | 752 | 187.5 |
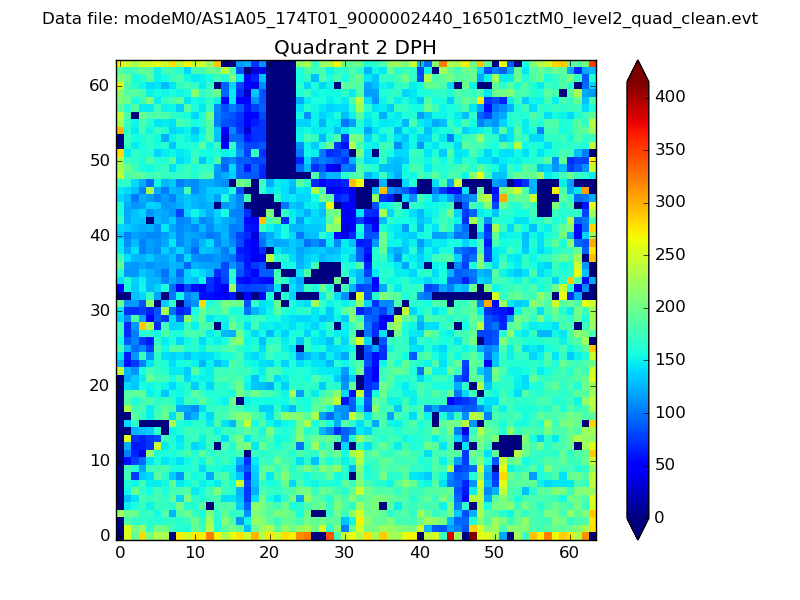
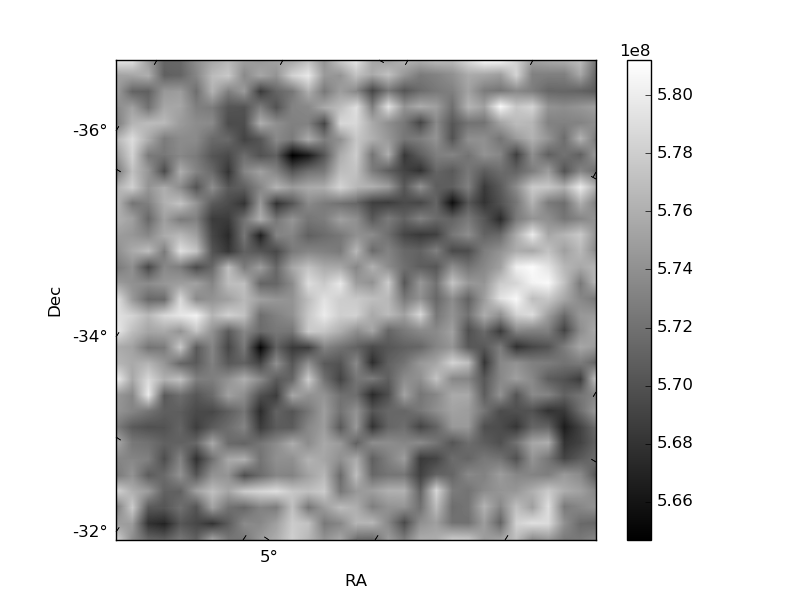
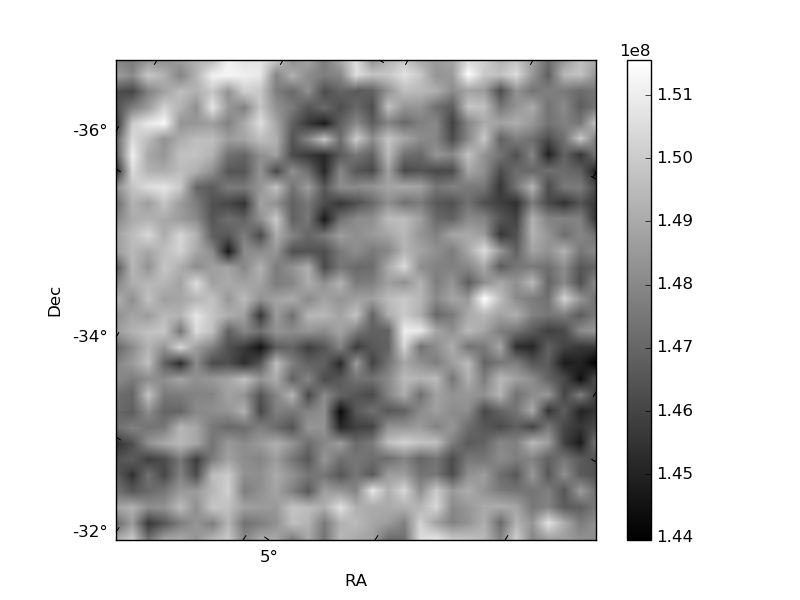
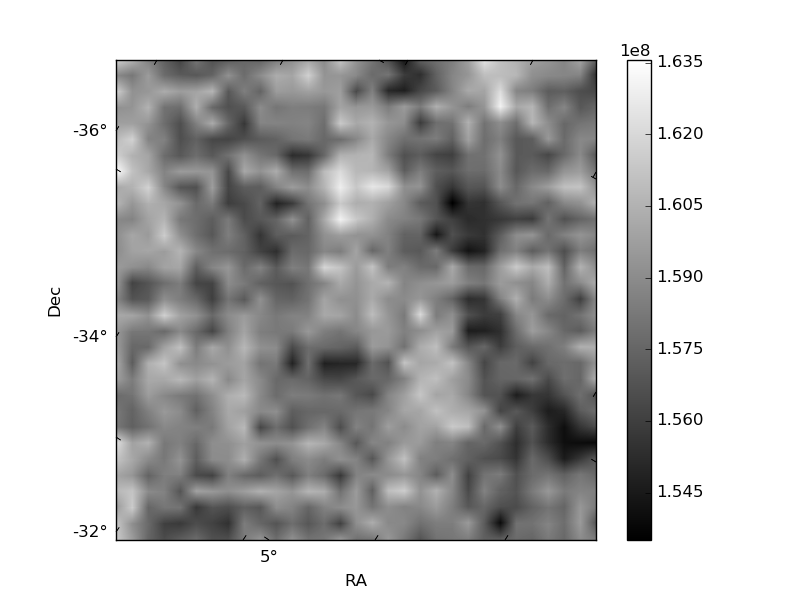
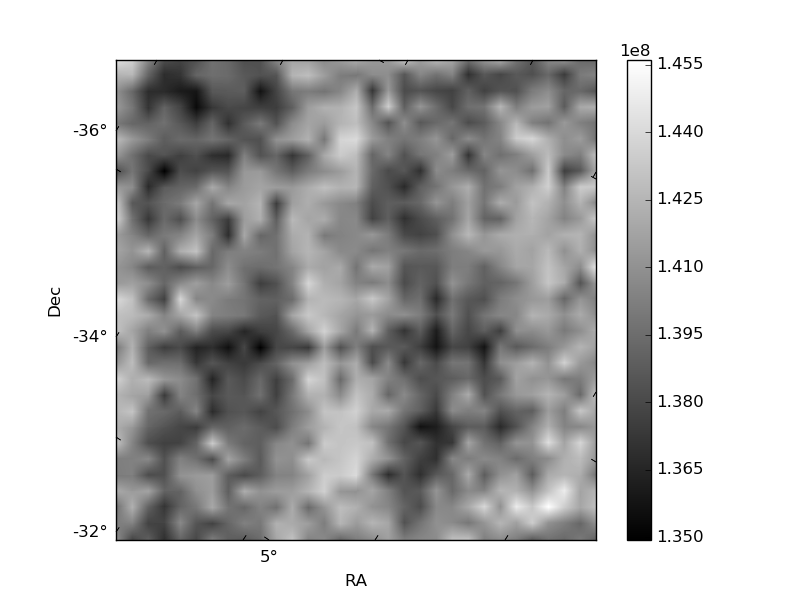
Histogram calculated using DETX and DETY for each event in the final _common_clean file
| Quadrant A | 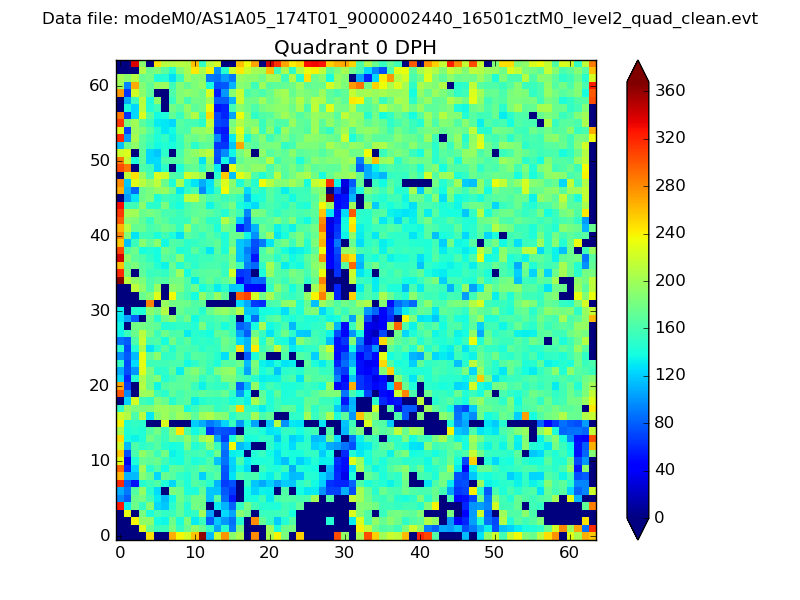 |
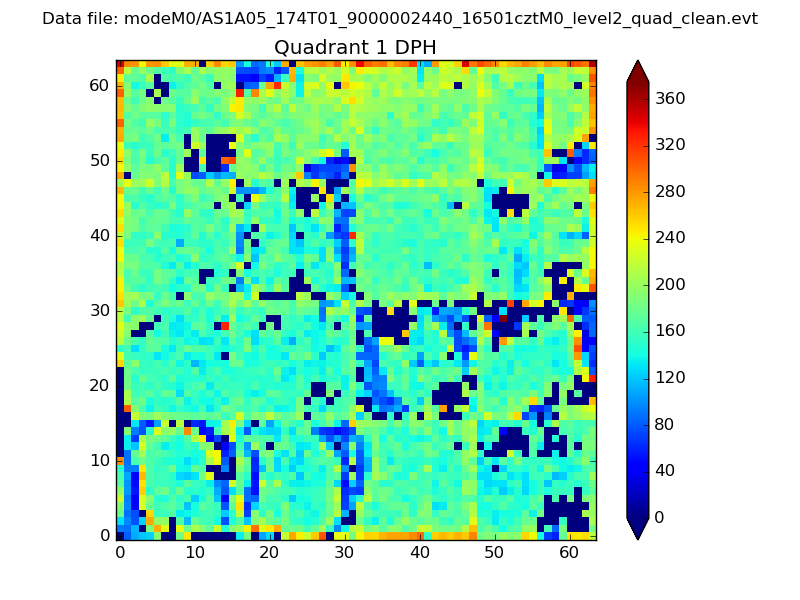 |
Quadrant B |
|---|---|---|---|
| Quadrant D | 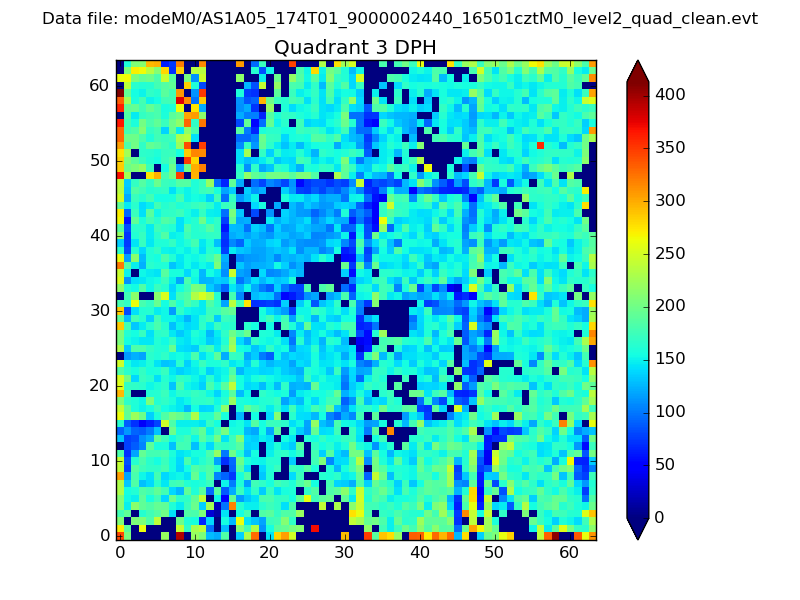 |
 |
Quadrant C |
| Plot type | Count rate plots | Images |
|---|---|---|
| Comparison with Poisson distribution Blue bars denote a histogram of data divided into 1 sec bins. Red curve is a Poisson curve with rate = median count rate of data. |
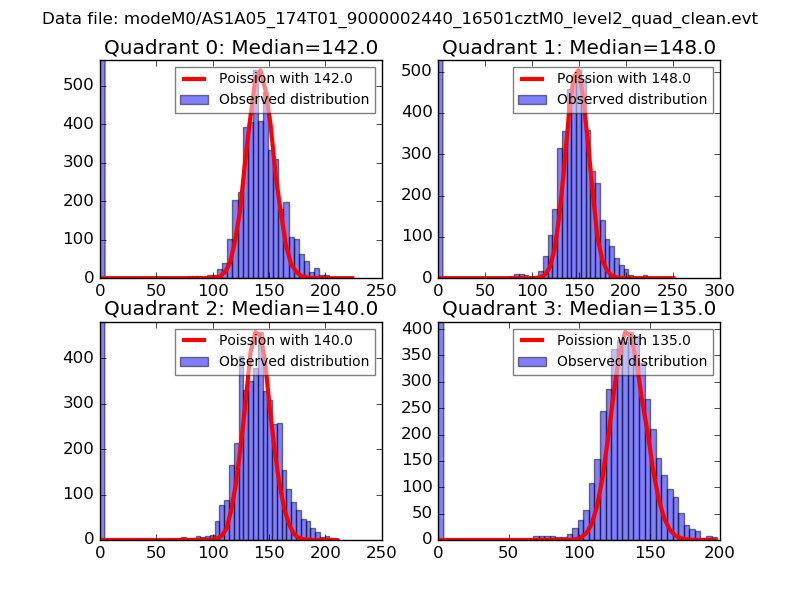 |
 |
| Quadrant-wise count rates Data is divided into 100 sec bins |
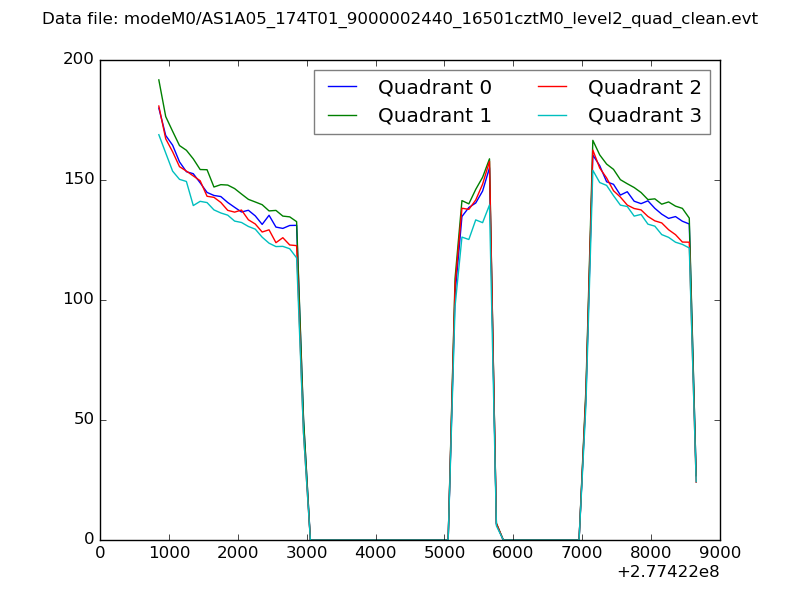 |
|
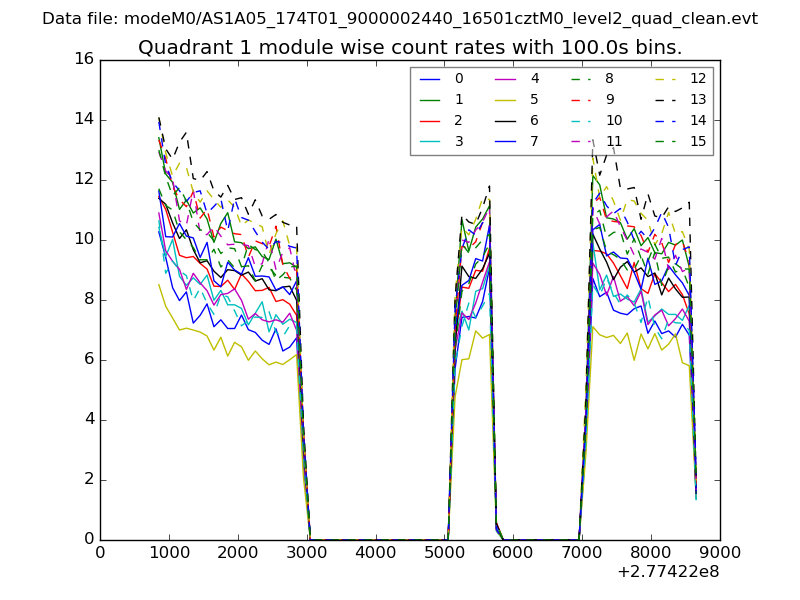
| Module-wise count rates for Quadrant A Data is divided into 100 sec bins |
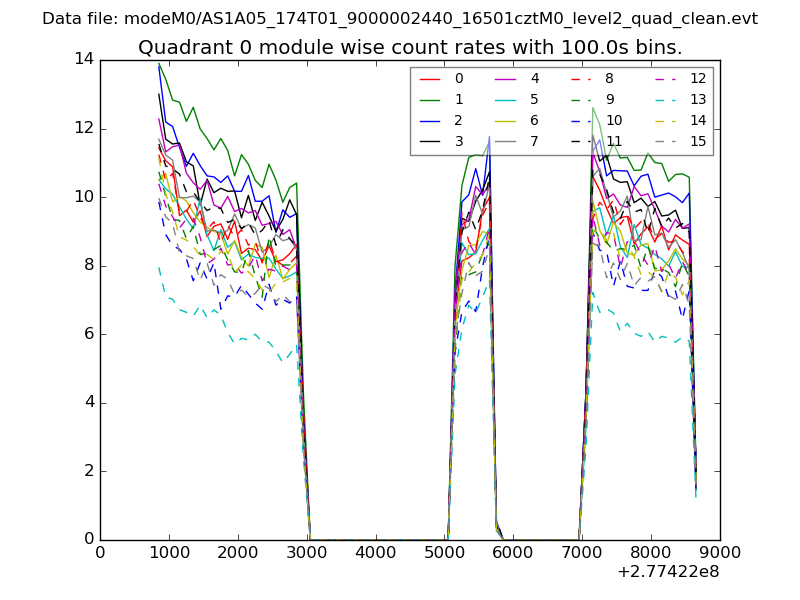 |
 |
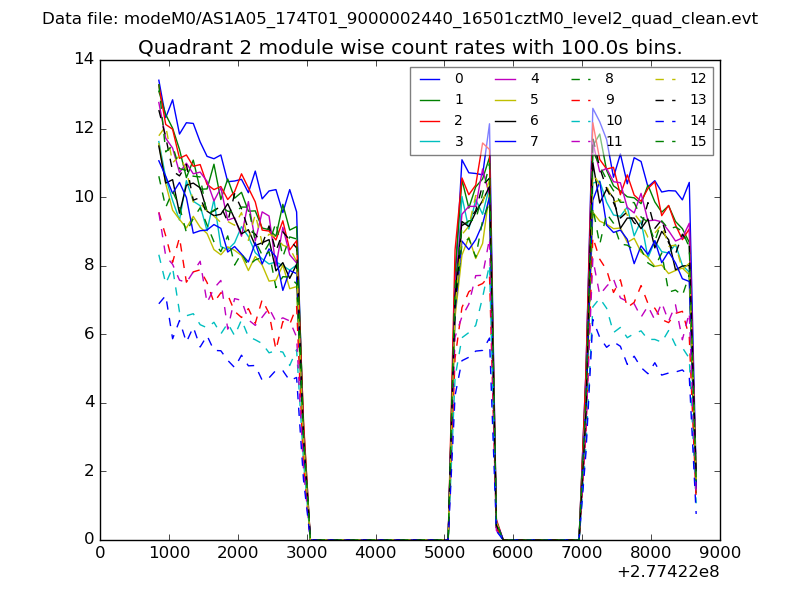
| Module-wise count rates for Quadrant B Data is divided into 100 sec bins |
 |
 |
| Module-wise count rates for Quadrant C Data is divided into 100 sec bins |
 |
 |
| Module-wise count rates for Quadrant D Data is divided into 100 sec bins |
 |
 |
| Parameter | Plot |
|---|---|
| CZT HV Monitor | 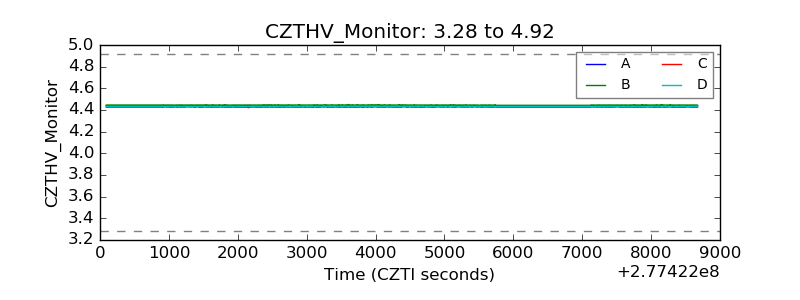 |
| D_VDD | 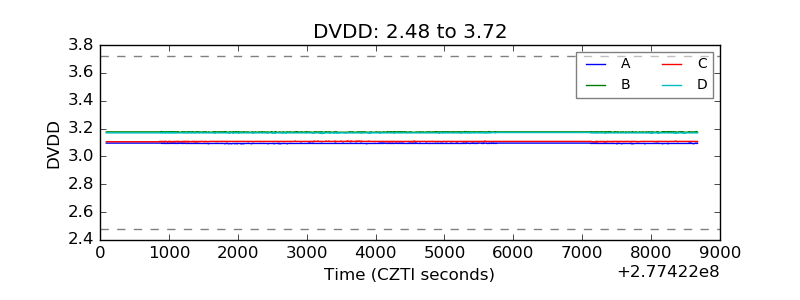 |
| Temperature 1 | 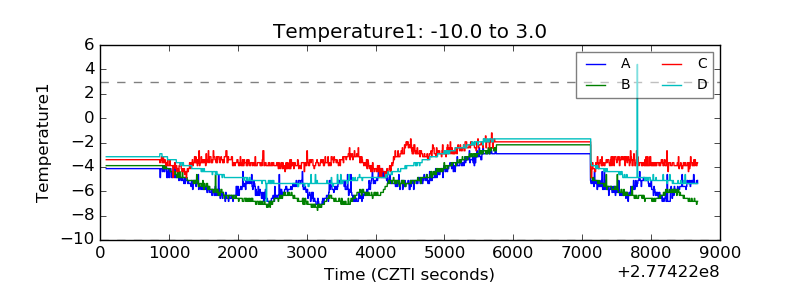 |
| Veto HV Monitor | 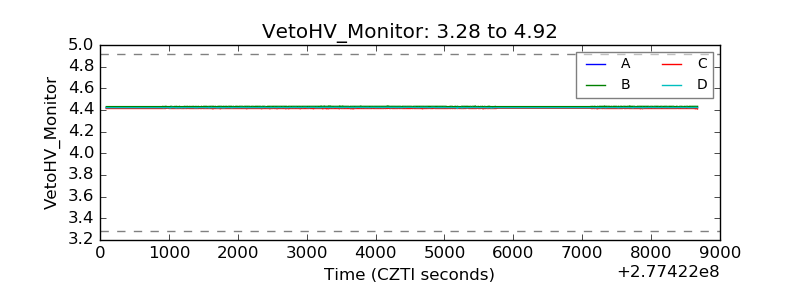 |
| Veto LLD | 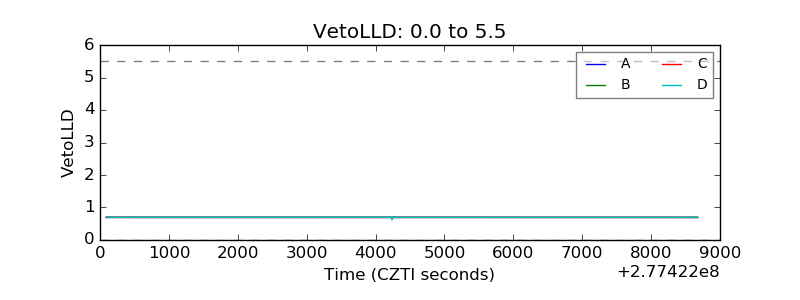 |
| Alpha Counter | 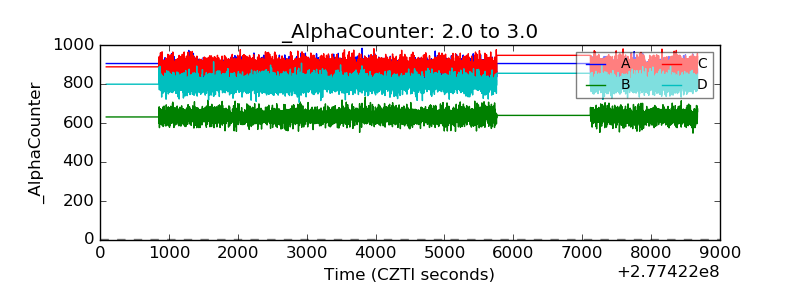 |
| _CPM_Rate | 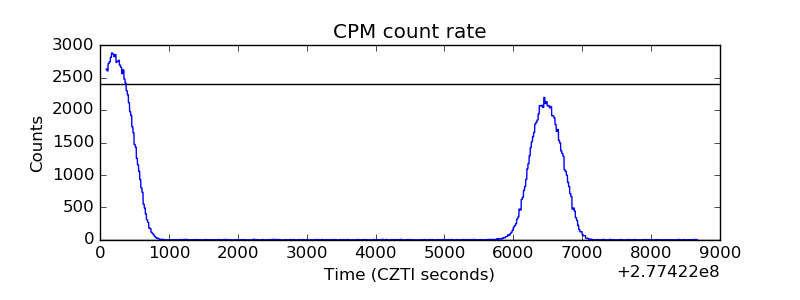 |
| CZT Counter | 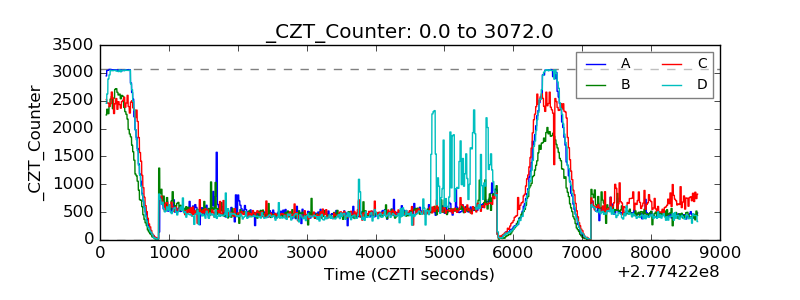 |
| +2.5 Volts monitor |  |
| +5 Volts monitor | 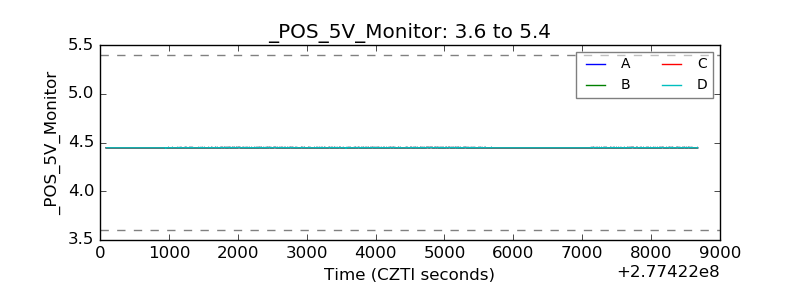 |
| _ROLL_ROT | 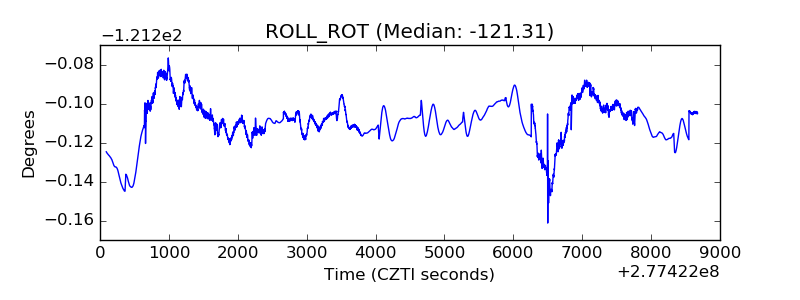 |
| _Roll_DEC | 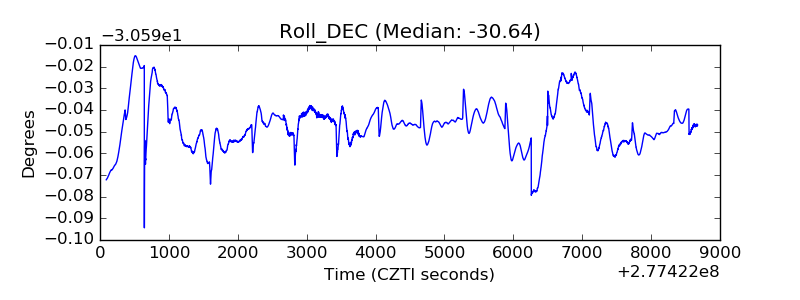 |
| _Roll_RA | 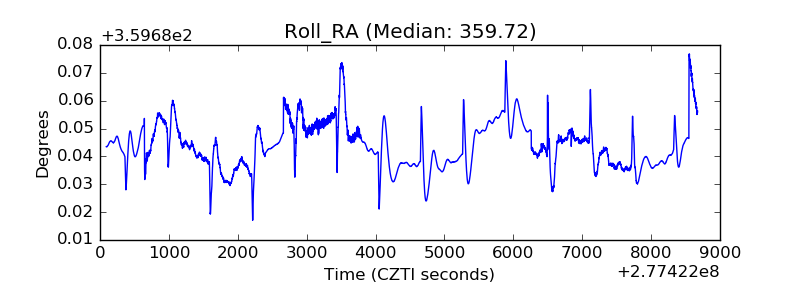 |
| Veto Counter | 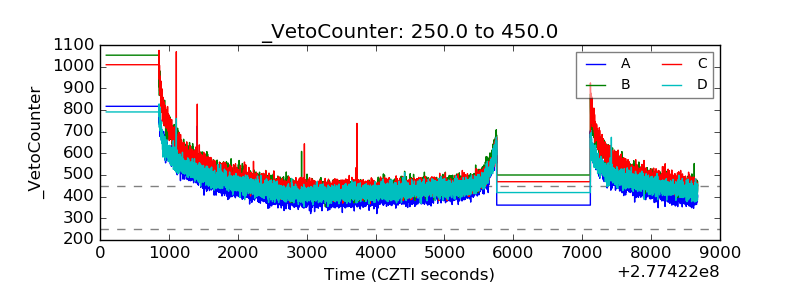 |