| Param | Original file | Final file |
|---|---|---|
| Filename | modeM0/AS1A05_174T01_9000002440_16503cztM0_level2.evt | modeM0/AS1A05_174T01_9000002440_16503cztM0_level2_quad_clean.evt |
| Size (bytes) | 450,809,280 | 84,628,800 |
| Size | 429.9 MB | 80.7 MB |
| Events in quadrant A | 3,376,344 | 526,535 |
| Events in quadrant B | 3,426,706 | 541,068 |
| Events in quadrant C | 3,346,675 | 517,592 |
| Events in quadrant D | 3,044,211 | 507,123 |
| Mode M9 | |||
|---|---|---|---|
| Quadrant | BADHDUFLAG | Total packets | Discarded packets |
| A | 0 | 18 | 0 |
| B | 0 | 18 | 0 |
| C | 0 | 18 | 0 |
| D | 0 | 19 | 0 |
| Mode SS | |||
|---|---|---|---|
| Quadrant | BADHDUFLAG | Total packets | Discarded packets |
| A | 0 | 136 | 0 |
| B | 0 | 136 | 0 |
| C | 0 | 136 | 0 |
| D | 0 | 136 | 0 |
| Mode M0 | |||
|---|---|---|---|
| Quadrant | BADHDUFLAG | Total packets | Discarded packets |
| A | 0 | 14590 | 3 |
| B | 0 | 14435 | 2 |
| C | 0 | 13949 | 2 |
| D | 0 | 13836 | 2 |
| Quadrant | Total seconds | Saturated seconds | Saturation percentage |
|---|---|---|---|
| A | 6753 | 76 | 1.125426% |
| B | 6753 | 92 | 1.362357% |
| C | 6753 | 72 | 1.066193% |
| D | 6753 | 28 | 0.414631% |
Noise dominated data is calculated using 1-second bins in cleaned event files. If a bin has >2000 counts, and if more than 50% of those come from <1% of pixels, then it is considered to be noise-dominated and hence unusable.
| Quadrant | # 1 sec bins | Bins with >0 counts | Bins with >2000 counts | High rate bins dominated by noise | Noise dominated (total time) | Noise dominated (detector-on time) | Marked lightcurve |
|---|---|---|---|---|---|---|---|
| A | 7699 | 6755 | 31 | 31 | 0.40% | 0.46% | 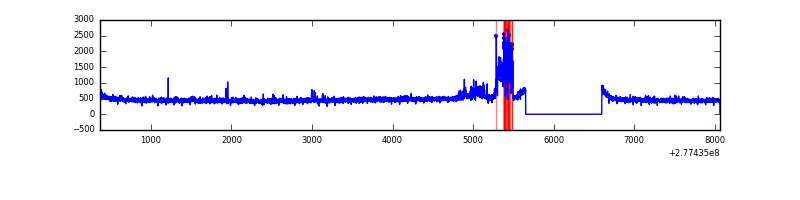 |
| B | 7699 | 6754 | 31 | 31 | 0.40% | 0.46% | 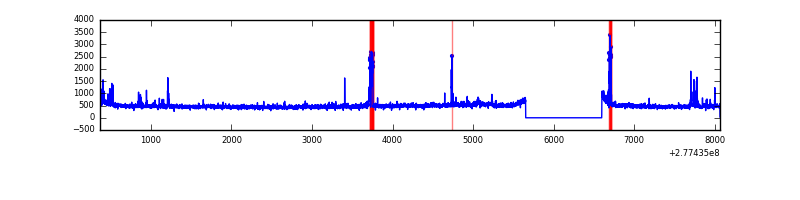 |
| C | 7699 | 6755 | 0 | 0 | 0.00% | 0.00% | 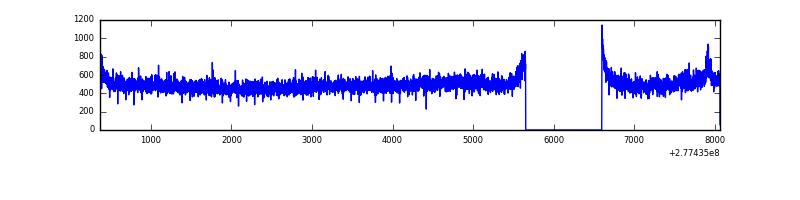 |
| D | 7699 | 6754 | 5 | 5 | 0.06% | 0.07% | 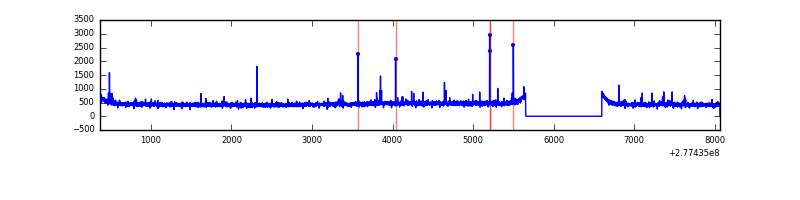 |
Top three noisy pixels from each quadrant. If the there are fewer than three noisy pixels in the level2.evt file, extra rows are filled as -1
| Pixel properties | Quadrant properties | ||||||
|---|---|---|---|---|---|---|---|
| Quadrant | DetID | PixID | Counts | Sigma | Mean | Median | Sigma |
| A | 15 | 174 | 283683 | 1763.55 | 803 | 787 | 160.4 |
| A | 0 | 226 | 6925 | 38.26 | 803 | 787 | 160.4 |
| A | 15 | 223 | 6705 | 36.89 | 803 | 787 | 160.4 |
| B | 10 | 16 | 80652 | 515.55 | 812 | 792 | 154.9 |
| B | 4 | 48 | 41257 | 261.23 | 812 | 792 | 154.9 |
| B | 4 | 173 | 41232 | 261.07 | 812 | 792 | 154.9 |
| C | 3 | 233 | 145553 | 788.85 | 784 | 788 | 183.5 |
| C | 14 | 238 | 121126 | 655.74 | 784 | 788 | 183.5 |
| C | 7 | 247 | 19043 | 99.47 | 784 | 788 | 183.5 |
| D | 5 | 222 | 31939 | 162.16 | 788 | 764 | 192.2 |
| D | 2 | 234 | 22335 | 112.2 | 788 | 764 | 192.2 |
| D | 2 | 120 | 14355 | 70.7 | 788 | 764 | 192.2 |
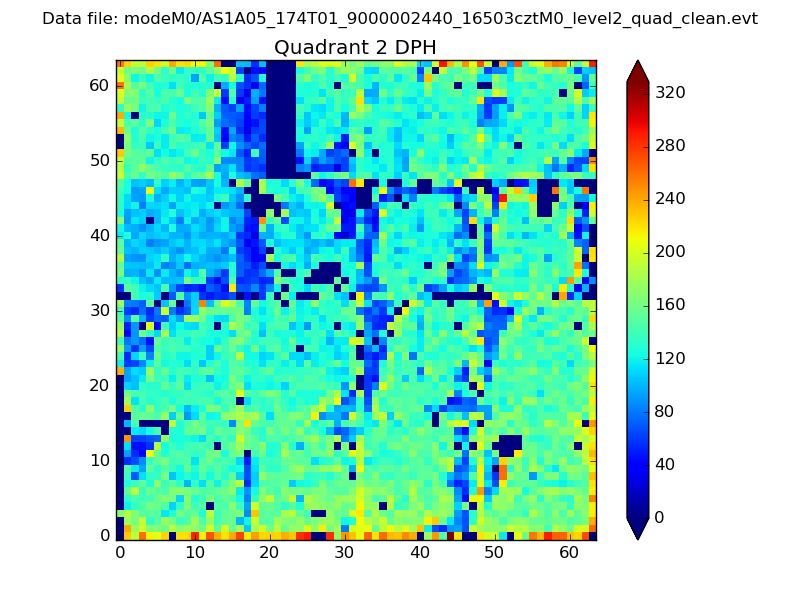
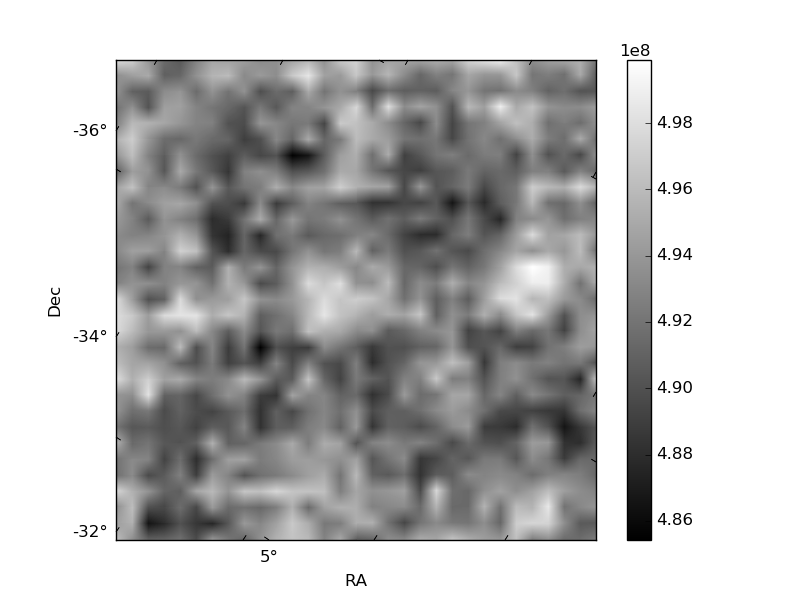
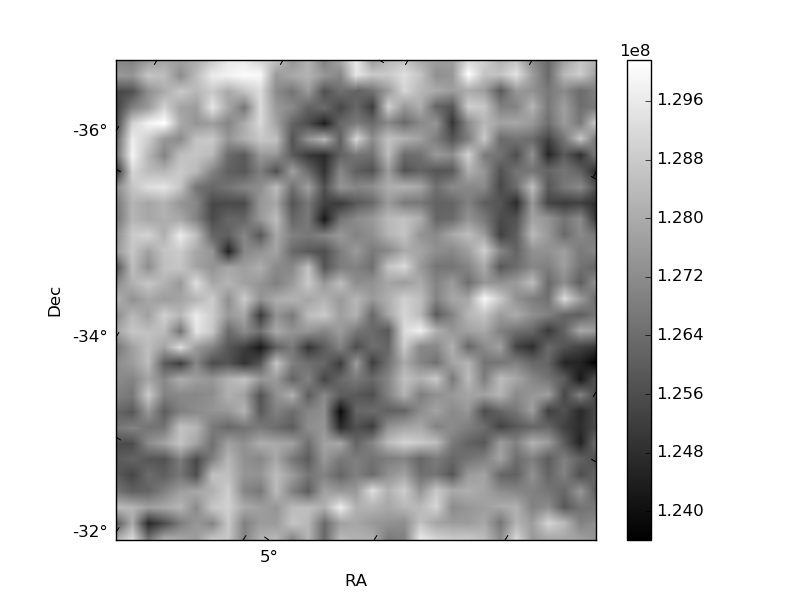
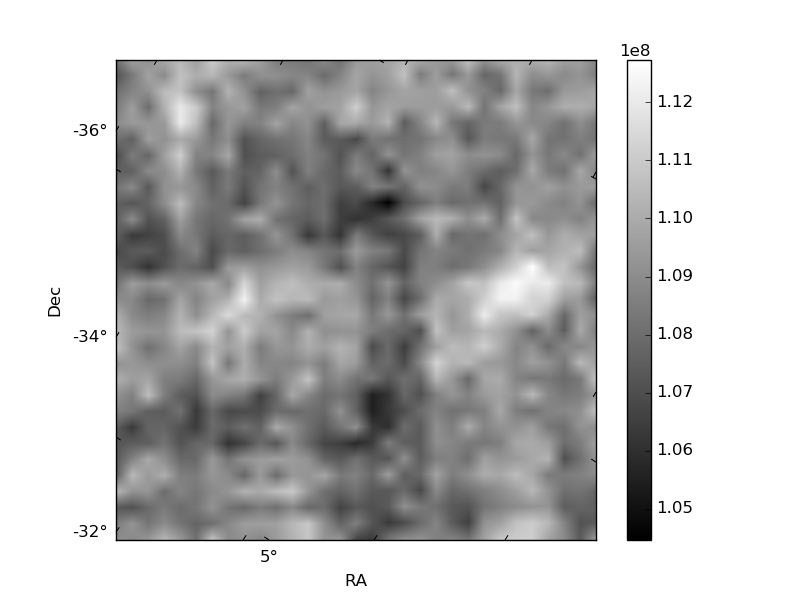
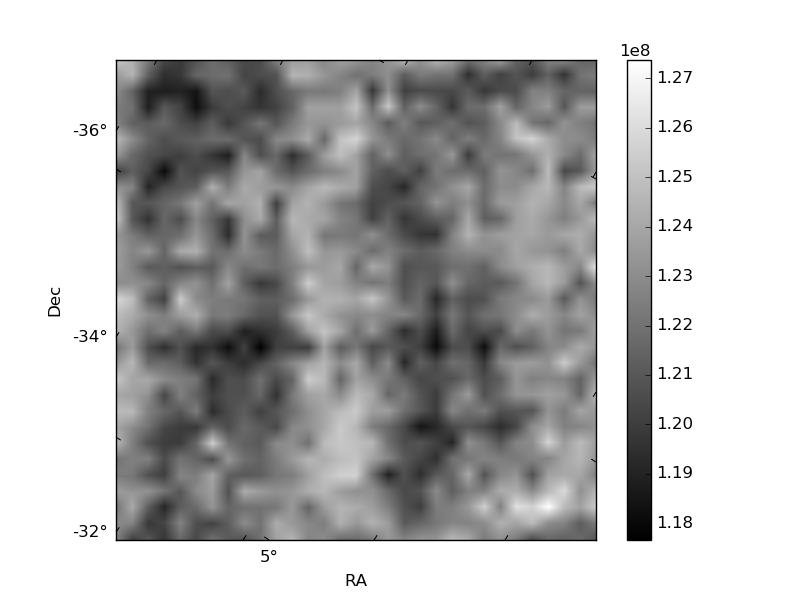
Histogram calculated using DETX and DETY for each event in the final _common_clean file
| Quadrant A | 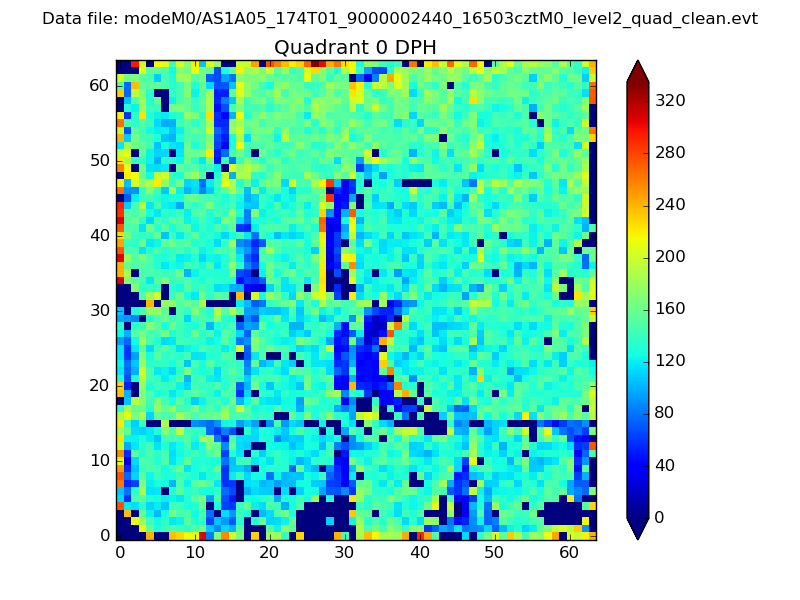 |
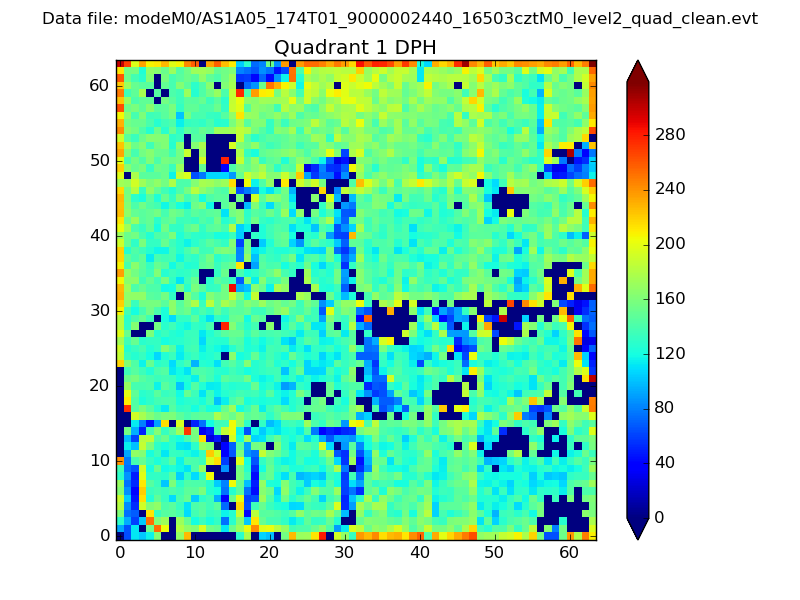 |
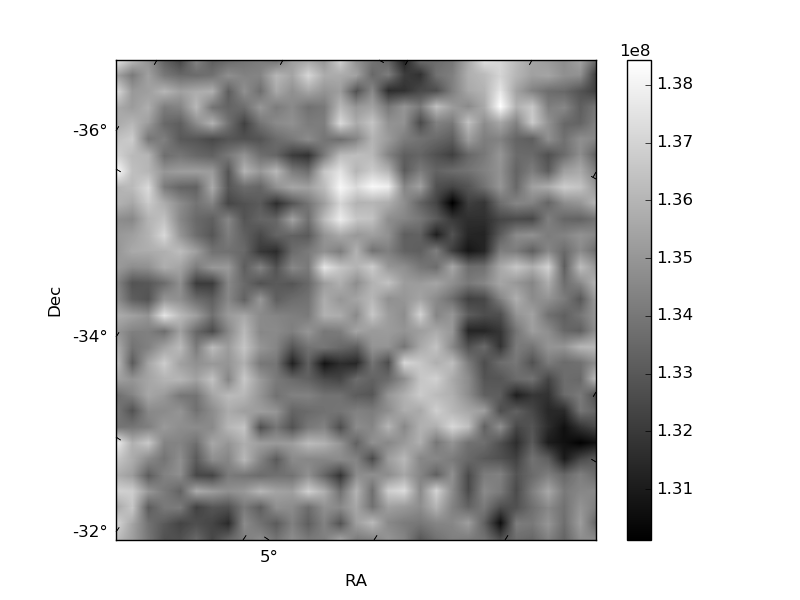
Quadrant B |
|---|---|---|---|
| Quadrant D | 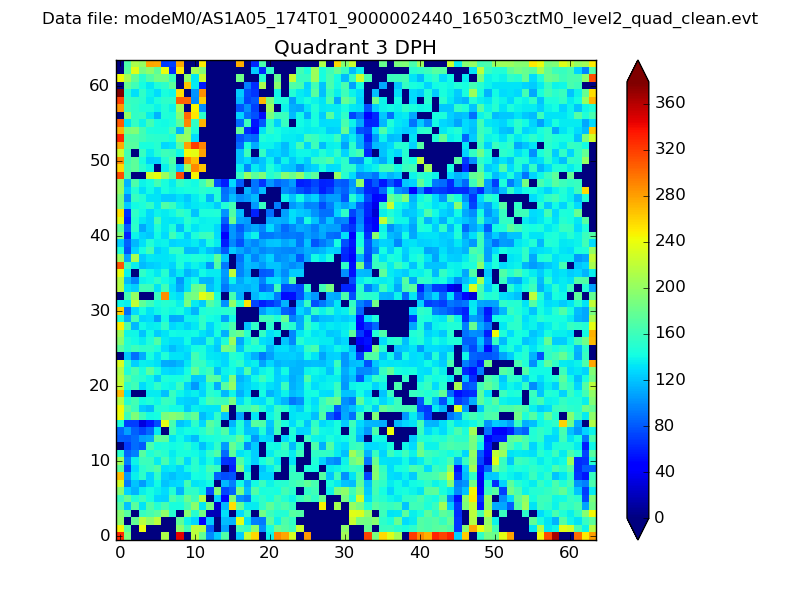 |
 |
Quadrant C |
| Plot type | Count rate plots | Images |
|---|---|---|
| Comparison with Poisson distribution Blue bars denote a histogram of data divided into 1 sec bins. Red curve is a Poisson curve with rate = median count rate of data. |
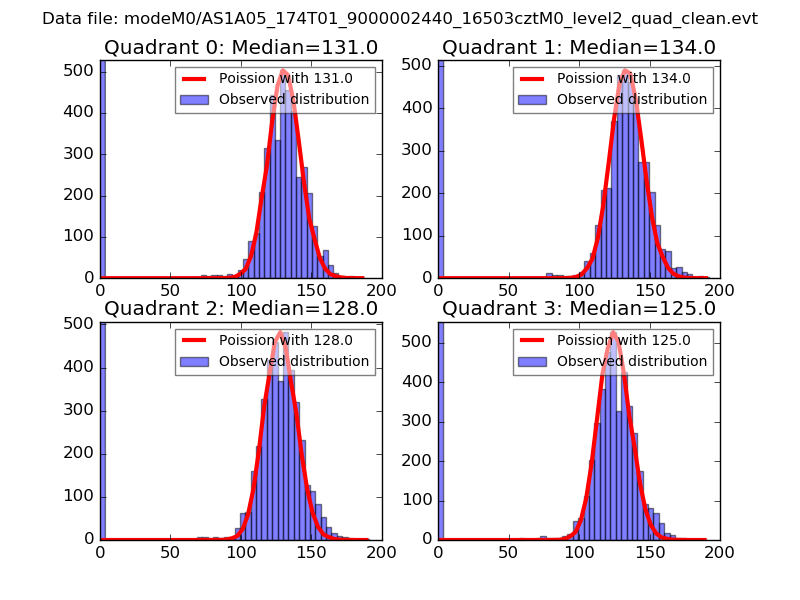 |
 |
| Quadrant-wise count rates Data is divided into 100 sec bins |
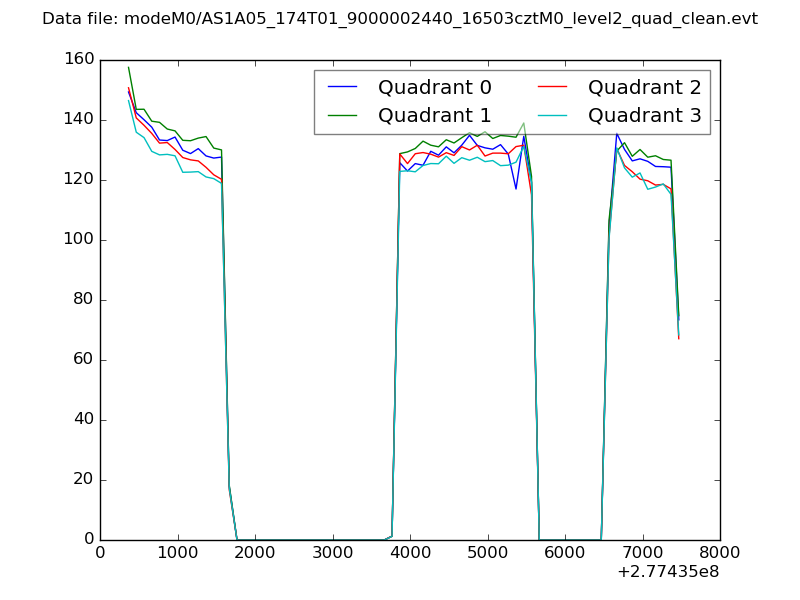 |
|
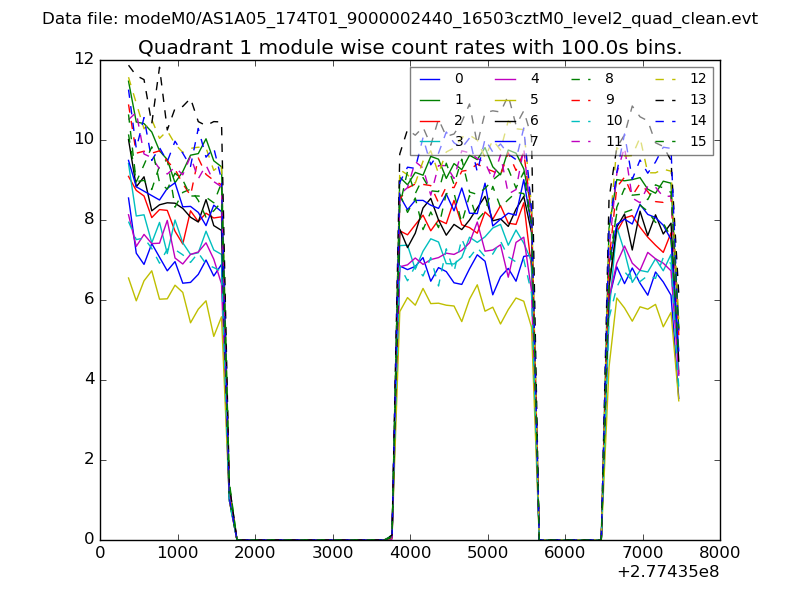
| Module-wise count rates for Quadrant A Data is divided into 100 sec bins |
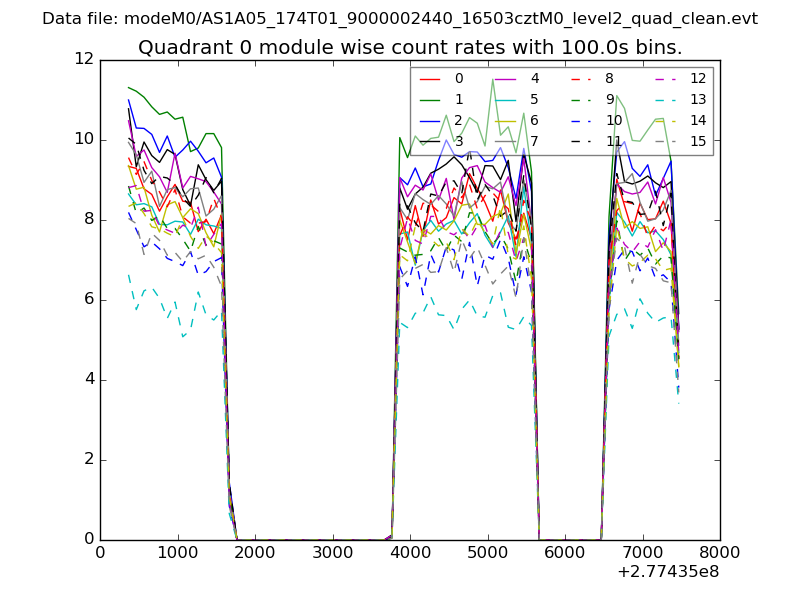 |
 |
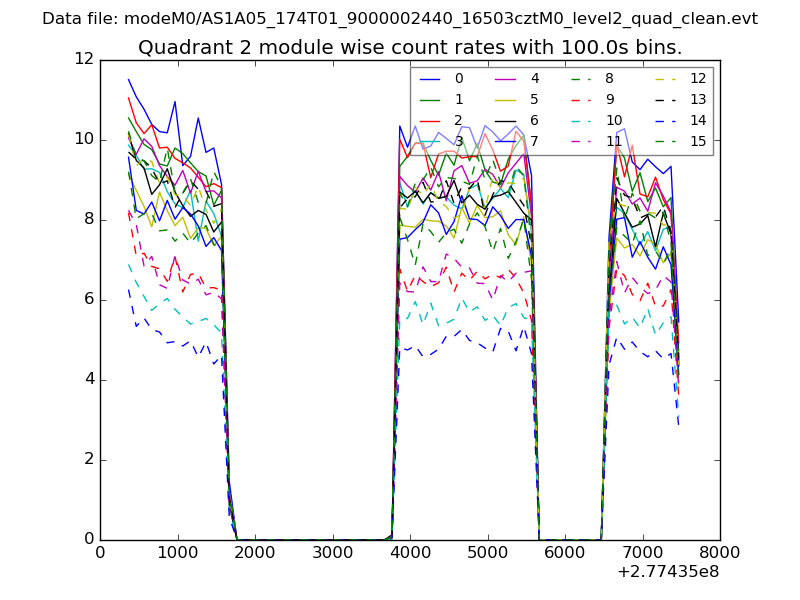
| Module-wise count rates for Quadrant B Data is divided into 100 sec bins |
 |
 |
| Module-wise count rates for Quadrant C Data is divided into 100 sec bins |
 |
 |
| Module-wise count rates for Quadrant D Data is divided into 100 sec bins |
 |
 |
| Parameter | Plot |
|---|---|
| CZT HV Monitor | 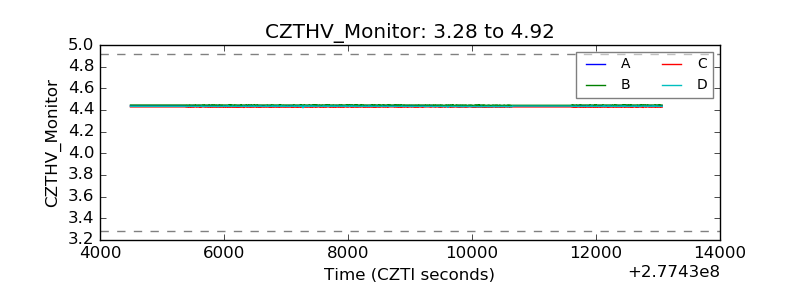 |
| D_VDD | 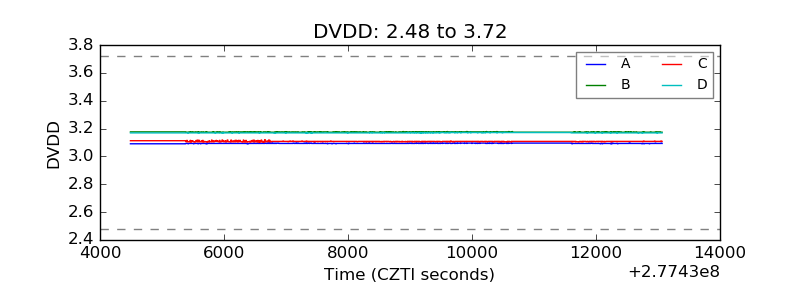 |
| Temperature 1 | 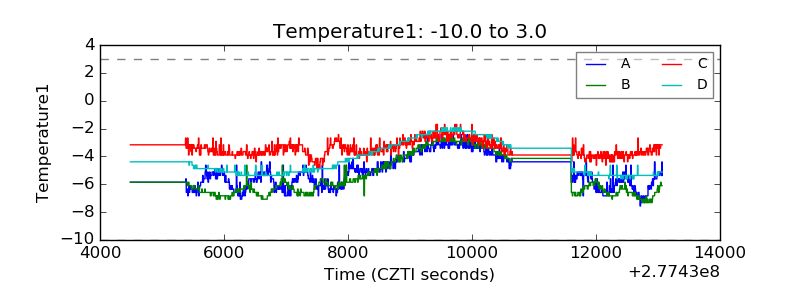 |
| Veto HV Monitor | 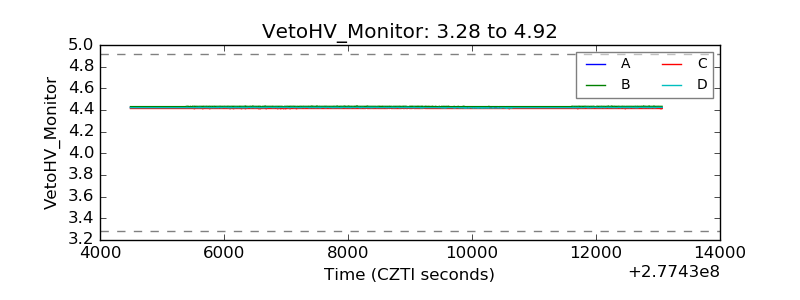 |
| Veto LLD |  |
| Alpha Counter | 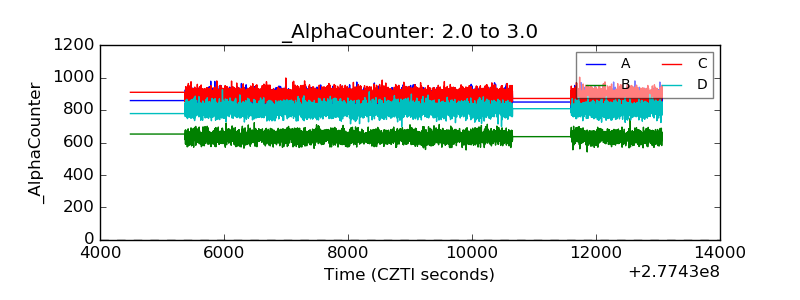 |
| _CPM_Rate | 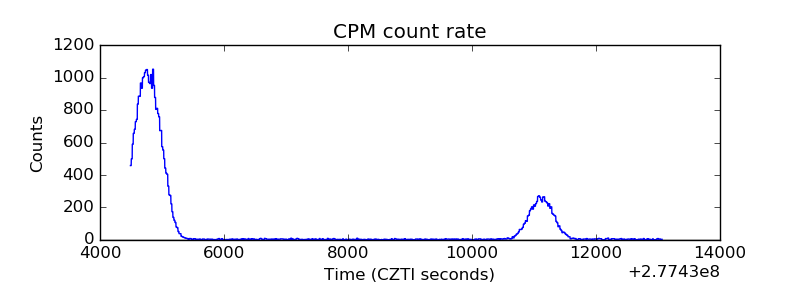 |
| CZT Counter | 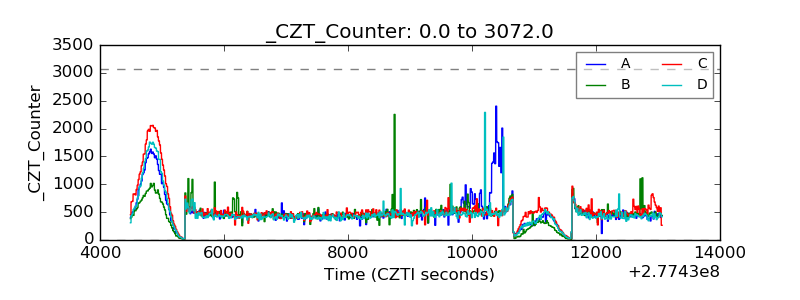 |
| +2.5 Volts monitor |  |
| +5 Volts monitor |  |
| _ROLL_ROT | 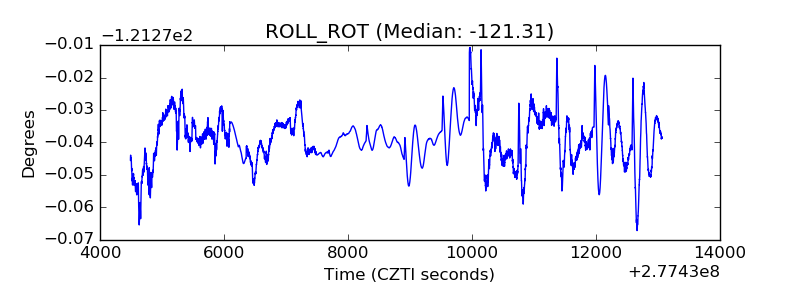 |
| _Roll_DEC | 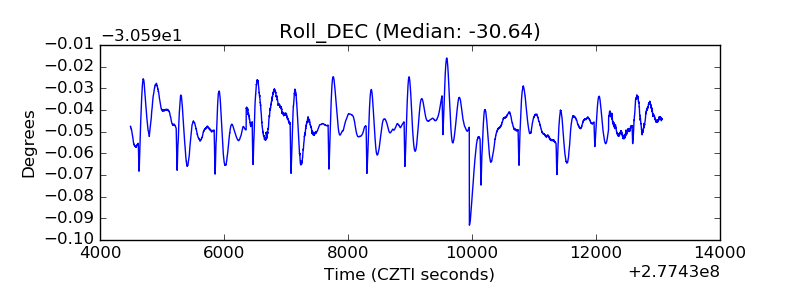 |
| _Roll_RA | 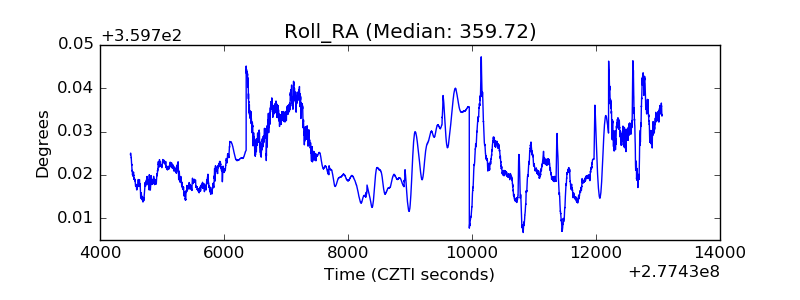 |
| Veto Counter | 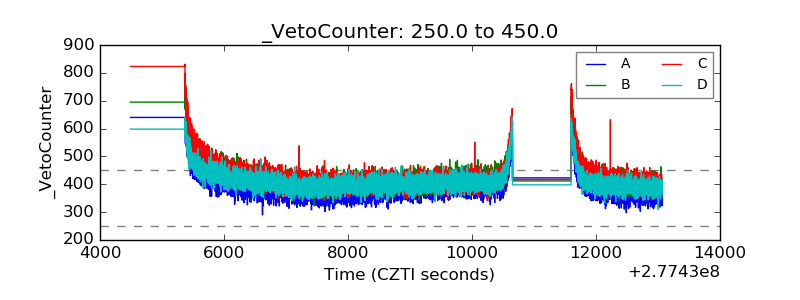 |