| Param | Original file | Final file |
|---|---|---|
| Filename | modeM0/AS1A05_174T01_9000002440_16505cztM0_level2.evt | modeM0/AS1A05_174T01_9000002440_16505cztM0_level2_quad_clean.evt |
| Size (bytes) | 574,076,160 | 104,071,680 |
| Size | 547.5 MB | 99.3 MB |
| Events in quadrant A | 4,159,960 | 642,722 |
| Events in quadrant B | 4,413,644 | 653,400 |
| Events in quadrant C | 4,259,015 | 629,112 |
| Events in quadrant D | 3,963,174 | 622,987 |
| Mode M9 | |||
|---|---|---|---|
| Quadrant | BADHDUFLAG | Total packets | Discarded packets |
| A | 0 | 8 | 0 |
| B | 0 | 8 | 0 |
| C | 0 | 8 | 0 |
| D | 0 | 8 | 0 |
| Mode SS | |||
|---|---|---|---|
| Quadrant | BADHDUFLAG | Total packets | Discarded packets |
| A | 0 | 180 | 0 |
| B | 0 | 180 | 0 |
| C | 0 | 180 | 0 |
| D | 0 | 180 | 0 |
| Mode M0 | |||
|---|---|---|---|
| Quadrant | BADHDUFLAG | Total packets | Discarded packets |
| A | 0 | 18200 | 3 |
| B | 0 | 18731 | 2 |
| C | 0 | 18251 | 2 |
| D | 0 | 18212 | 2 |
| Quadrant | Total seconds | Saturated seconds | Saturation percentage |
|---|---|---|---|
| A | 8687 | 200 | 2.302291% |
| B | 8687 | 265 | 3.050535% |
| C | 8687 | 296 | 3.407390% |
| D | 8687 | 172 | 1.979970% |
Noise dominated data is calculated using 1-second bins in cleaned event files. If a bin has >2000 counts, and if more than 50% of those come from <1% of pixels, then it is considered to be noise-dominated and hence unusable.
| Quadrant | # 1 sec bins | Bins with >0 counts | Bins with >2000 counts | High rate bins dominated by noise | Noise dominated (total time) | Noise dominated (detector-on time) | Marked lightcurve |
|---|---|---|---|---|---|---|---|
| A | 9458 | 8689 | 0 | 0 | 0.00% | 0.00% | 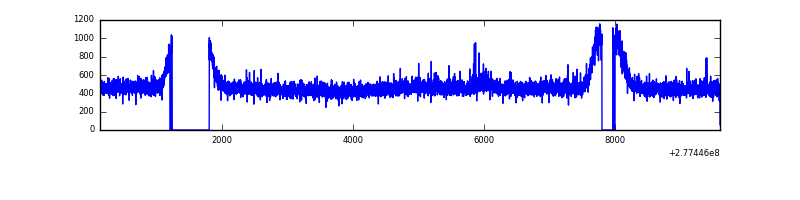 |
| B | 9458 | 8688 | 14 | 14 | 0.15% | 0.16% |  |
| C | 9458 | 8689 | 0 | 0 | 0.00% | 0.00% | 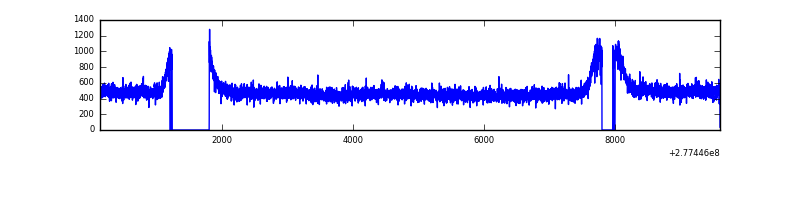 |
| D | 9458 | 8689 | 2 | 2 | 0.02% | 0.02% | 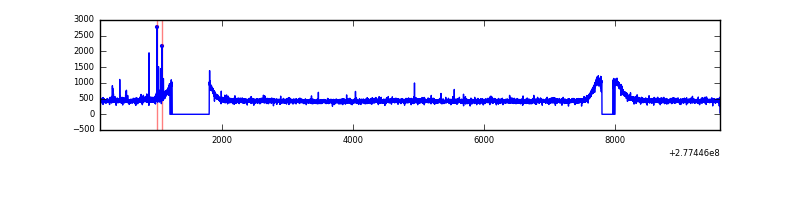 |
Top three noisy pixels from each quadrant. If the there are fewer than three noisy pixels in the level2.evt file, extra rows are filled as -1
| Pixel properties | Quadrant properties | ||||||
|---|---|---|---|---|---|---|---|
| Quadrant | DetID | PixID | Counts | Sigma | Mean | Median | Sigma |
| A | 15 | 174 | 48797 | 221.59 | 1061 | 1035 | 215.5 |
| A | 15 | 223 | 21162 | 93.38 | 1061 | 1035 | 215.5 |
| A | 13 | 210 | 11908 | 50.44 | 1061 | 1035 | 215.5 |
| B | 10 | 16 | 65902 | 310.94 | 1063 | 1033 | 208.6 |
| B | 15 | 35 | 63701 | 300.39 | 1063 | 1033 | 208.6 |
| B | 4 | 173 | 52242 | 245.46 | 1063 | 1033 | 208.6 |
| C | 14 | 238 | 154742 | 633.65 | 1024 | 1032 | 242.6 |
| C | 3 | 233 | 80426 | 327.29 | 1024 | 1032 | 242.6 |
| C | 7 | 247 | 29480 | 117.27 | 1024 | 1032 | 242.6 |
| D | 2 | 234 | 30266 | 114.65 | 1037 | 1005 | 255.2 |
| D | 10 | 70 | 17372 | 64.13 | 1037 | 1005 | 255.2 |
| D | 5 | 222 | 12468 | 44.91 | 1037 | 1005 | 255.2 |
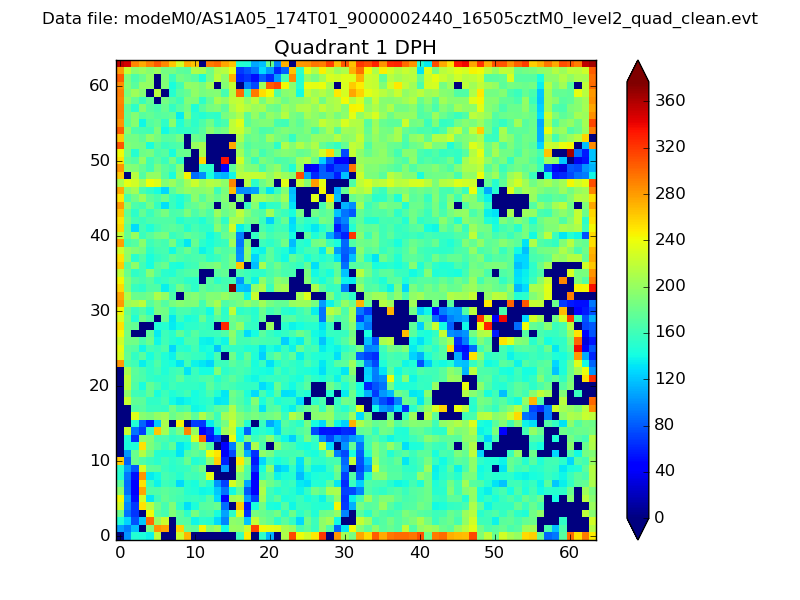
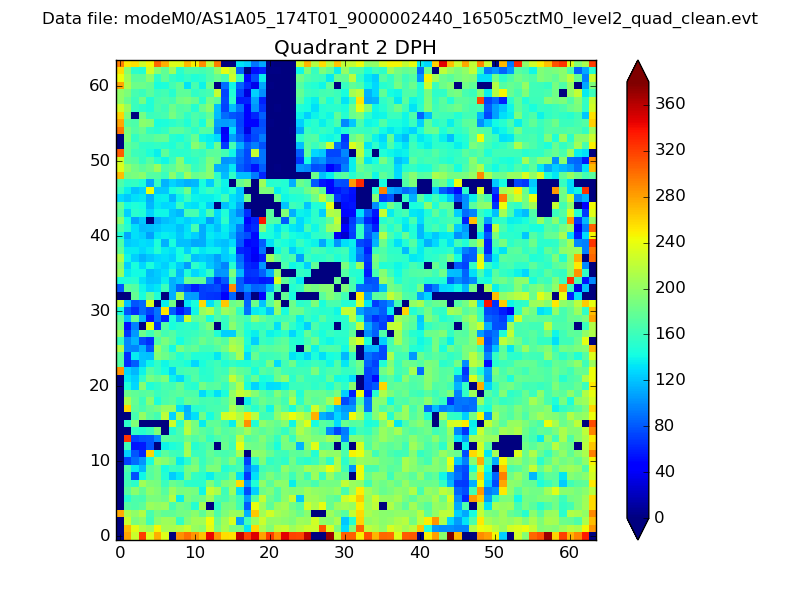
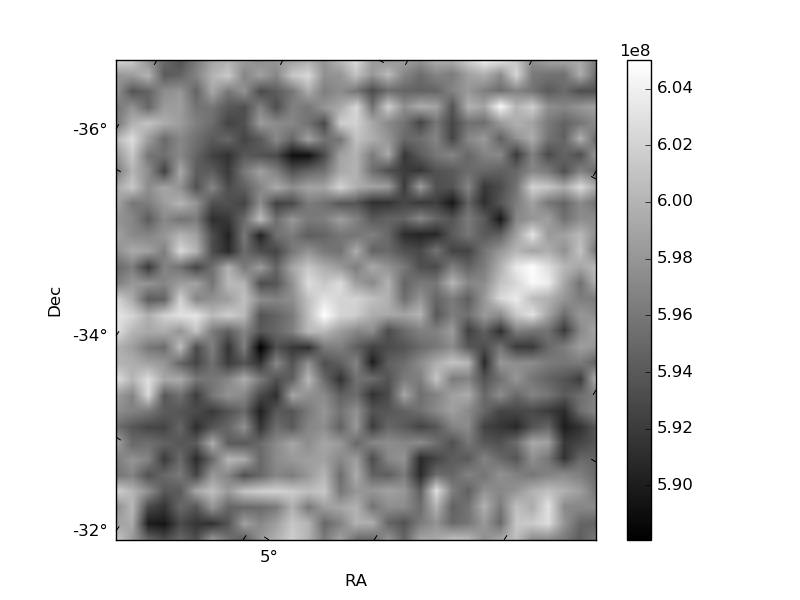
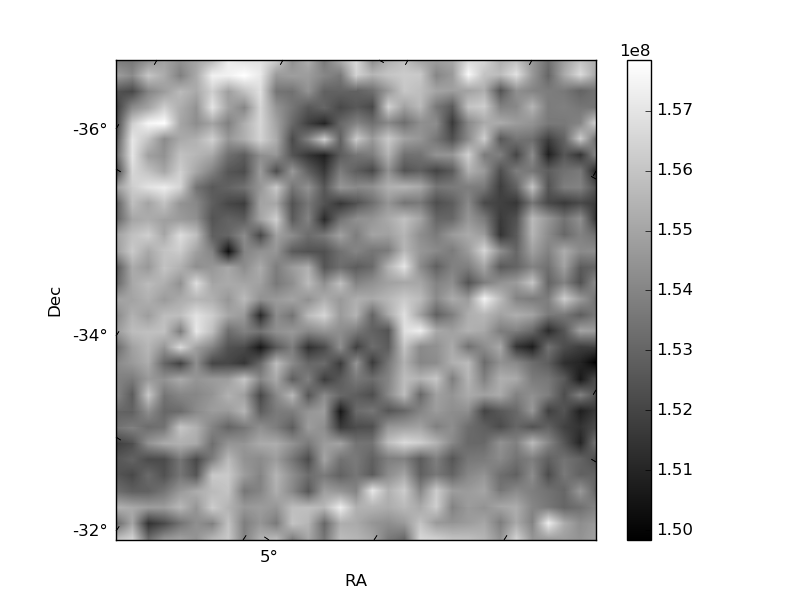
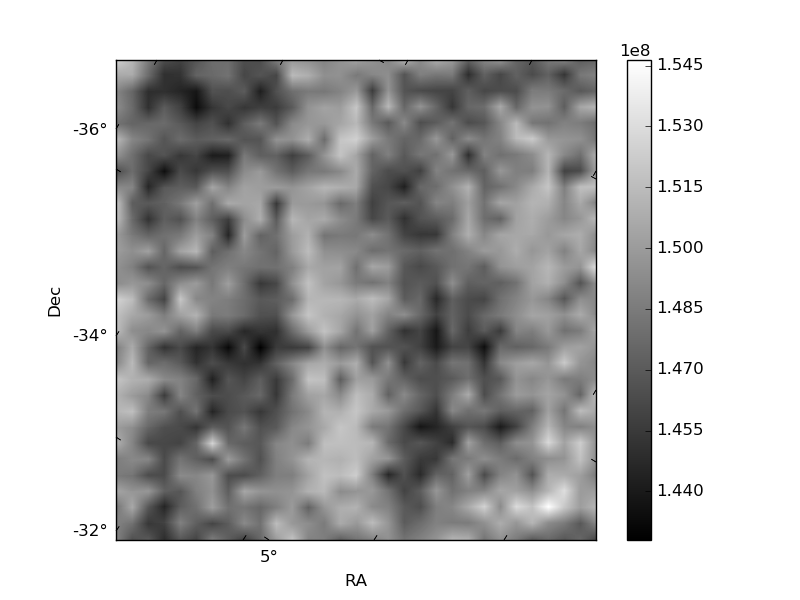
Histogram calculated using DETX and DETY for each event in the final _common_clean file
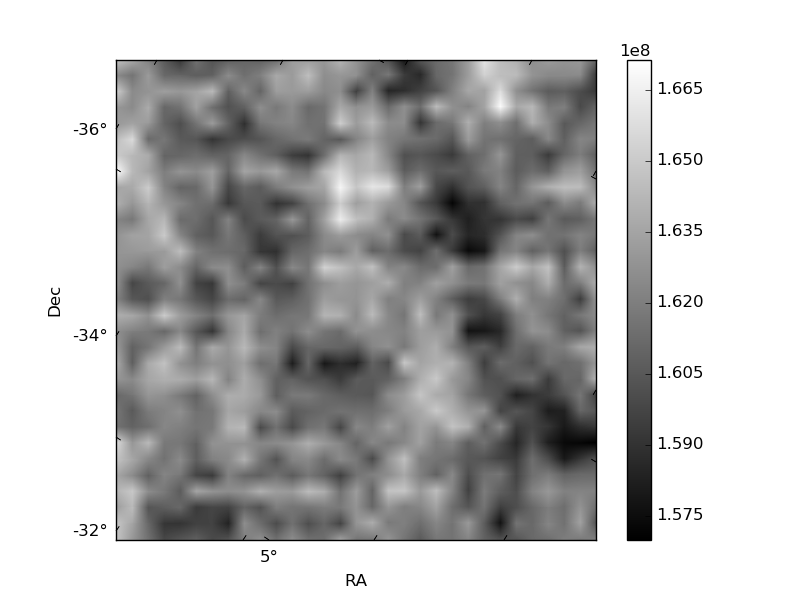
| Quadrant A | 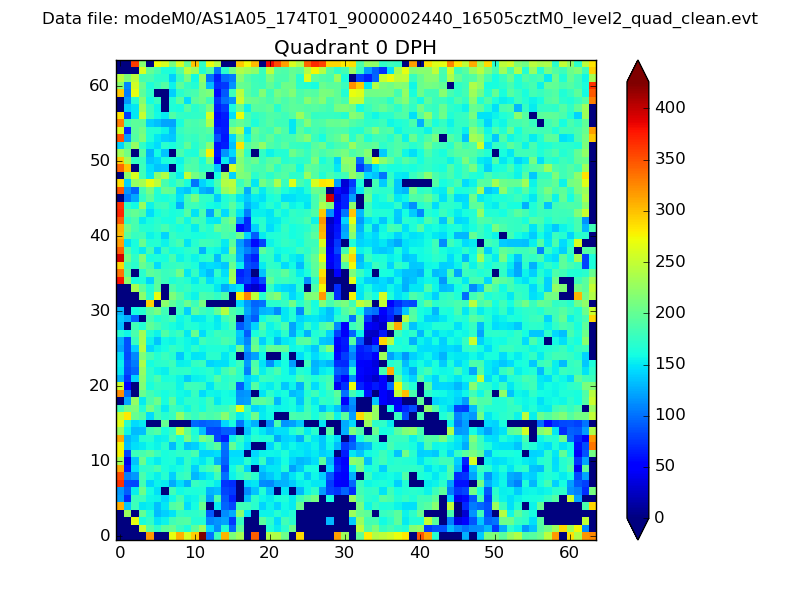 |
 |
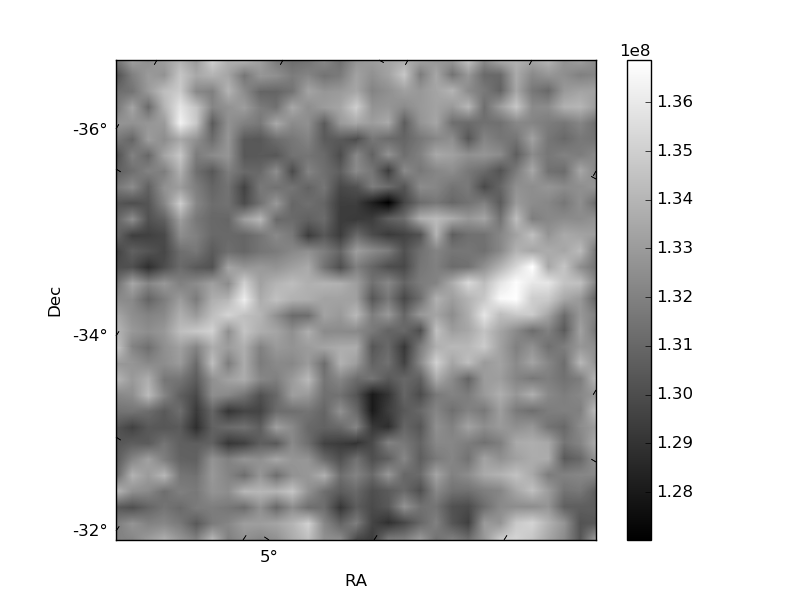
Quadrant B |
|---|---|---|---|
| Quadrant D | 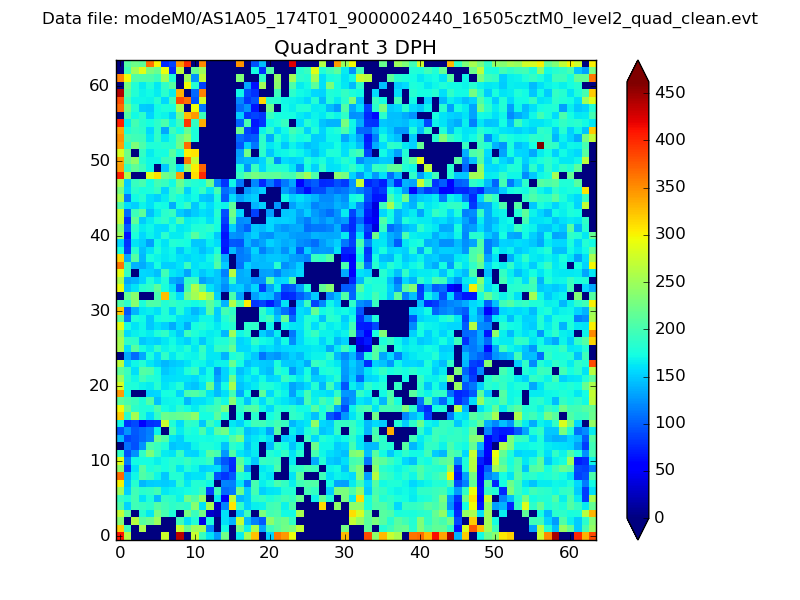 |
 |
Quadrant C |
| Plot type | Count rate plots | Images |
|---|---|---|
| Comparison with Poisson distribution Blue bars denote a histogram of data divided into 1 sec bins. Red curve is a Poisson curve with rate = median count rate of data. |
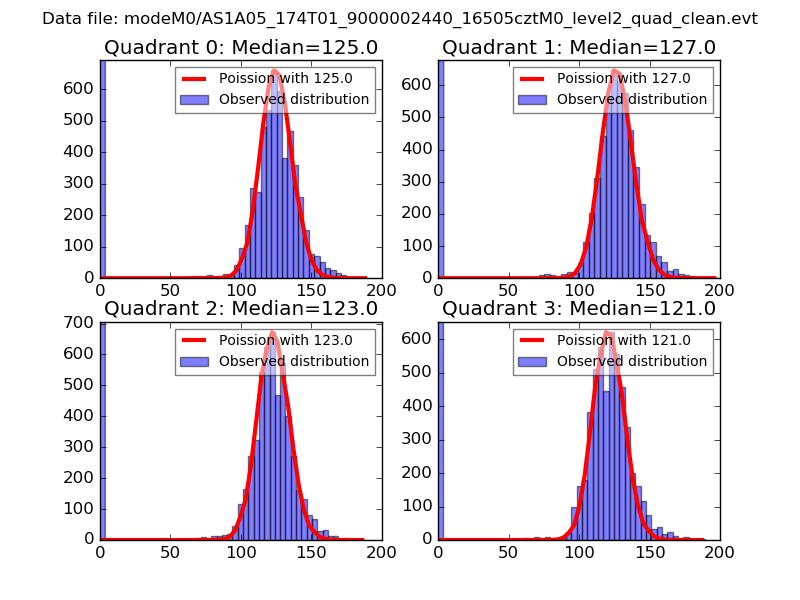 |
 |
| Quadrant-wise count rates Data is divided into 100 sec bins |
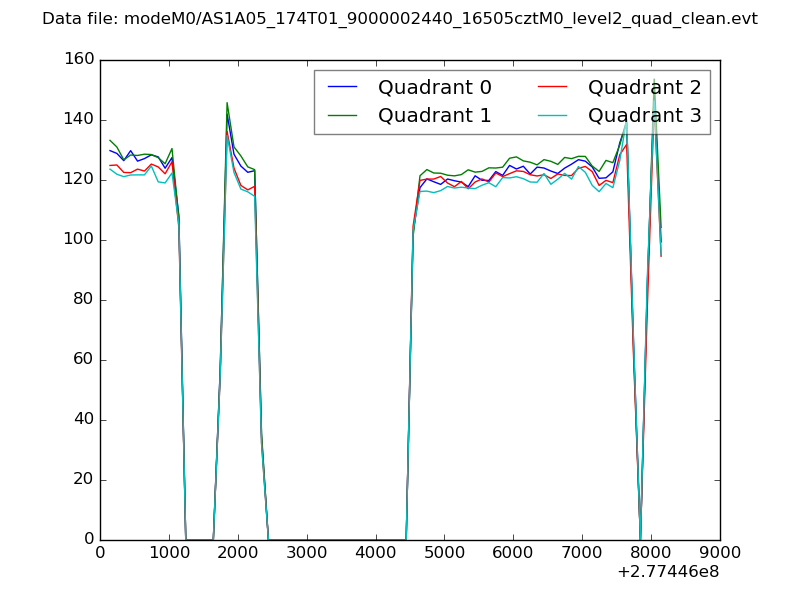 |
|
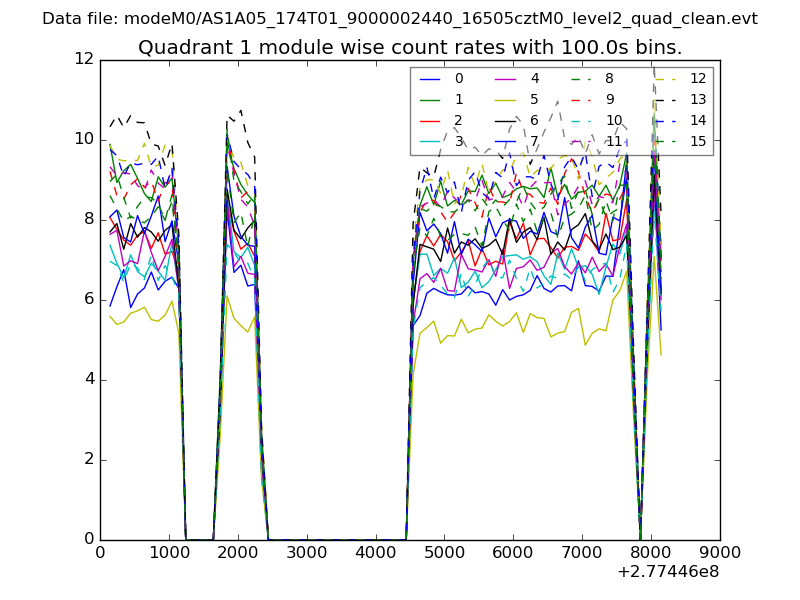
| Module-wise count rates for Quadrant A Data is divided into 100 sec bins |
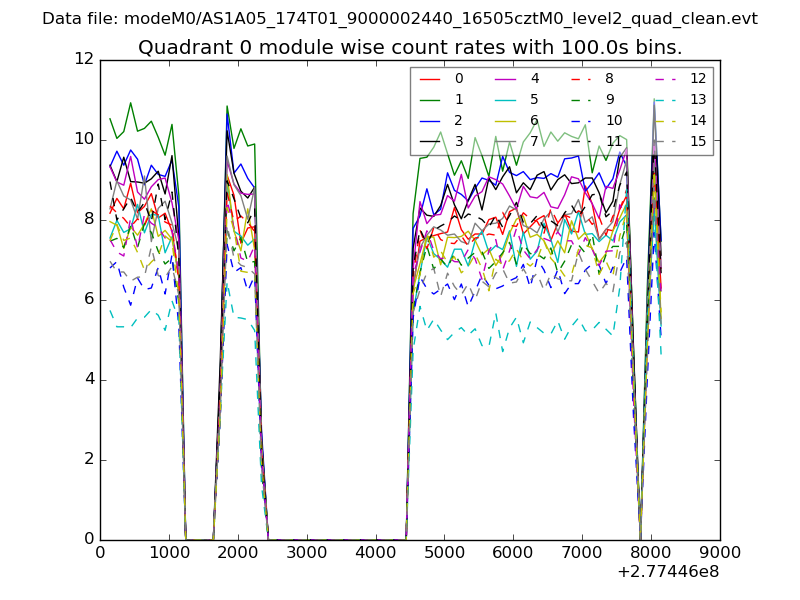 |
 |
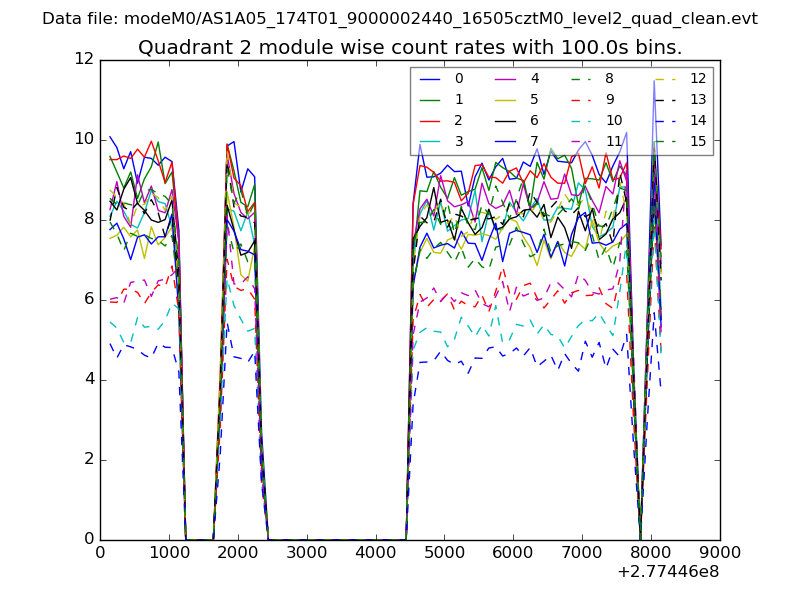
| Module-wise count rates for Quadrant B Data is divided into 100 sec bins |
 |
 |
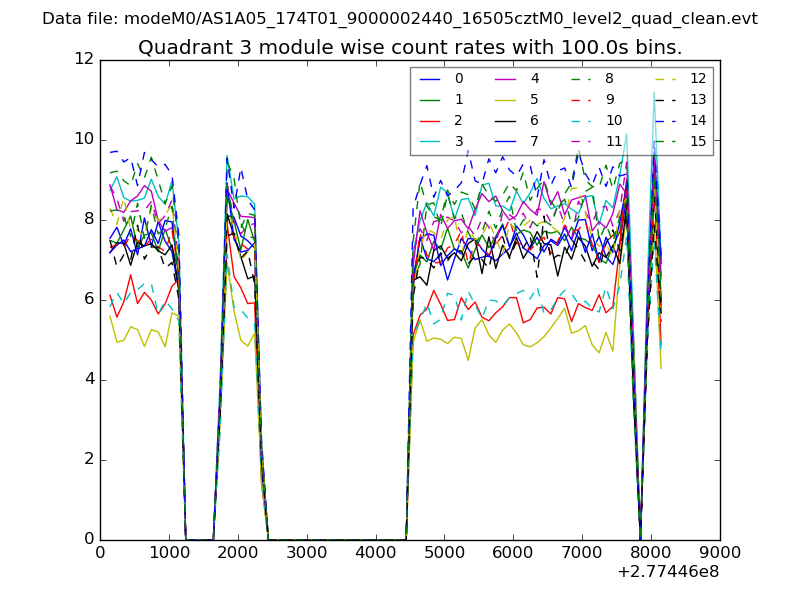
| Module-wise count rates for Quadrant C Data is divided into 100 sec bins |
 |
 |
| Module-wise count rates for Quadrant D Data is divided into 100 sec bins |
 |
 |
| Parameter | Plot |
|---|---|
| CZT HV Monitor | 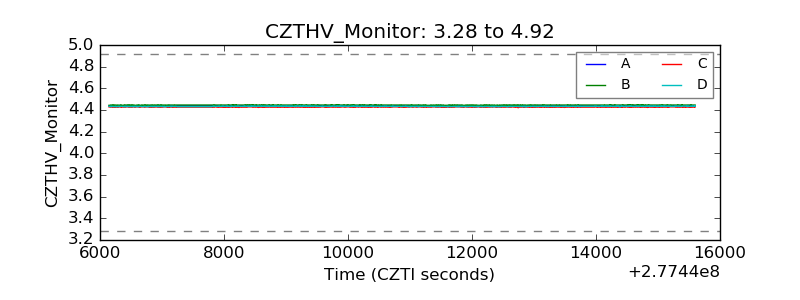 |
| D_VDD | 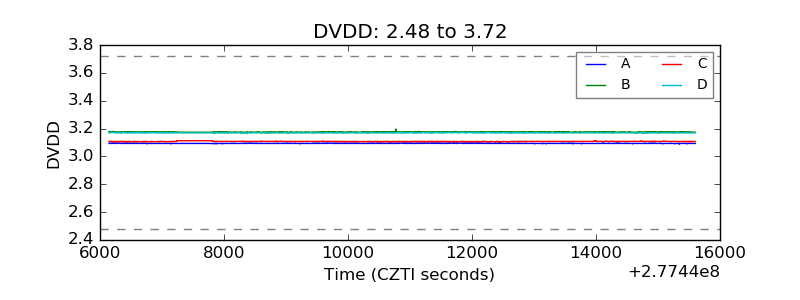 |
| Temperature 1 | 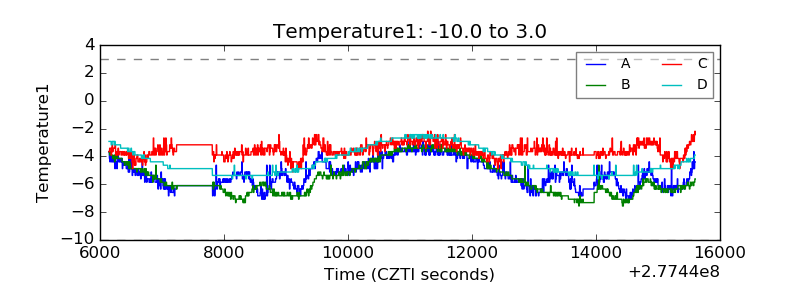 |
| Veto HV Monitor | 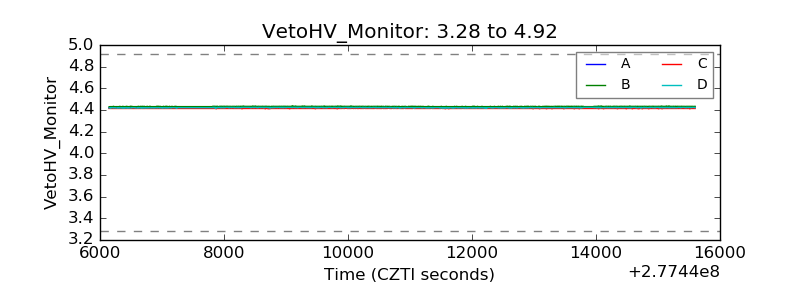 |
| Veto LLD | 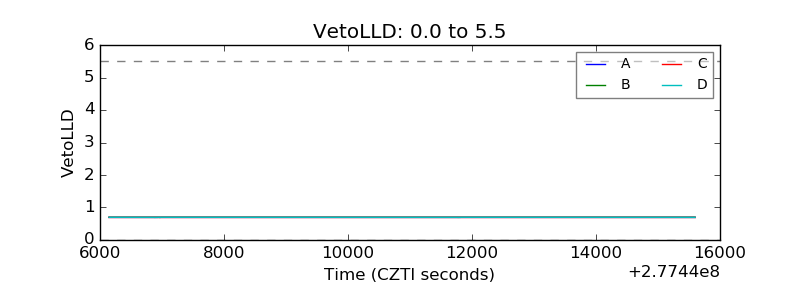 |
| Alpha Counter | 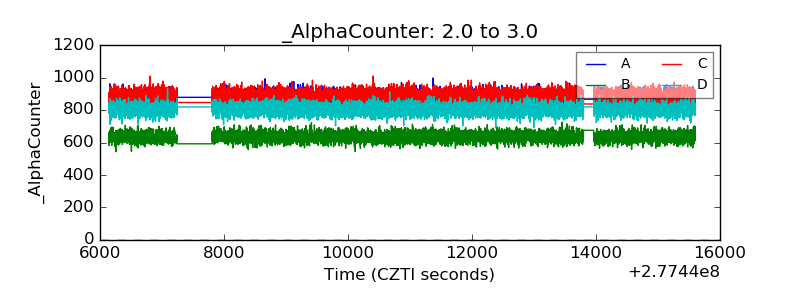 |
| _CPM_Rate | 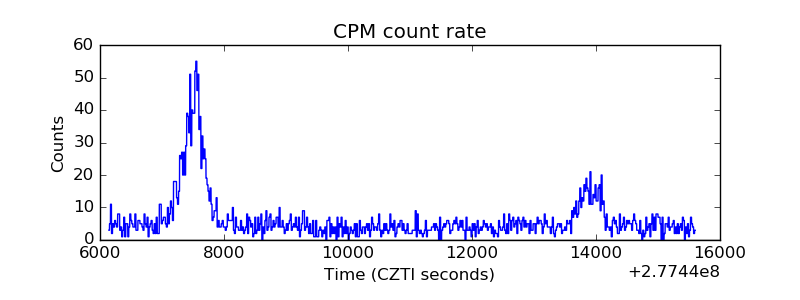 |
| CZT Counter | 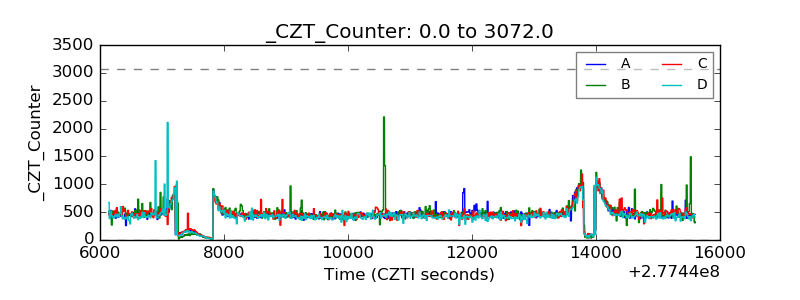 |
| +2.5 Volts monitor |  |
| +5 Volts monitor |  |
| _ROLL_ROT | 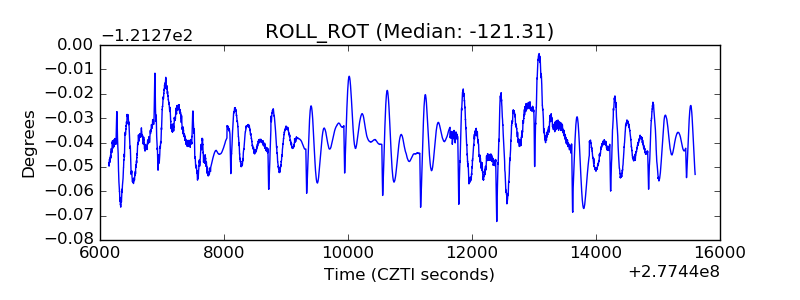 |
| _Roll_DEC | 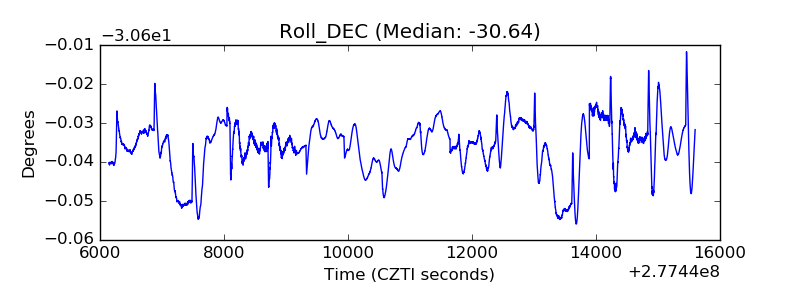 |
| _Roll_RA | 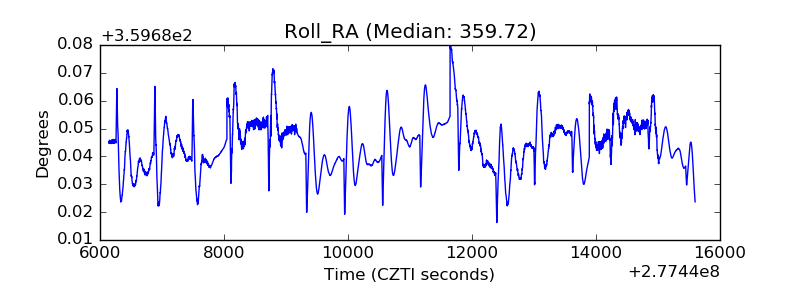 |
| Veto Counter | 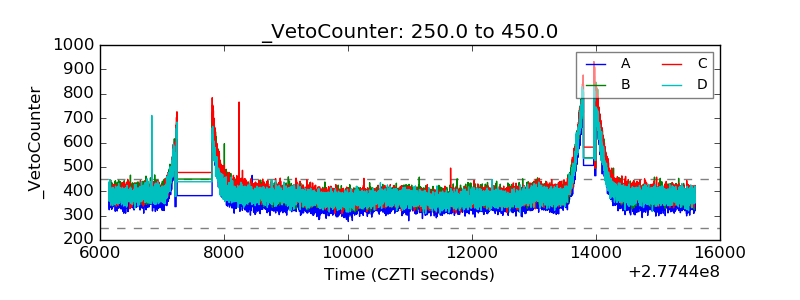 |