| Param | Original file | Final file |
|---|---|---|
| Filename | modeM0/AS1A05_174T01_9000002440_16513cztM0_level2.evt | modeM0/AS1A05_174T01_9000002440_16513cztM0_level2_quad_clean.evt |
| Size (bytes) | 441,336,960 | 98,075,520 |
| Size | 420.9 MB | 93.5 MB |
| Events in quadrant A | 3,303,066 | 642,427 |
| Events in quadrant B | 3,335,711 | 660,342 |
| Events in quadrant C | 3,212,169 | 617,195 |
| Events in quadrant D | 3,078,974 | 602,632 |
| Mode M9 | |||
|---|---|---|---|
| Quadrant | BADHDUFLAG | Total packets | Discarded packets |
| A | 0 | 14 | 0 |
| B | 0 | 14 | 0 |
| C | 0 | 14 | 0 |
| D | 0 | 15 | 0 |
| Mode SS | |||
|---|---|---|---|
| Quadrant | BADHDUFLAG | Total packets | Discarded packets |
| A | 0 | 128 | 0 |
| B | 0 | 128 | 0 |
| C | 0 | 128 | 0 |
| D | 0 | 128 | 0 |
| Mode M0 | |||
|---|---|---|---|
| Quadrant | BADHDUFLAG | Total packets | Discarded packets |
| A | 0 | 14069 | 2 |
| B | 0 | 14025 | 1 |
| C | 0 | 13619 | 1 |
| D | 0 | 13627 | 1 |
| Quadrant | Total seconds | Saturated seconds | Saturation percentage |
|---|---|---|---|
| A | 6422 | 85 | 1.323575% |
| B | 6422 | 102 | 1.588290% |
| C | 6422 | 94 | 1.463718% |
| D | 6422 | 74 | 1.152289% |
Noise dominated data is calculated using 1-second bins in cleaned event files. If a bin has >2000 counts, and if more than 50% of those come from <1% of pixels, then it is considered to be noise-dominated and hence unusable.
| Quadrant | # 1 sec bins | Bins with >0 counts | Bins with >2000 counts | High rate bins dominated by noise | Noise dominated (total time) | Noise dominated (detector-on time) | Marked lightcurve |
|---|---|---|---|---|---|---|---|
| A | 7593 | 6423 | 1 | 1 | 0.01% | 0.02% | 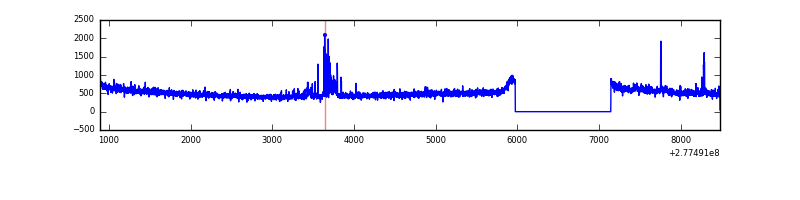 |
| B | 7593 | 6423 | 6 | 6 | 0.08% | 0.09% | 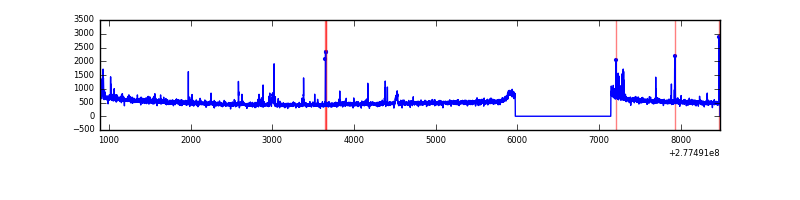 |
| C | 7593 | 6423 | 0 | 0 | 0.00% | 0.00% |  |
| D | 7593 | 6423 | 9 | 9 | 0.12% | 0.14% | 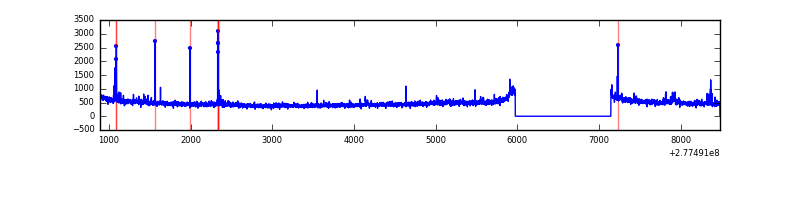 |
Top three noisy pixels from each quadrant. If the there are fewer than three noisy pixels in the level2.evt file, extra rows are filled as -1
| Pixel properties | Quadrant properties | ||||||
|---|---|---|---|---|---|---|---|
| Quadrant | DetID | PixID | Counts | Sigma | Mean | Median | Sigma |
| A | 15 | 174 | 162037 | 990.88 | 809 | 793 | 162.7 |
| A | 15 | 223 | 24502 | 145.7 | 809 | 793 | 162.7 |
| A | 0 | 226 | 7116 | 38.86 | 809 | 793 | 162.7 |
| B | 15 | 35 | 48596 | 309.03 | 812 | 794 | 154.7 |
| B | 0 | 189 | 30872 | 194.45 | 812 | 794 | 154.7 |
| B | 5 | 236 | 28559 | 179.5 | 812 | 794 | 154.7 |
| C | 14 | 238 | 120395 | 670.15 | 765 | 772 | 178.5 |
| C | 3 | 233 | 86467 | 480.08 | 765 | 772 | 178.5 |
| C | 7 | 247 | 21855 | 118.11 | 765 | 772 | 178.5 |
| D | 1 | 52 | 72160 | 378.11 | 772 | 748 | 188.9 |
| D | 12 | 110 | 27884 | 143.68 | 772 | 748 | 188.9 |
| D | 10 | 70 | 23791 | 122.01 | 772 | 748 | 188.9 |
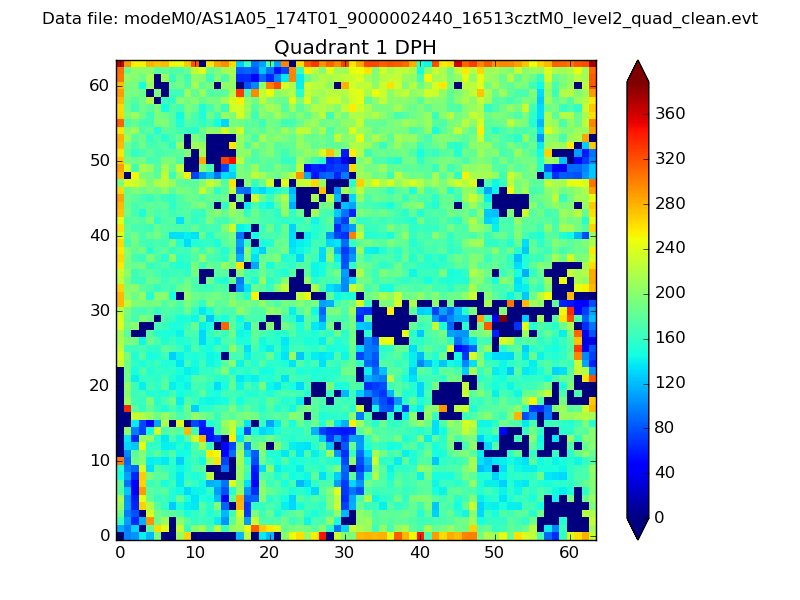
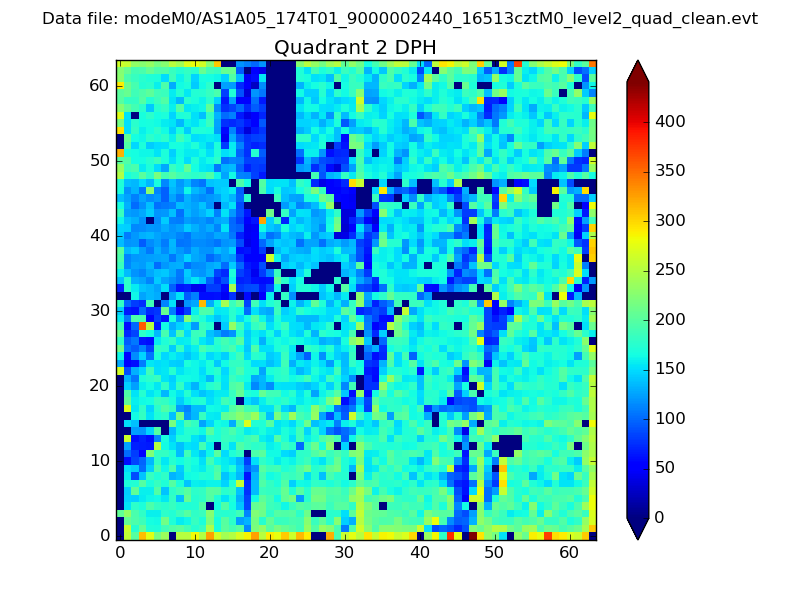
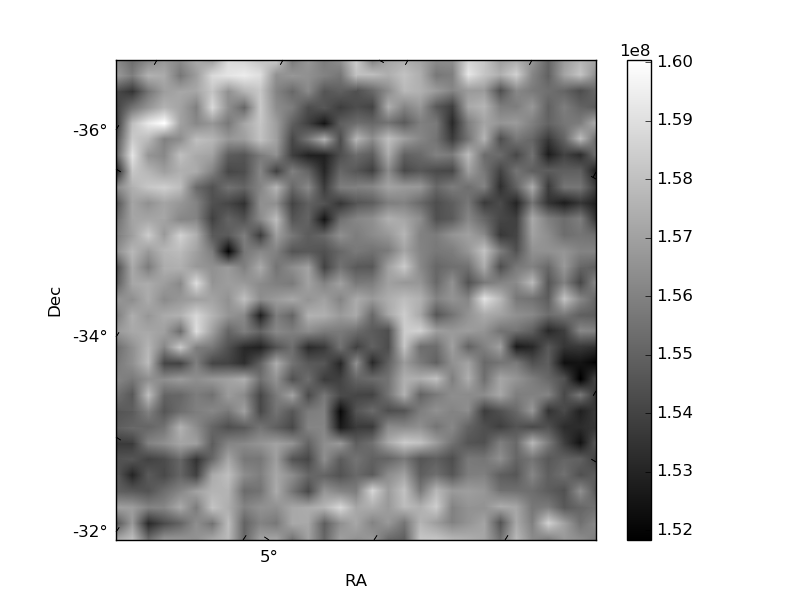
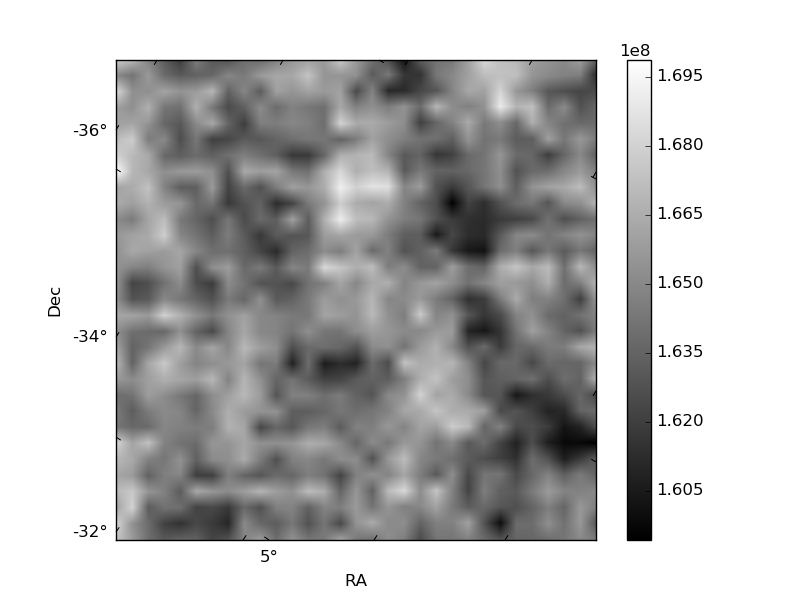
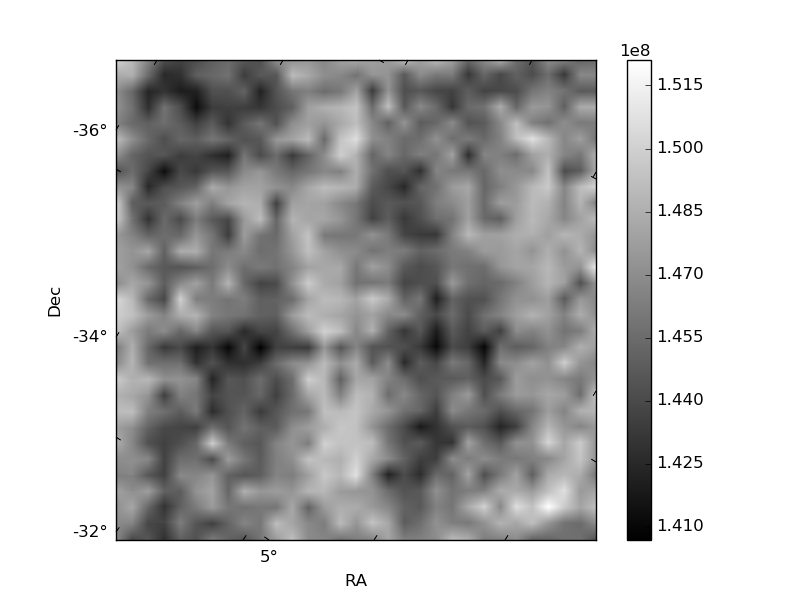
Histogram calculated using DETX and DETY for each event in the final _common_clean file
| Quadrant A | 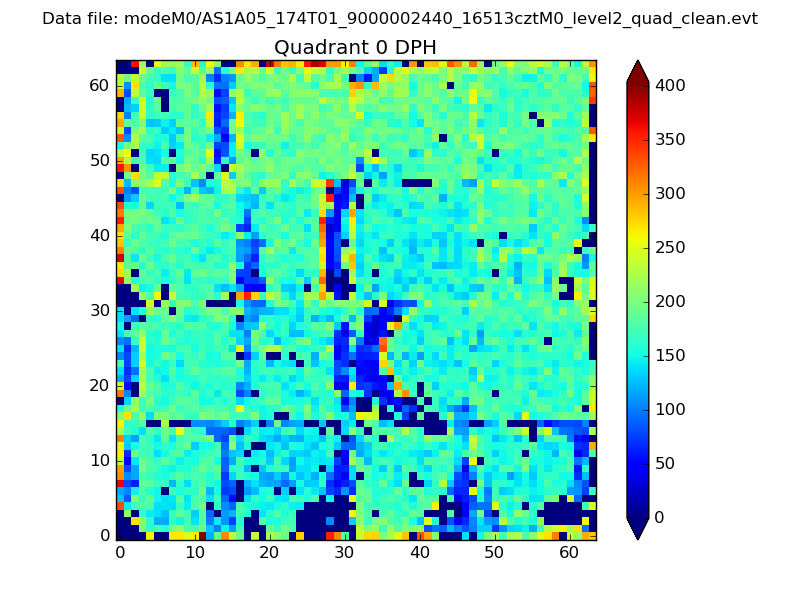 |
 |
Quadrant B |
|---|---|---|---|
| Quadrant D | 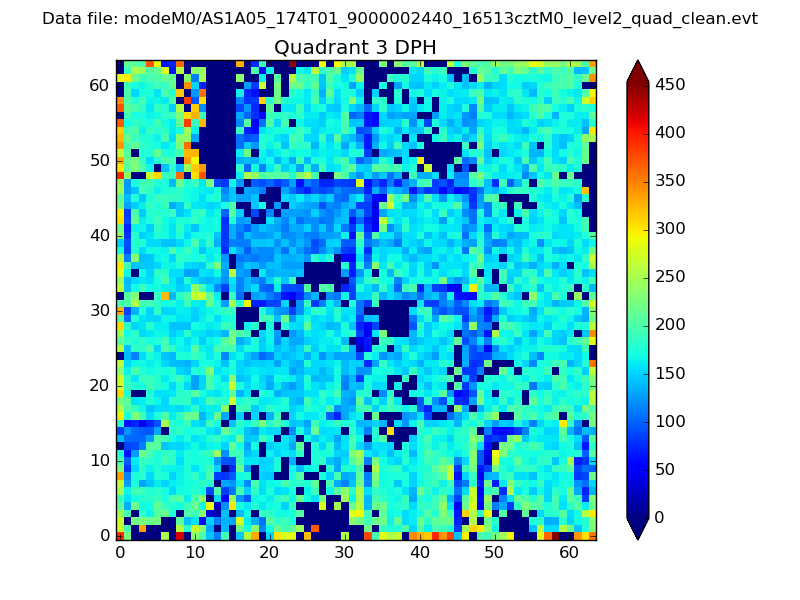 |
 |
Quadrant C |
| Plot type | Count rate plots | Images |
|---|---|---|
| Comparison with Poisson distribution Blue bars denote a histogram of data divided into 1 sec bins. Red curve is a Poisson curve with rate = median count rate of data. |
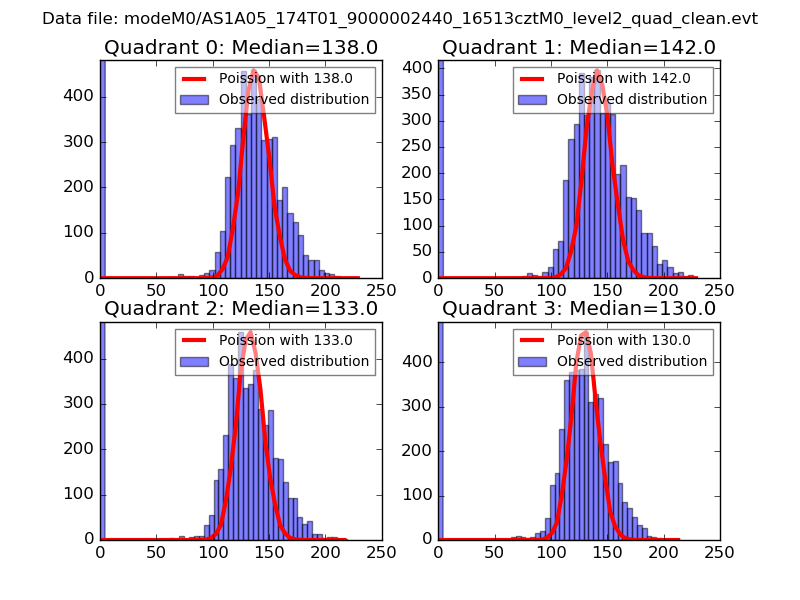 |
 |
| Quadrant-wise count rates Data is divided into 100 sec bins |
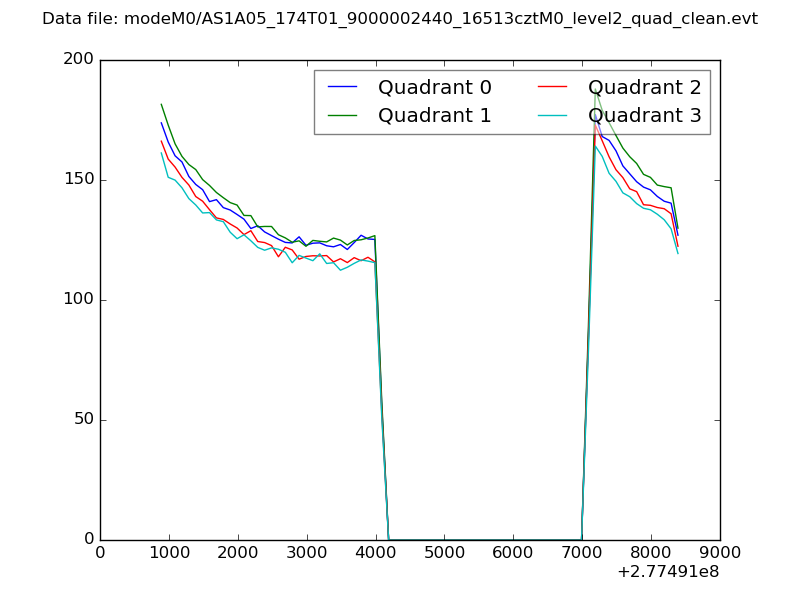 |
|
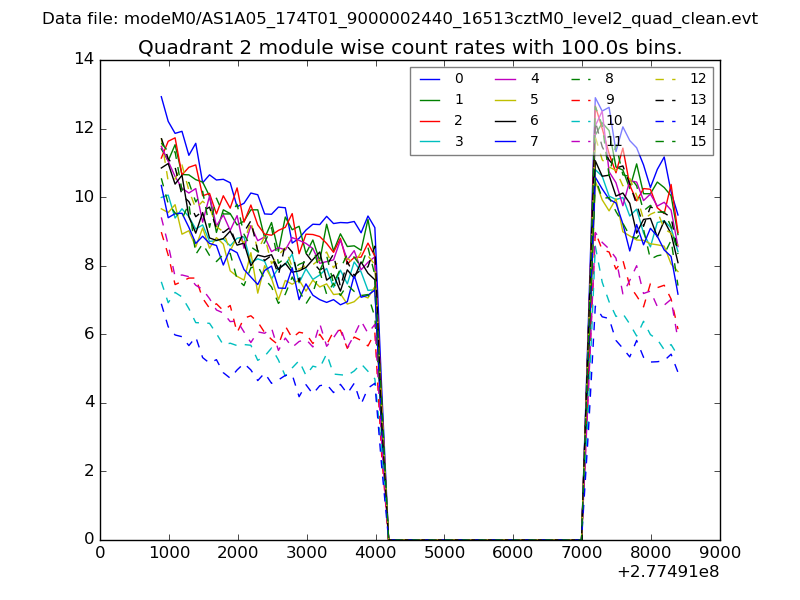
| Module-wise count rates for Quadrant A Data is divided into 100 sec bins |
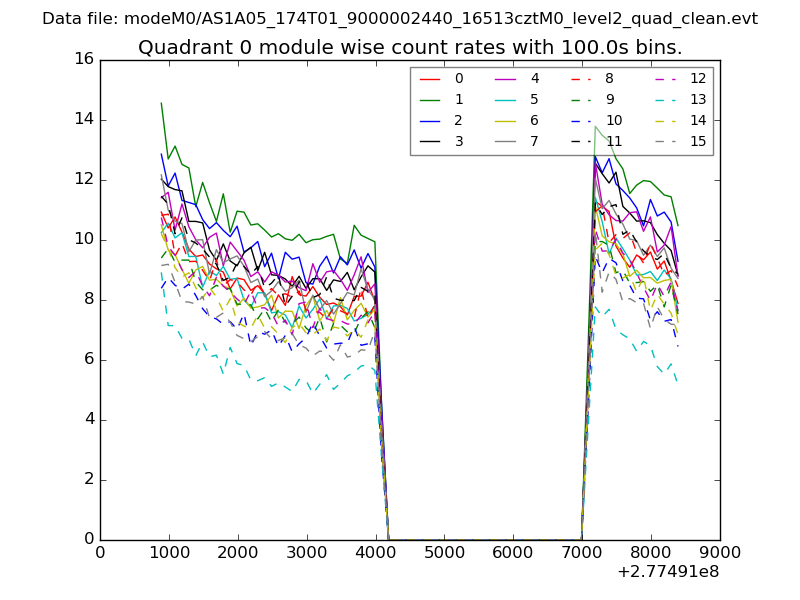 |
 |
| Module-wise count rates for Quadrant B Data is divided into 100 sec bins |
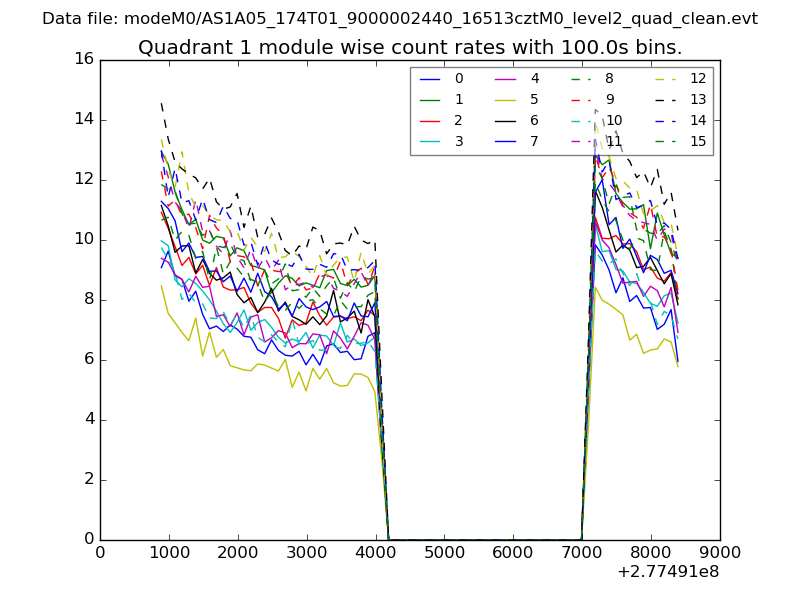 |
 |
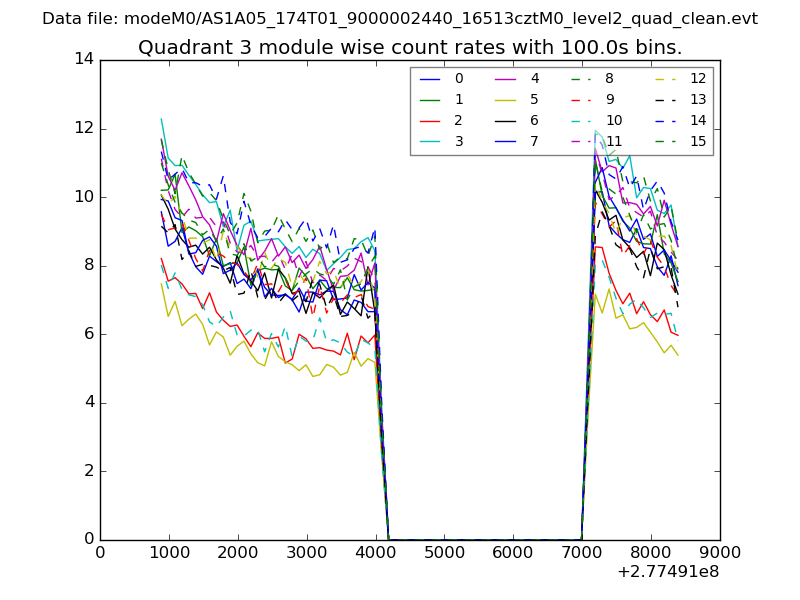
| Module-wise count rates for Quadrant C Data is divided into 100 sec bins |
 |
 |
| Module-wise count rates for Quadrant D Data is divided into 100 sec bins |
 |
 |
| Parameter | Plot |
|---|---|
| CZT HV Monitor | 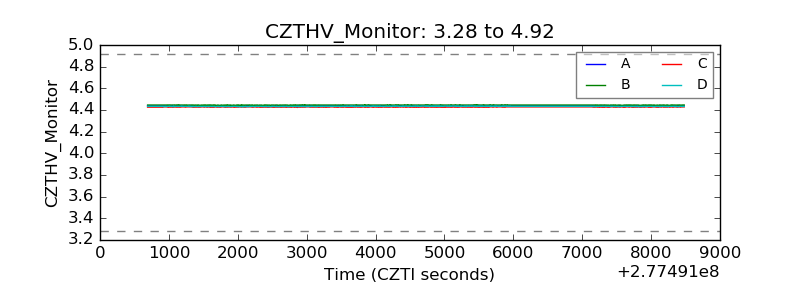 |
| D_VDD | 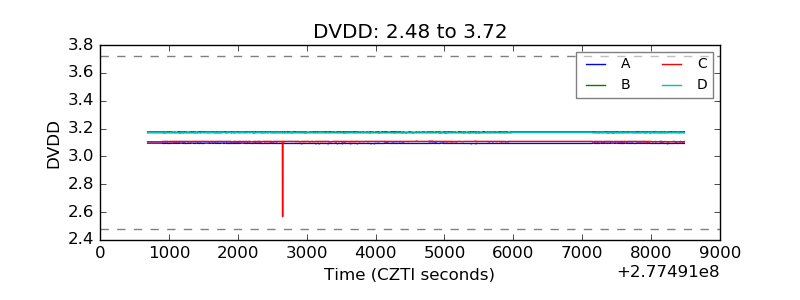 |
| Temperature 1 | 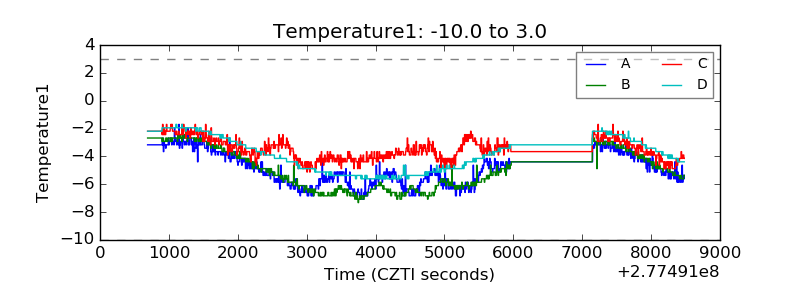 |
| Veto HV Monitor | 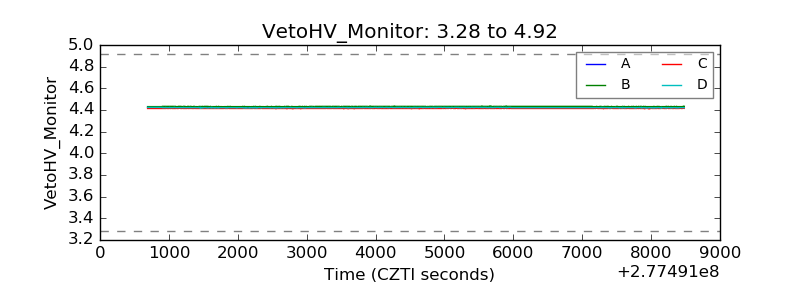 |
| Veto LLD | 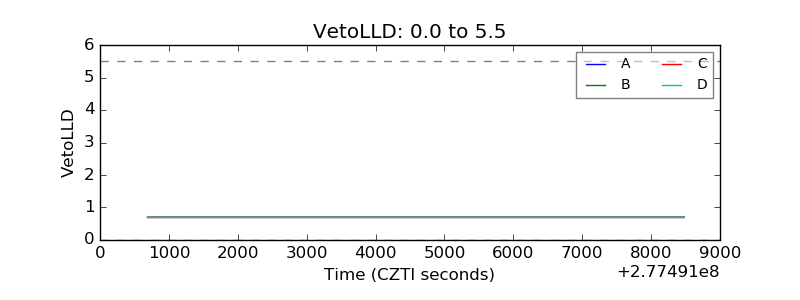 |
| Alpha Counter | 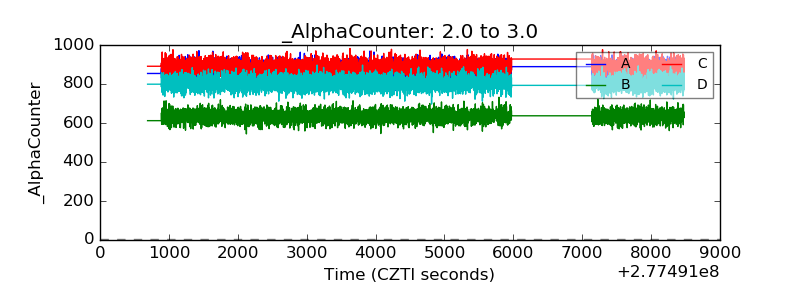 |
| _CPM_Rate | 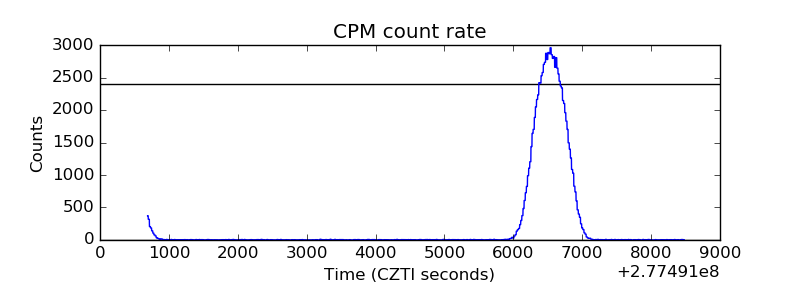 |
| CZT Counter | 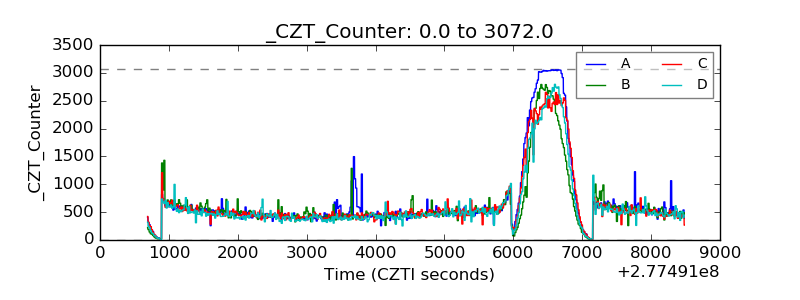 |
| +2.5 Volts monitor |  |
| +5 Volts monitor |  |
| _ROLL_ROT | 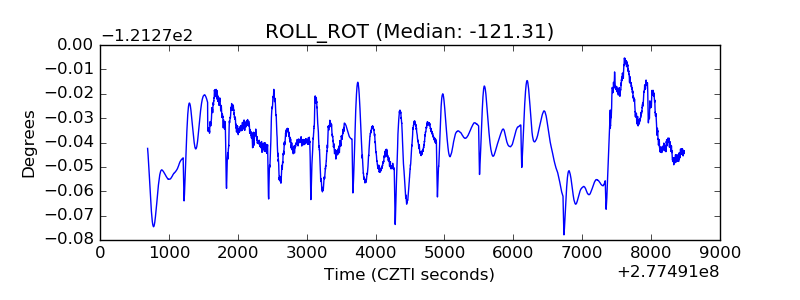 |
| _Roll_DEC | 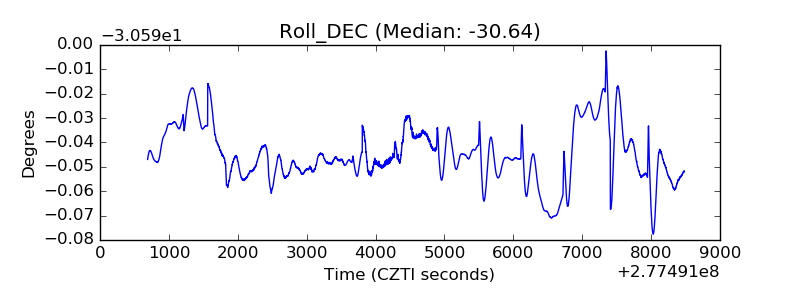 |
| _Roll_RA | 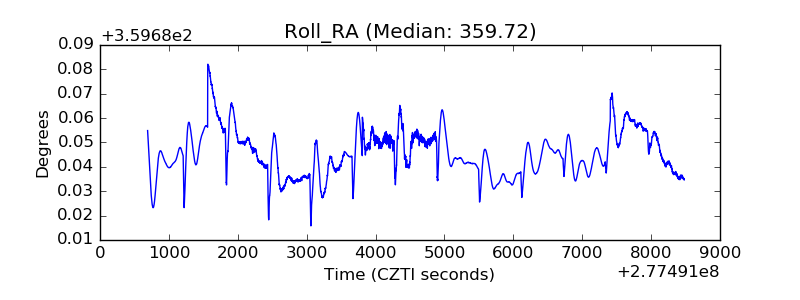 |
| Veto Counter | 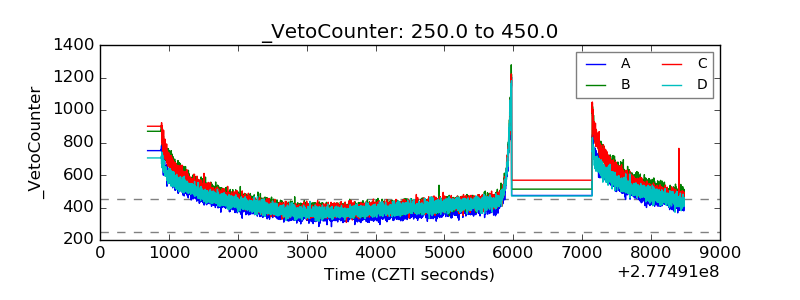 |