| Param | Original file | Final file |
|---|---|---|
| Filename | modeM0/AS1A05_174T01_9000002440_16516cztM0_level2.evt | modeM0/AS1A05_174T01_9000002440_16516cztM0_level2_quad_clean.evt |
| Size (bytes) | 521,161,920 | 93,484,800 |
| Size | 497.0 MB | 89.2 MB |
| Events in quadrant A | 3,372,673 | 603,678 |
| Events in quadrant B | 3,271,537 | 628,236 |
| Events in quadrant C | 5,633,198 | 568,945 |
| Events in quadrant D | 3,065,341 | 577,106 |
| Mode M9 | |||
|---|---|---|---|
| Quadrant | BADHDUFLAG | Total packets | Discarded packets |
| A | 0 | 19 | 0 |
| B | 0 | 19 | 0 |
| C | 0 | 19 | 0 |
| D | 0 | 20 | 0 |
| Mode SS | |||
|---|---|---|---|
| Quadrant | BADHDUFLAG | Total packets | Discarded packets |
| A | 0 | 132 | 0 |
| B | 0 | 132 | 0 |
| C | 0 | 132 | 0 |
| D | 0 | 132 | 0 |
| Mode M0 | |||
|---|---|---|---|
| Quadrant | BADHDUFLAG | Total packets | Discarded packets |
| A | 0 | 14136 | 3 |
| B | 0 | 13783 | 2 |
| C | 0 | 21078 | 2 |
| D | 0 | 13584 | 2 |
| Quadrant | Total seconds | Saturated seconds | Saturation percentage |
|---|---|---|---|
| A | 6493 | 40 | 0.616048% |
| B | 6493 | 41 | 0.631449% |
| C | 6493 | 739 | 11.381488% |
| D | 6493 | 16 | 0.246419% |
Noise dominated data is calculated using 1-second bins in cleaned event files. If a bin has >2000 counts, and if more than 50% of those come from <1% of pixels, then it is considered to be noise-dominated and hence unusable.
| Quadrant | # 1 sec bins | Bins with >0 counts | Bins with >2000 counts | High rate bins dominated by noise | Noise dominated (total time) | Noise dominated (detector-on time) | Marked lightcurve |
|---|---|---|---|---|---|---|---|
| A | 7799 | 6495 | 19 | 19 | 0.24% | 0.29% | 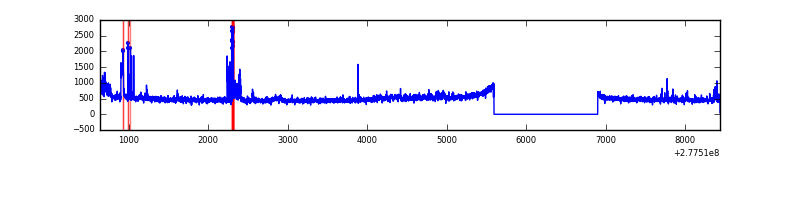 |
| B | 7799 | 6495 | 2 | 2 | 0.03% | 0.03% | 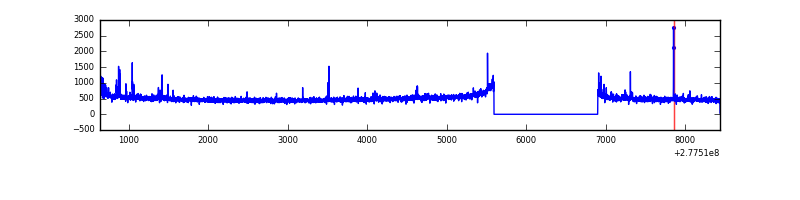 |
| C | 7799 | 6494 | 548 | 548 | 7.03% | 8.44% |  |
| D | 7799 | 6495 | 6 | 6 | 0.08% | 0.09% | 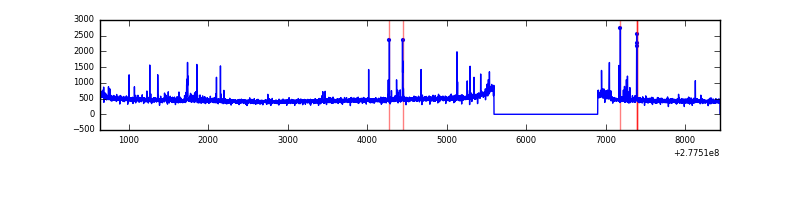 |
Top three noisy pixels from each quadrant. If the there are fewer than three noisy pixels in the level2.evt file, extra rows are filled as -1
| Pixel properties | Quadrant properties | ||||||
|---|---|---|---|---|---|---|---|
| Quadrant | DetID | PixID | Counts | Sigma | Mean | Median | Sigma |
| A | 15 | 174 | 269112 | 1679.66 | 799 | 785 | 159.8 |
| A | 15 | 223 | 19639 | 118.02 | 799 | 785 | 159.8 |
| A | 15 | 239 | 8066 | 45.58 | 799 | 785 | 159.8 |
| B | 15 | 35 | 42333 | 271.82 | 812 | 794 | 152.8 |
| B | 12 | 111 | 18021 | 112.73 | 812 | 794 | 152.8 |
| B | 4 | 48 | 15549 | 96.55 | 812 | 794 | 152.8 |
| C | 3 | 233 | 2577289 | 14611.98 | 753 | 759 | 176.3 |
| C | 14 | 238 | 114849 | 647.02 | 753 | 759 | 176.3 |
| C | 7 | 247 | 5466 | 26.69 | 753 | 759 | 176.3 |
| D | 10 | 70 | 78745 | 407.81 | 780 | 757 | 191.2 |
| D | 5 | 222 | 23104 | 116.86 | 780 | 757 | 191.2 |
| D | 2 | 234 | 22533 | 113.87 | 780 | 757 | 191.2 |
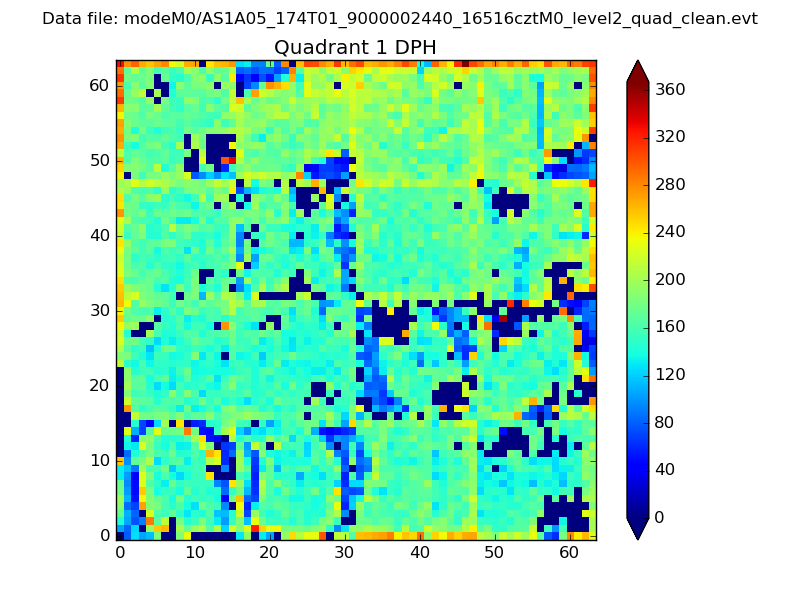
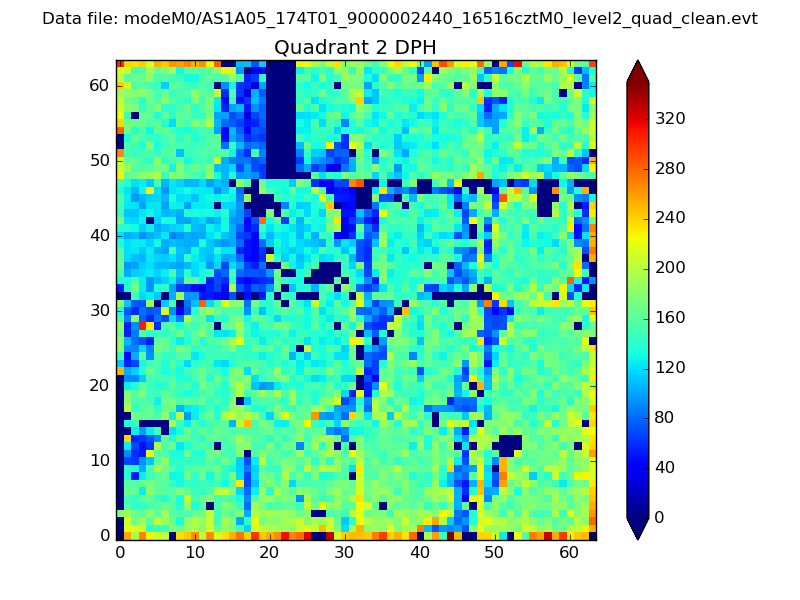
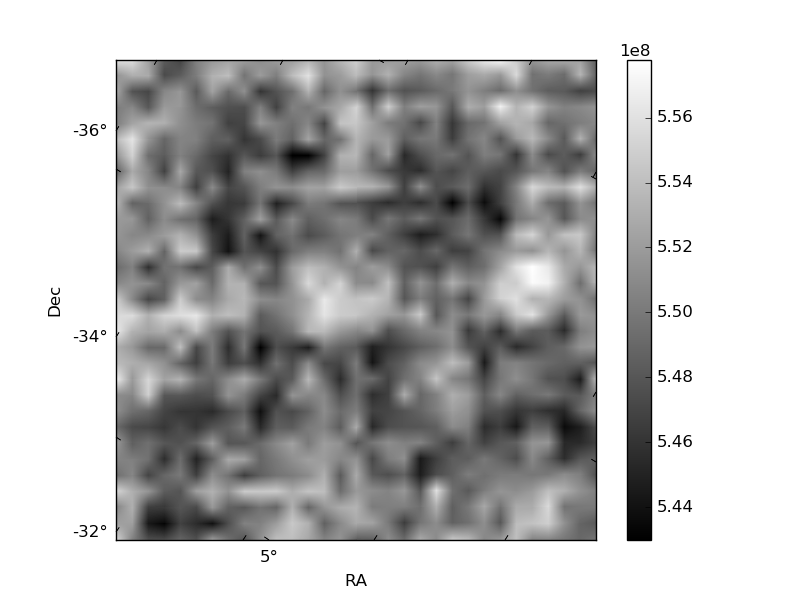
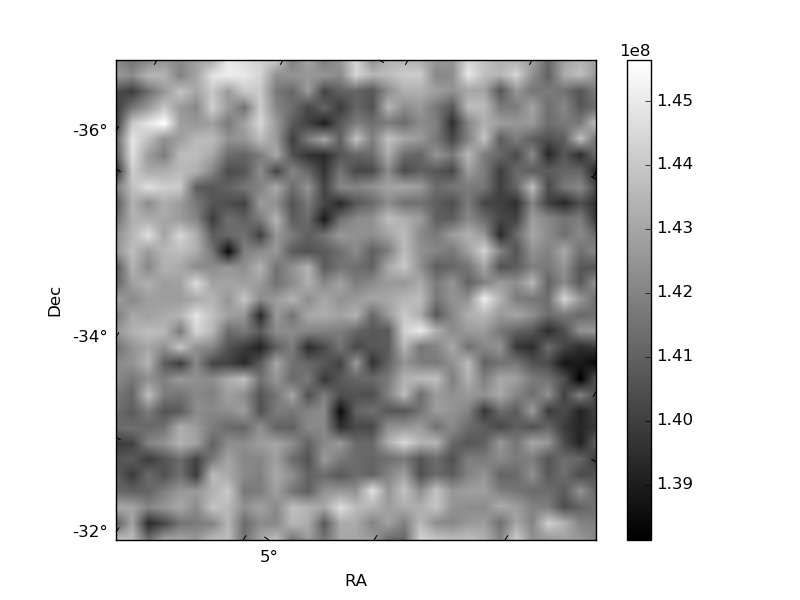
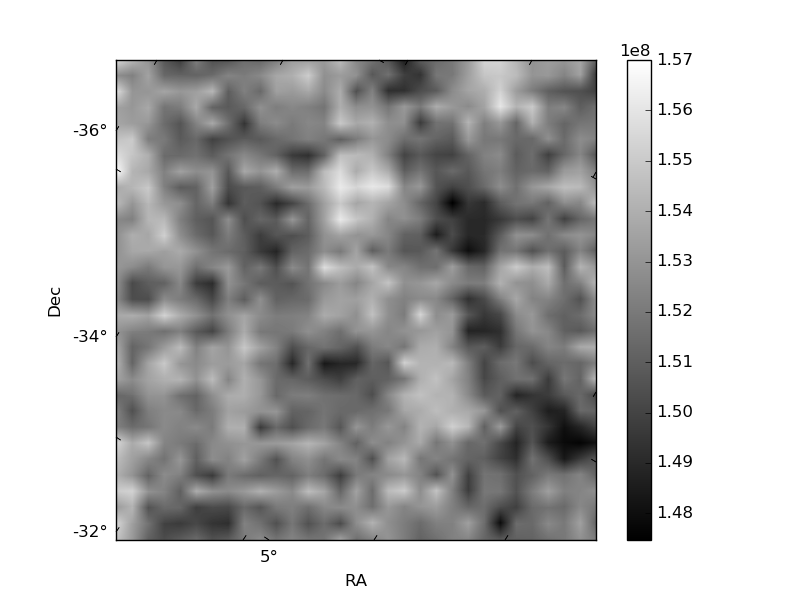
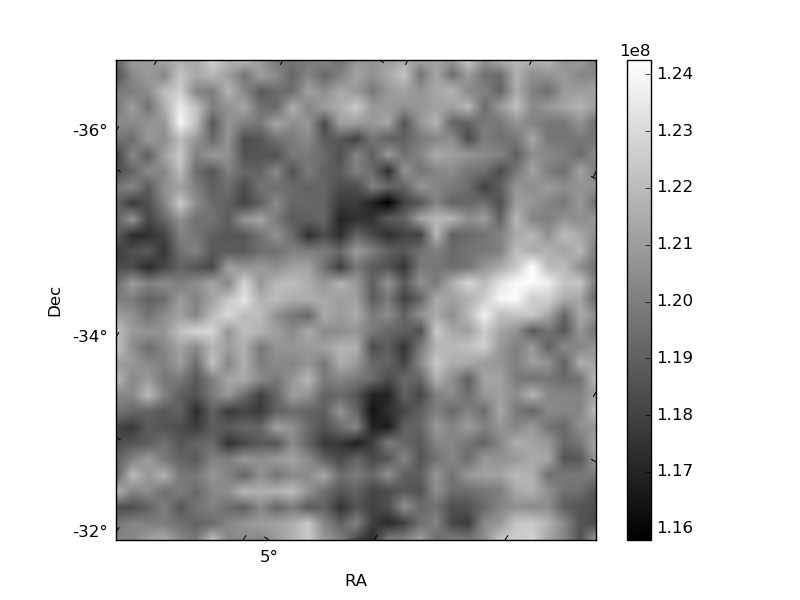
Histogram calculated using DETX and DETY for each event in the final _common_clean file
| Quadrant A | 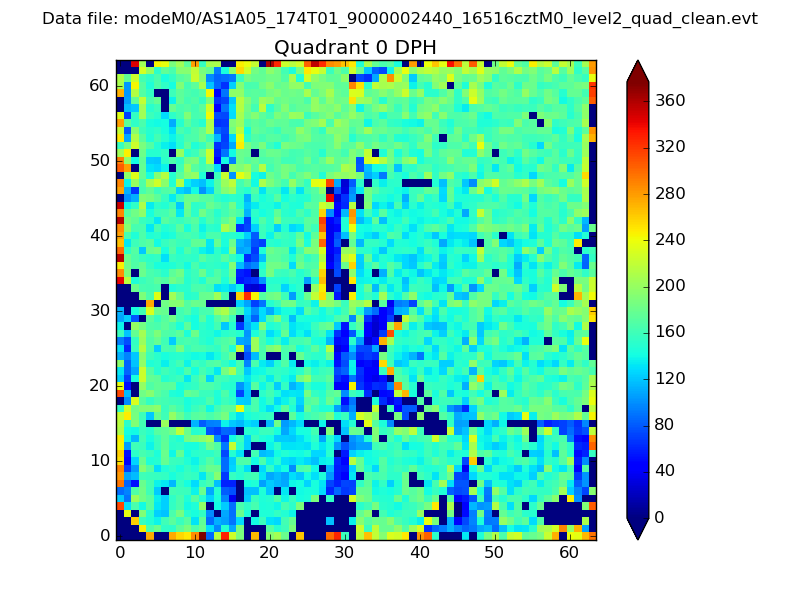 |
 |
Quadrant B |
|---|---|---|---|
| Quadrant D | 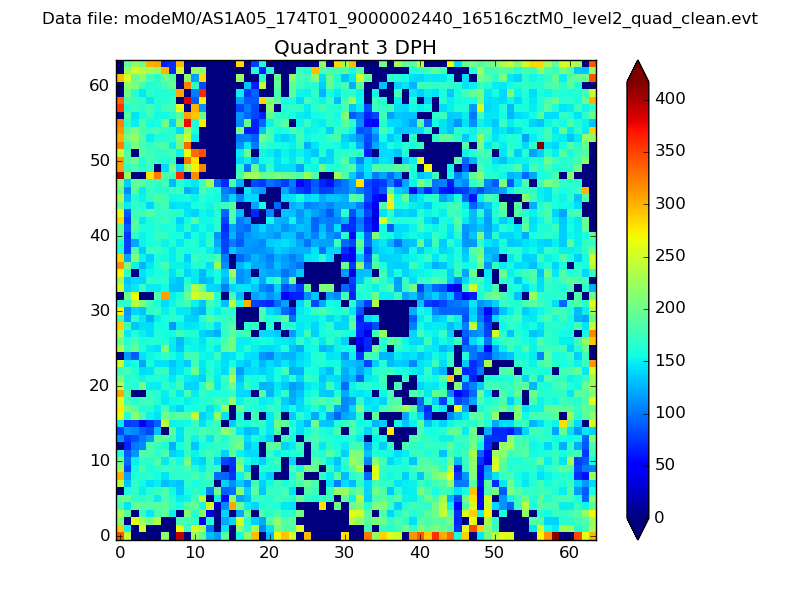 |
 |
Quadrant C |
| Plot type | Count rate plots | Images |
|---|---|---|
| Comparison with Poisson distribution Blue bars denote a histogram of data divided into 1 sec bins. Red curve is a Poisson curve with rate = median count rate of data. |
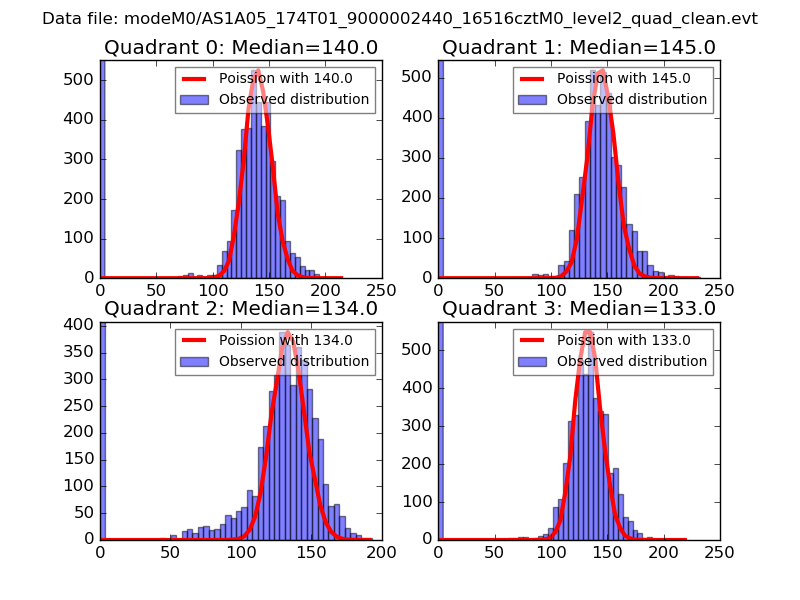 |
 |
| Quadrant-wise count rates Data is divided into 100 sec bins |
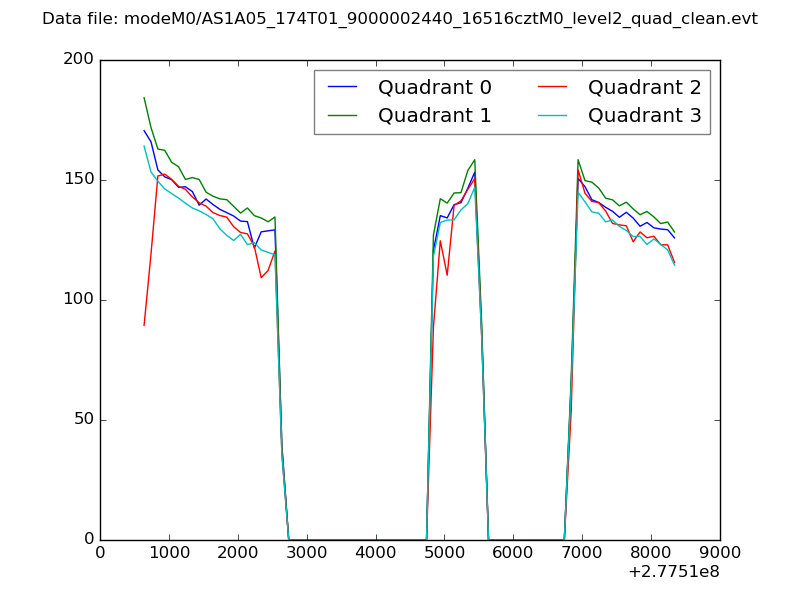 |
|
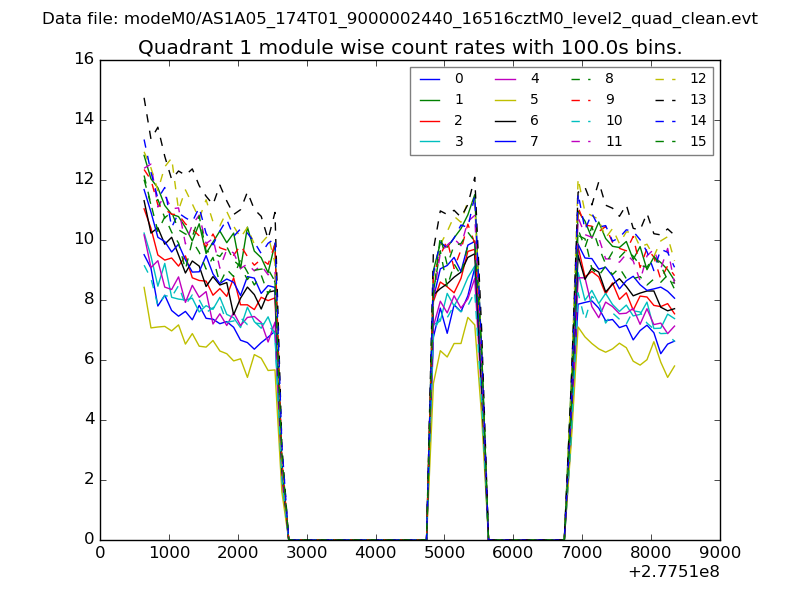
| Module-wise count rates for Quadrant A Data is divided into 100 sec bins |
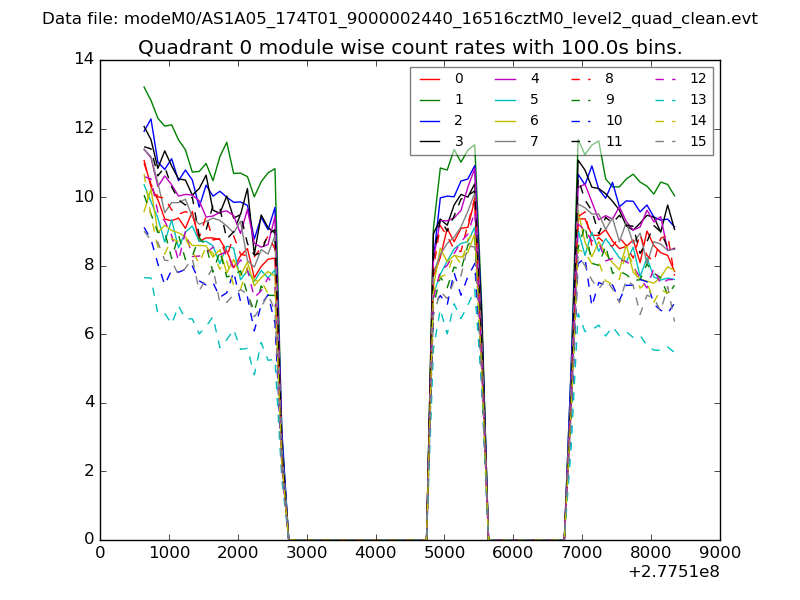 |
 |
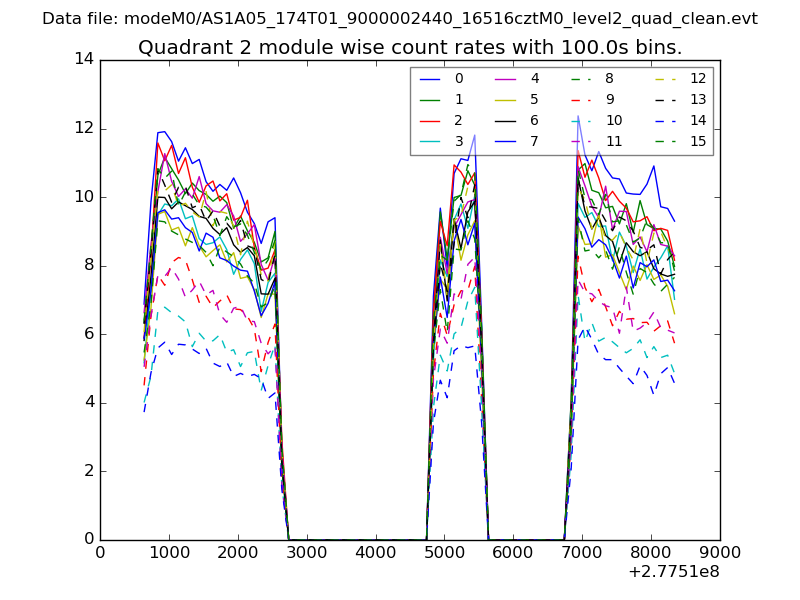
| Module-wise count rates for Quadrant B Data is divided into 100 sec bins |
 |
 |
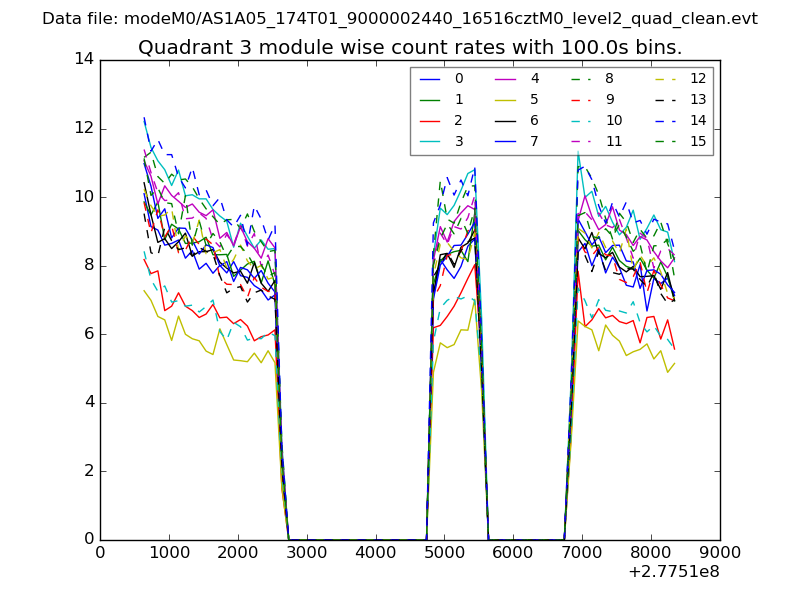
| Module-wise count rates for Quadrant C Data is divided into 100 sec bins |
 |
 |
| Module-wise count rates for Quadrant D Data is divided into 100 sec bins |
 |
 |
| Parameter | Plot |
|---|---|
| CZT HV Monitor | 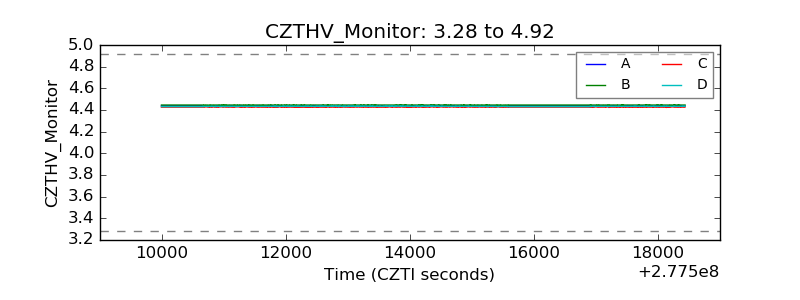 |
| D_VDD | 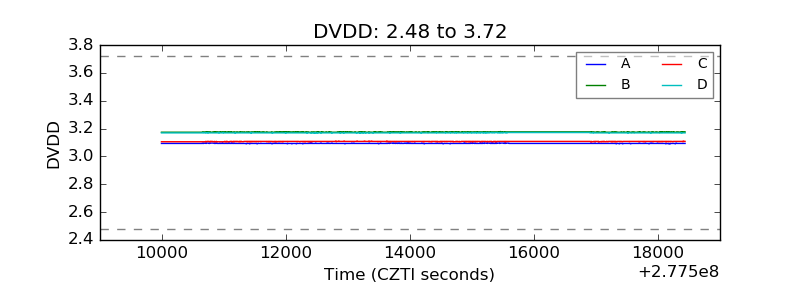 |
| Temperature 1 | 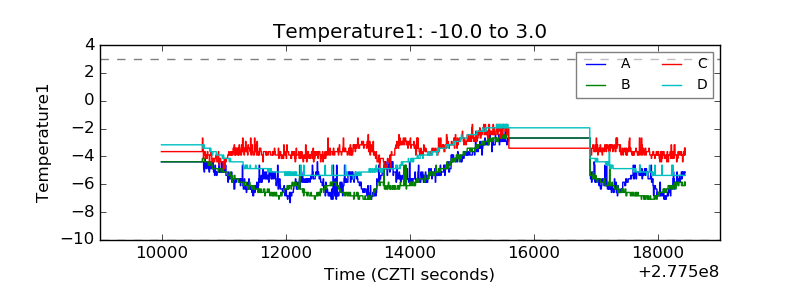 |
| Veto HV Monitor | 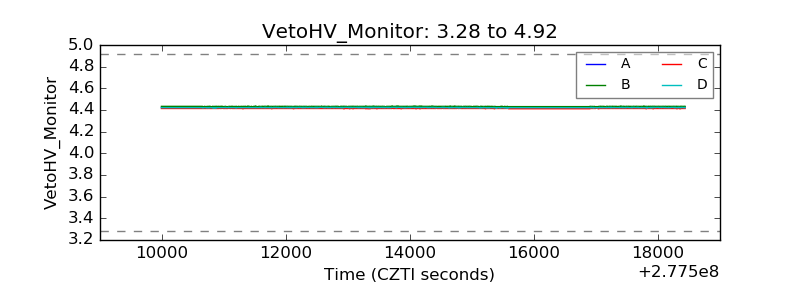 |
| Veto LLD | 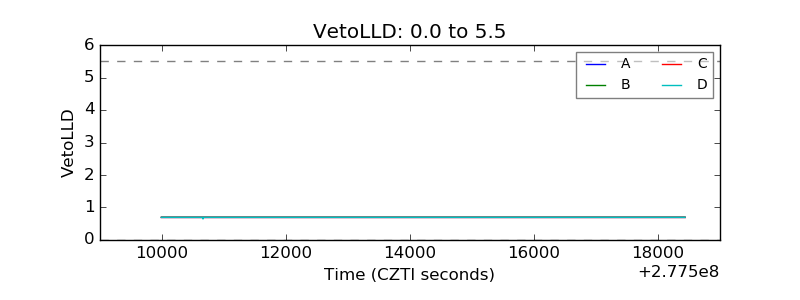 |
| Alpha Counter | 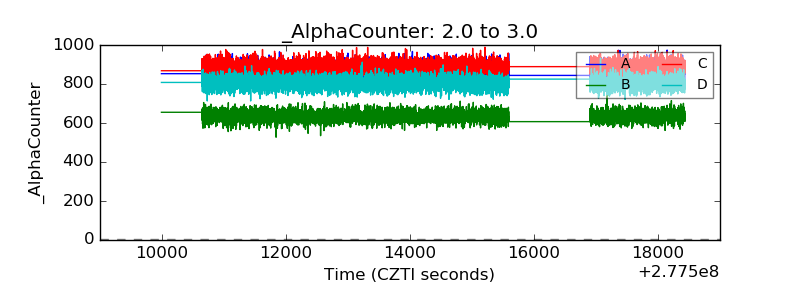 |
| _CPM_Rate | 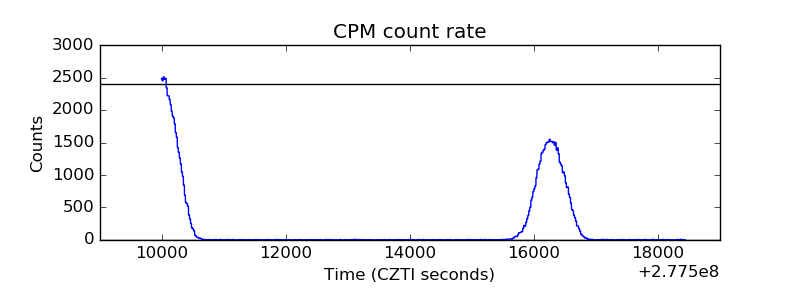 |
| CZT Counter | 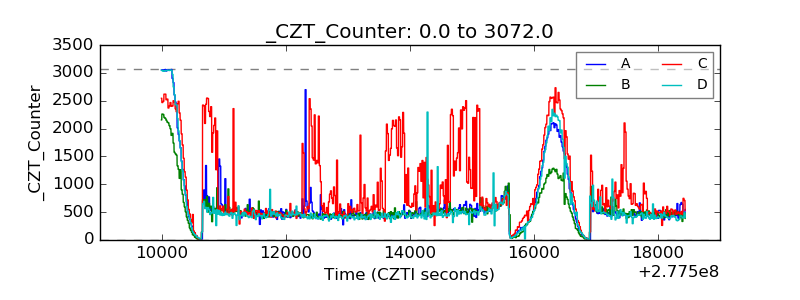 |
| +2.5 Volts monitor |  |
| +5 Volts monitor |  |
| _ROLL_ROT | 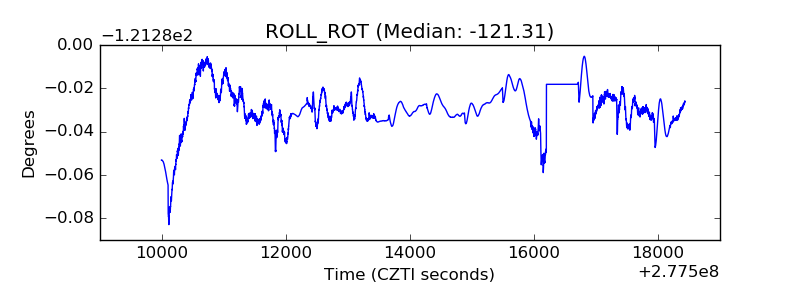 |
| _Roll_DEC | 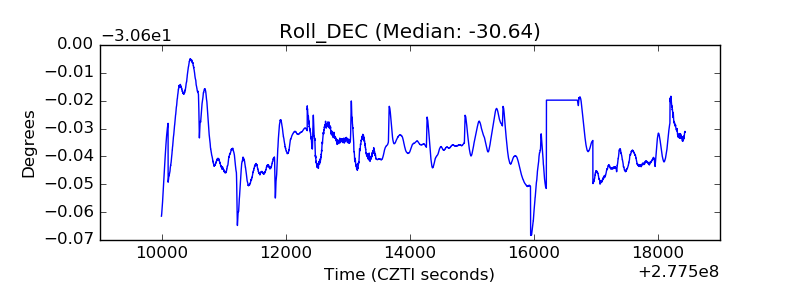 |
| _Roll_RA | 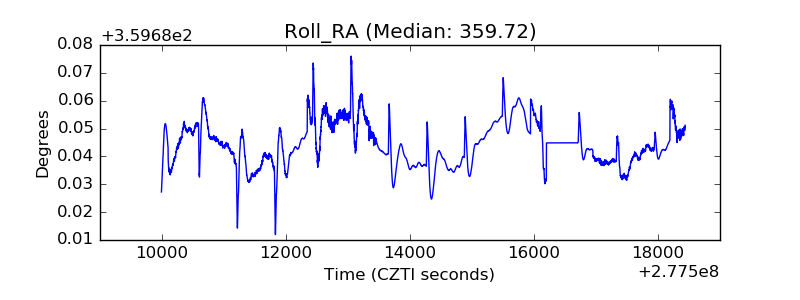 |
| Veto Counter | 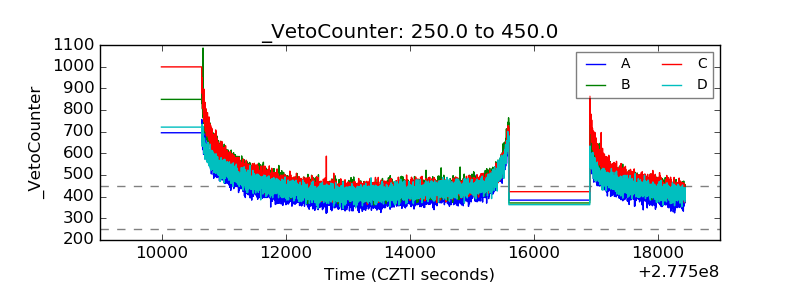 |