| Param | Original file | Final file |
|---|---|---|
| Filename | modeM0/AS1A05_174T01_9000002440_16517cztM0_level2.evt | modeM0/AS1A05_174T01_9000002440_16517cztM0_level2_quad_clean.evt |
| Size (bytes) | 554,051,520 | 86,794,560 |
| Size | 528.4 MB | 82.8 MB |
| Events in quadrant A | 3,464,450 | 553,777 |
| Events in quadrant B | 3,388,499 | 574,261 |
| Events in quadrant C | 6,369,362 | 502,208 |
| Events in quadrant D | 3,106,646 | 534,637 |
| Mode M9 | |||
|---|---|---|---|
| Quadrant | BADHDUFLAG | Total packets | Discarded packets |
| A | 0 | 12 | 0 |
| B | 0 | 12 | 0 |
| C | 0 | 12 | 0 |
| D | 0 | 13 | 0 |
| Mode SS | |||
|---|---|---|---|
| Quadrant | BADHDUFLAG | Total packets | Discarded packets |
| A | 0 | 134 | 0 |
| B | 0 | 134 | 0 |
| C | 0 | 134 | 0 |
| D | 0 | 134 | 0 |
| Mode M0 | |||
|---|---|---|---|
| Quadrant | BADHDUFLAG | Total packets | Discarded packets |
| A | 0 | 14605 | 3 |
| B | 0 | 14286 | 2 |
| C | 0 | 23302 | 2 |
| D | 0 | 13871 | 2 |
| Quadrant | Total seconds | Saturated seconds | Saturation percentage |
|---|---|---|---|
| A | 6644 | 104 | 1.565322% |
| B | 6644 | 53 | 0.797712% |
| C | 6644 | 1120 | 16.857315% |
| D | 6644 | 14 | 0.210716% |
Noise dominated data is calculated using 1-second bins in cleaned event files. If a bin has >2000 counts, and if more than 50% of those come from <1% of pixels, then it is considered to be noise-dominated and hence unusable.
| Quadrant | # 1 sec bins | Bins with >0 counts | Bins with >2000 counts | High rate bins dominated by noise | Noise dominated (total time) | Noise dominated (detector-on time) | Marked lightcurve |
|---|---|---|---|---|---|---|---|
| A | 7755 | 6645 | 19 | 19 | 0.25% | 0.29% | 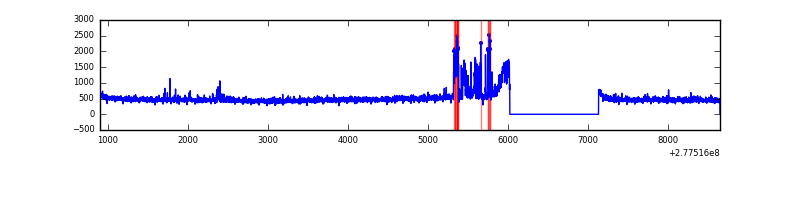 |
| B | 7755 | 6645 | 3 | 3 | 0.04% | 0.05% | 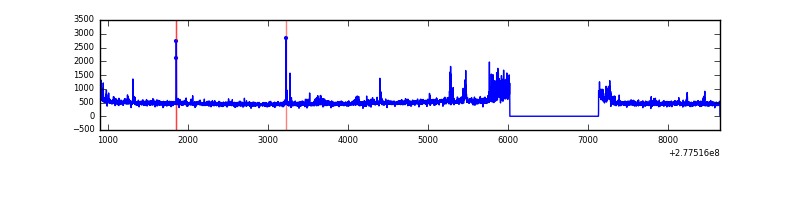 |
| C | 7754 | 6644 | 927 | 927 | 11.96% | 13.95% | 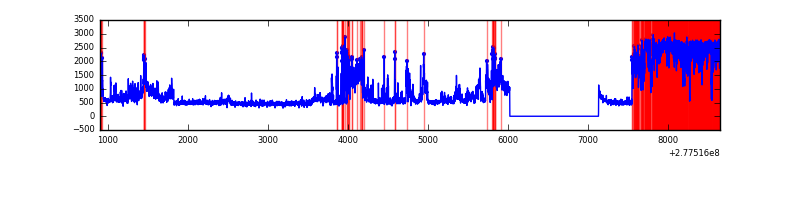 |
| D | 7755 | 6646 | 8 | 8 | 0.10% | 0.12% | 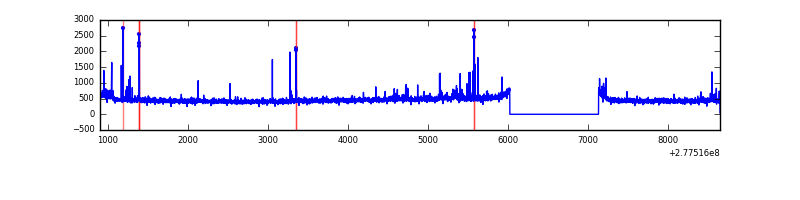 |
Top three noisy pixels from each quadrant. If the there are fewer than three noisy pixels in the level2.evt file, extra rows are filled as -1
| Pixel properties | Quadrant properties | ||||||
|---|---|---|---|---|---|---|---|
| Quadrant | DetID | PixID | Counts | Sigma | Mean | Median | Sigma |
| A | 15 | 174 | 352203 | 2201.47 | 795 | 781 | 159.6 |
| A | 15 | 223 | 40039 | 245.93 | 795 | 781 | 159.6 |
| A | 15 | 239 | 13940 | 82.43 | 795 | 781 | 159.6 |
| B | 15 | 35 | 127329 | 824.25 | 808 | 788 | 153.5 |
| B | 4 | 48 | 23986 | 151.11 | 808 | 788 | 153.5 |
| B | 12 | 111 | 18326 | 114.24 | 808 | 788 | 153.5 |
| C | 3 | 233 | 3390352 | 19766.7 | 731 | 736 | 171.5 |
| C | 14 | 238 | 112232 | 650.19 | 731 | 736 | 171.5 |
| C | 7 | 247 | 14723 | 81.57 | 731 | 736 | 171.5 |
| D | 5 | 222 | 75917 | 394.42 | 780 | 758 | 190.6 |
| D | 10 | 70 | 51616 | 266.89 | 780 | 758 | 190.6 |
| D | 1 | 52 | 33307 | 170.81 | 780 | 758 | 190.6 |
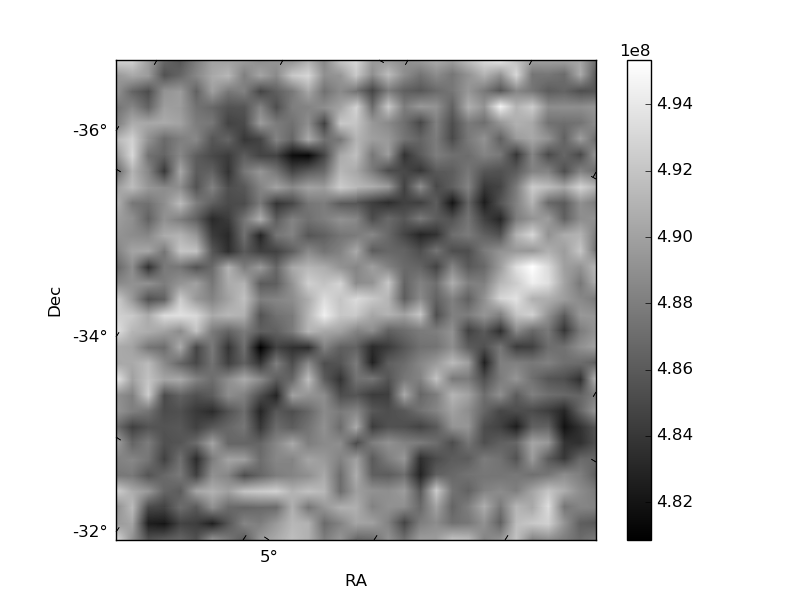
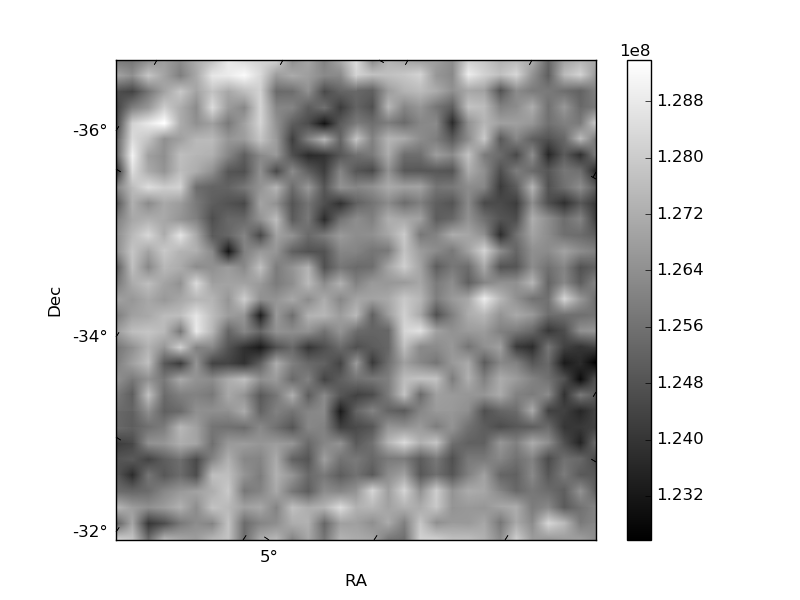
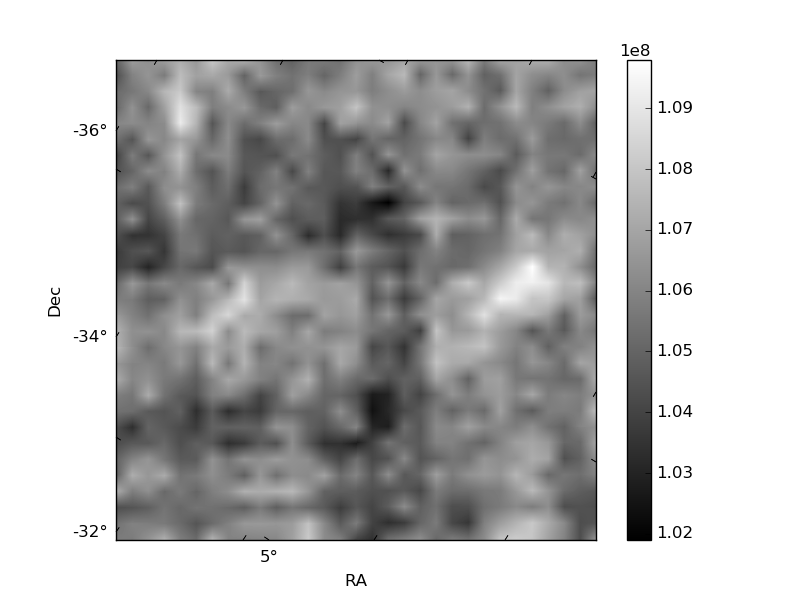
Histogram calculated using DETX and DETY for each event in the final _common_clean file
| Quadrant A | 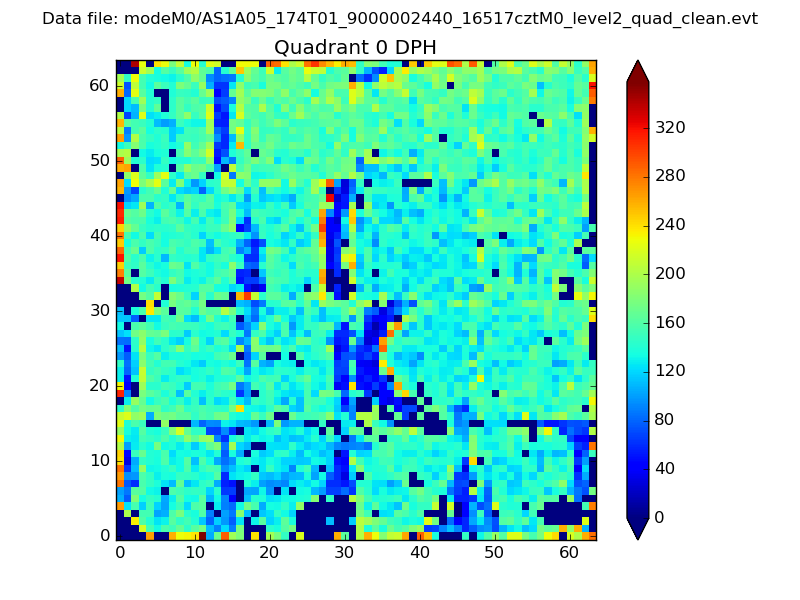 |
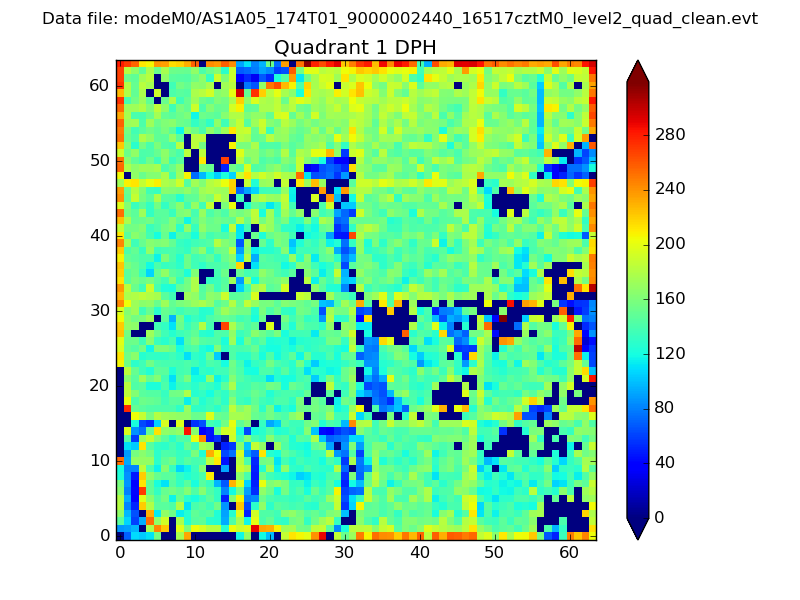 |
Quadrant B |
|---|---|---|---|
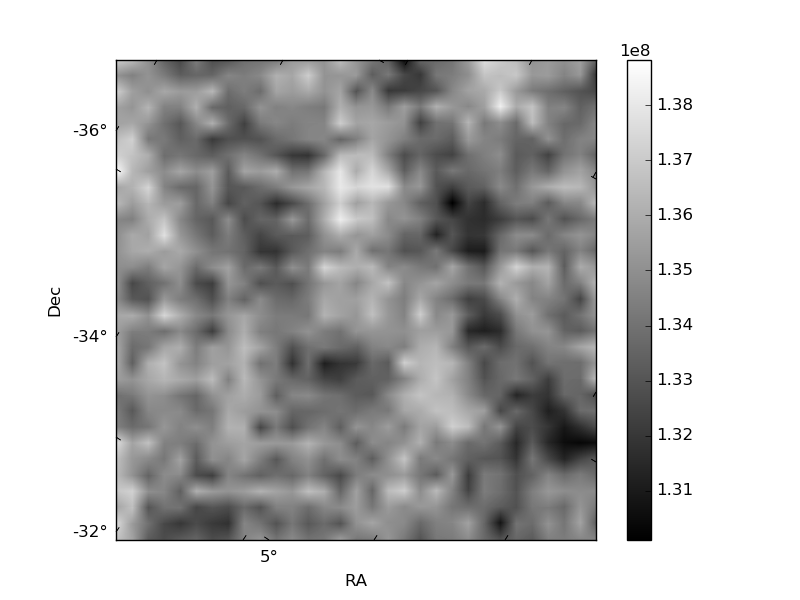
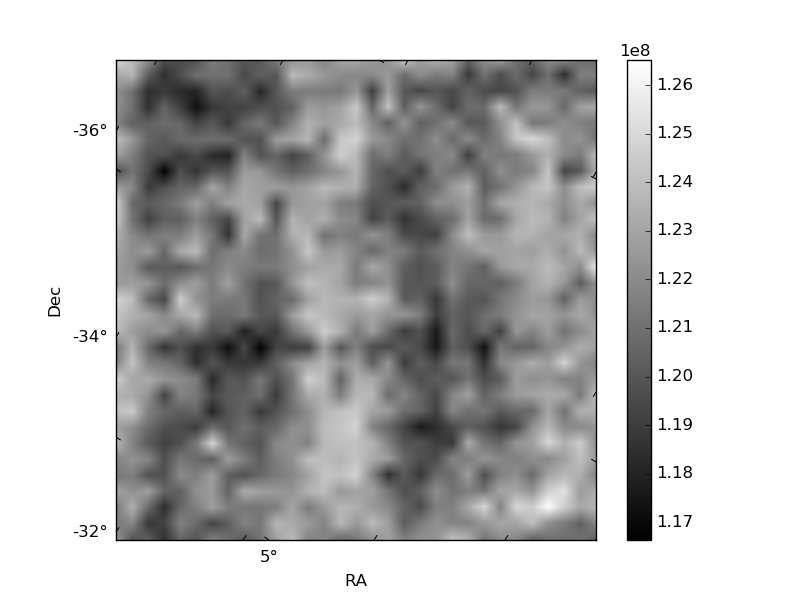
| Quadrant D | 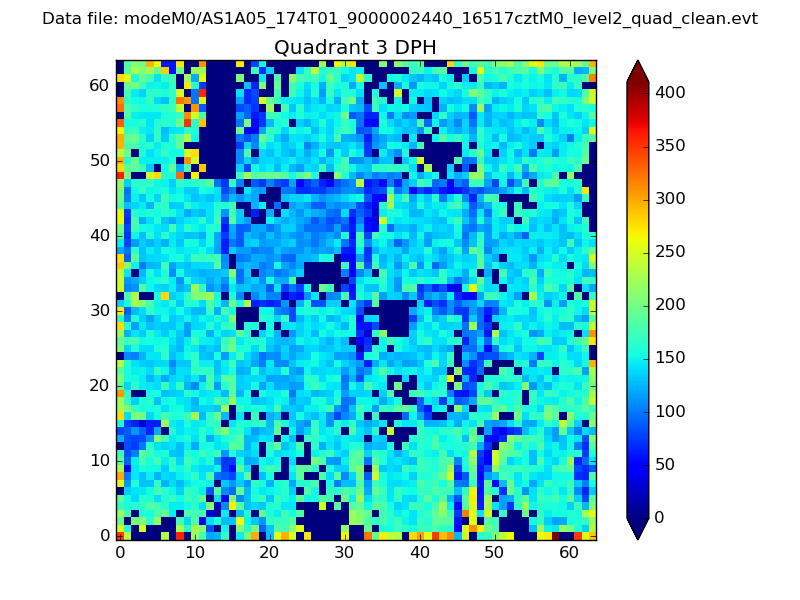 |
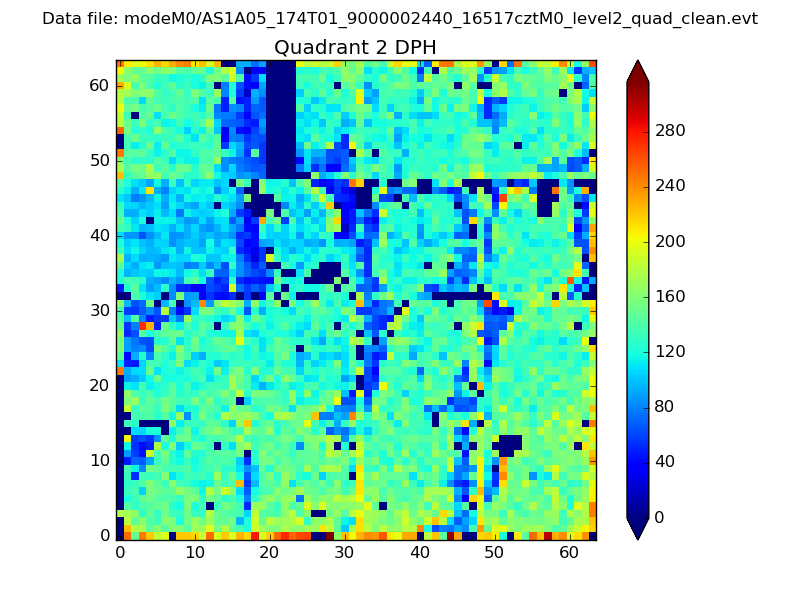 |
Quadrant C |
| Plot type | Count rate plots | Images |
|---|---|---|
| Comparison with Poisson distribution Blue bars denote a histogram of data divided into 1 sec bins. Red curve is a Poisson curve with rate = median count rate of data. |
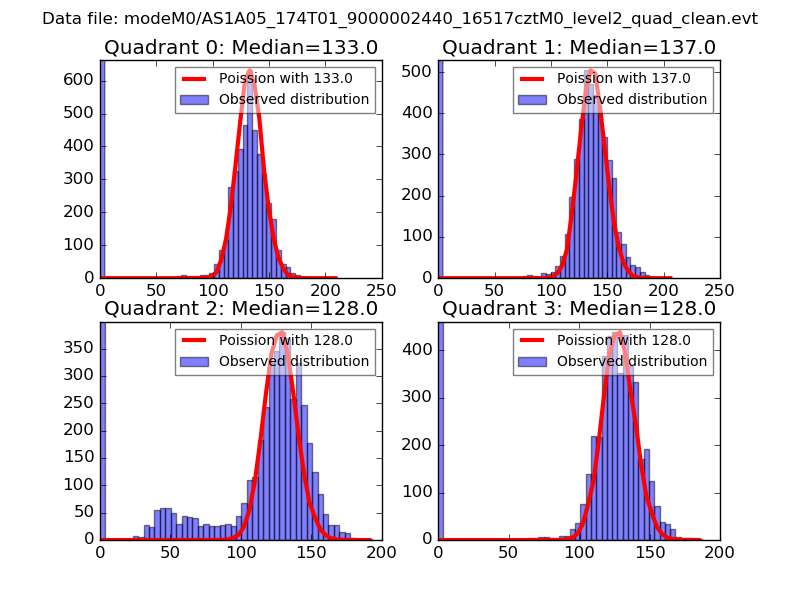 |
 |
| Quadrant-wise count rates Data is divided into 100 sec bins |
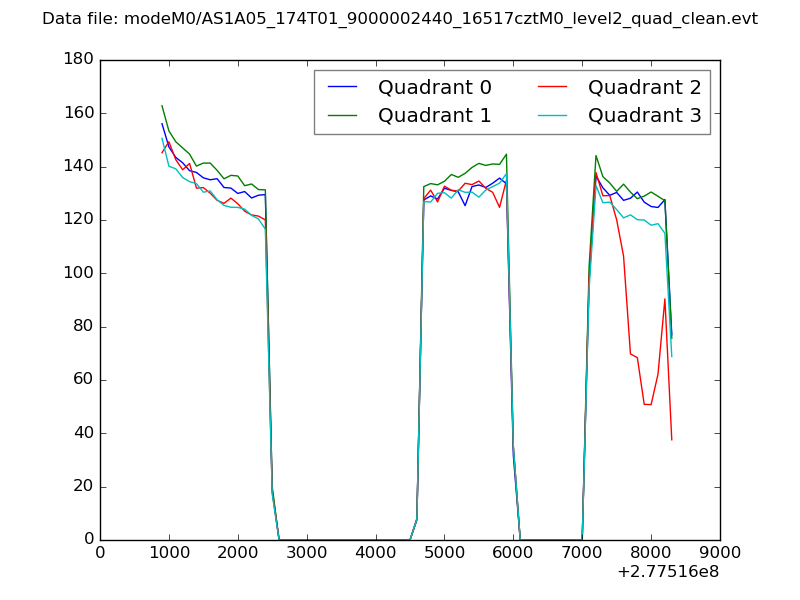 |
|
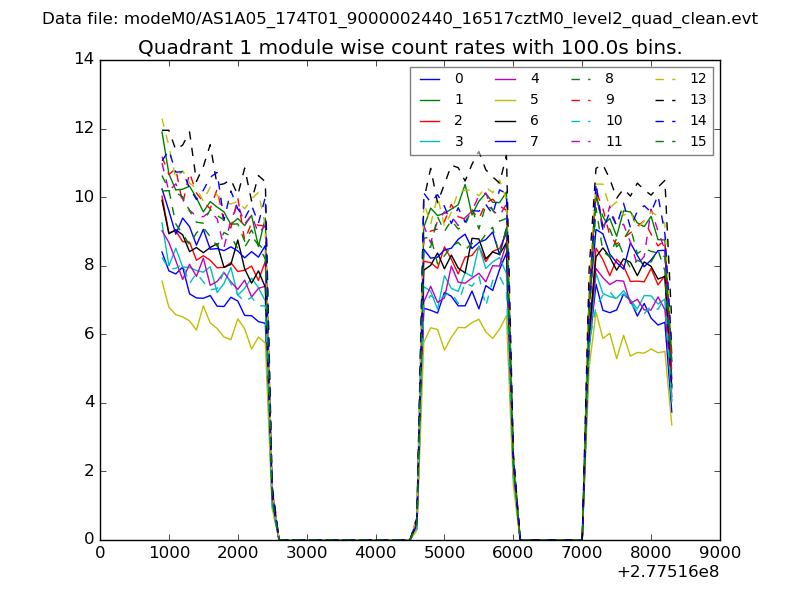
| Module-wise count rates for Quadrant A Data is divided into 100 sec bins |
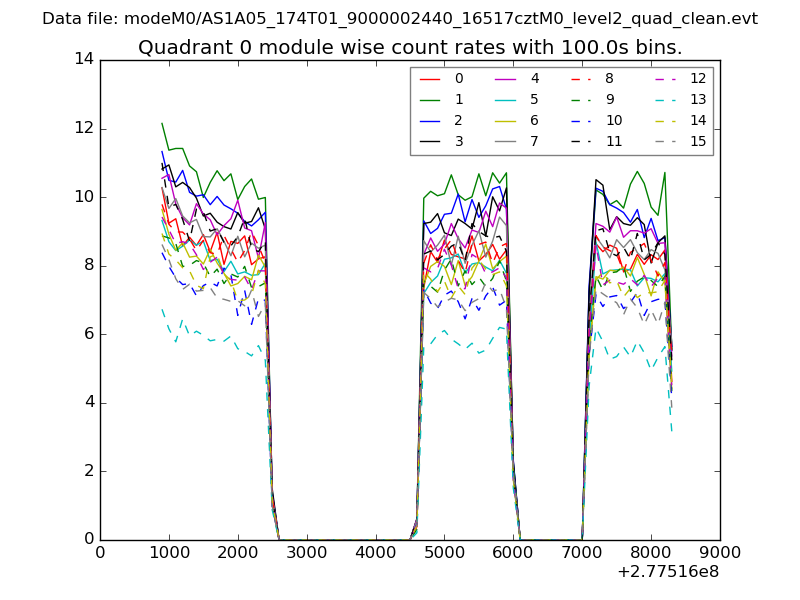 |
 |
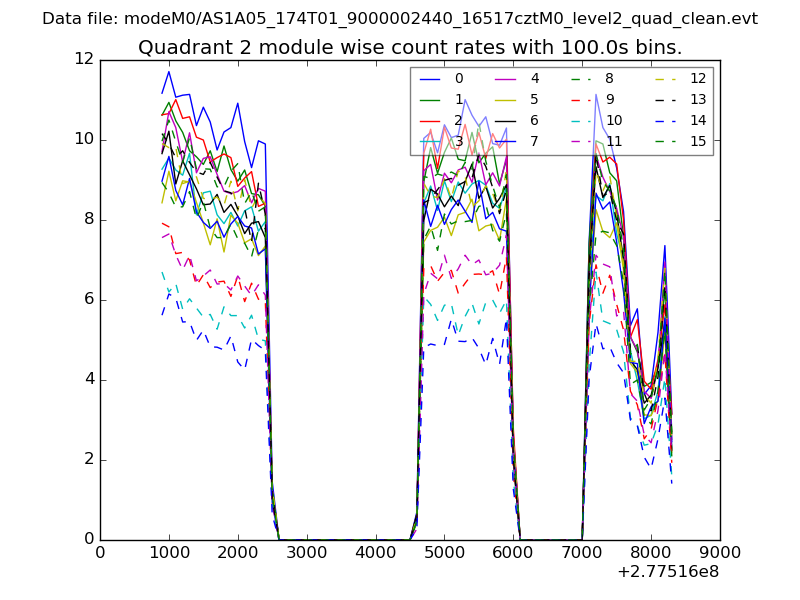
| Module-wise count rates for Quadrant B Data is divided into 100 sec bins |
 |
 |
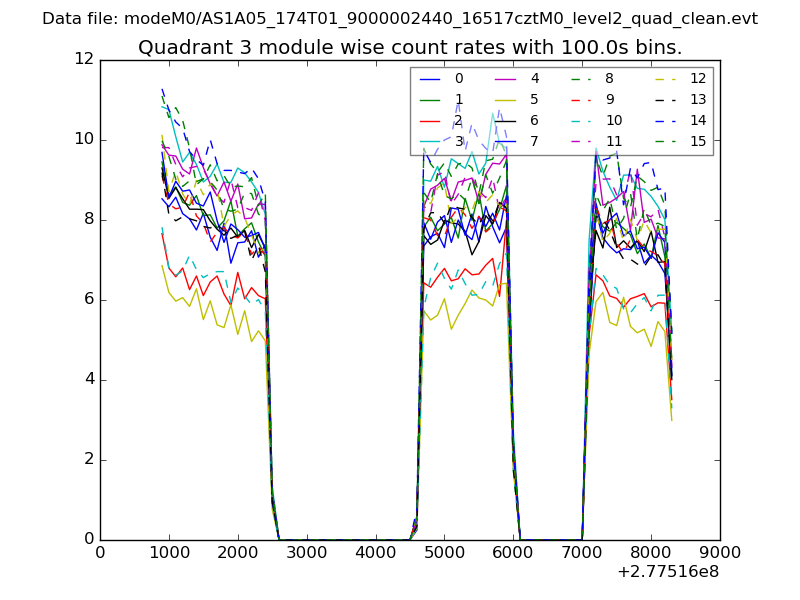
| Module-wise count rates for Quadrant C Data is divided into 100 sec bins |
 |
 |
| Module-wise count rates for Quadrant D Data is divided into 100 sec bins |
 |
 |
| Parameter | Plot |
|---|---|
| CZT HV Monitor | 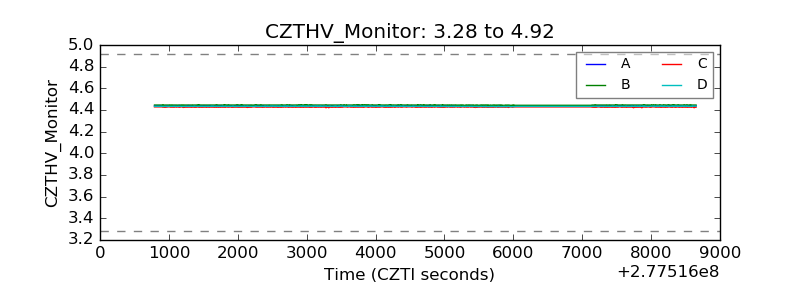 |
| D_VDD | 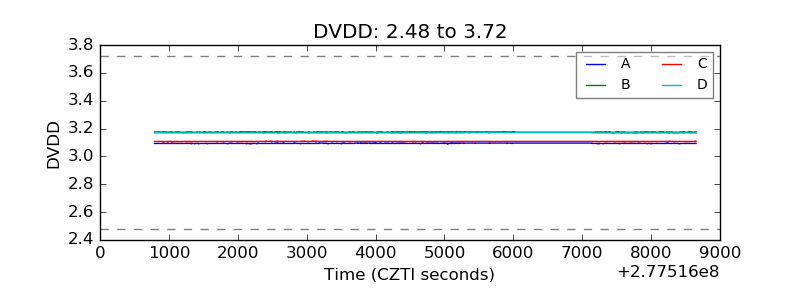 |
| Temperature 1 | 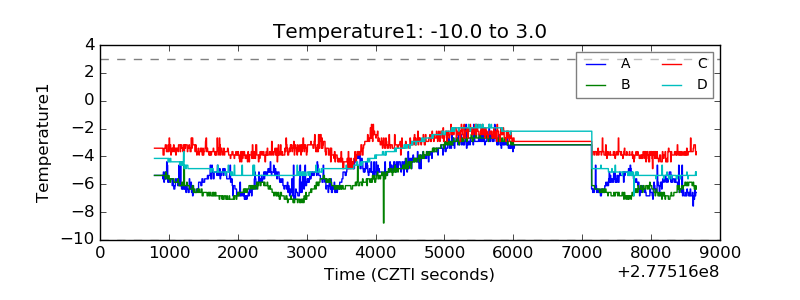 |
| Veto HV Monitor | 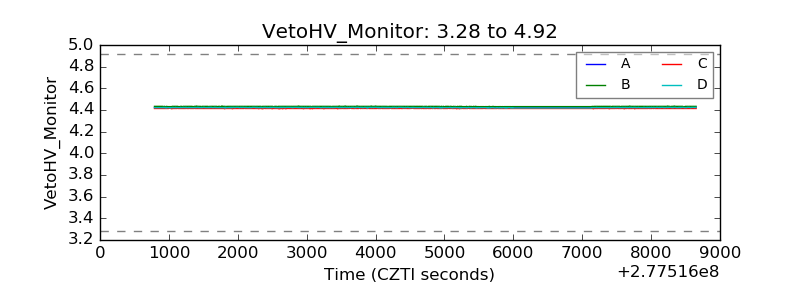 |
| Veto LLD | 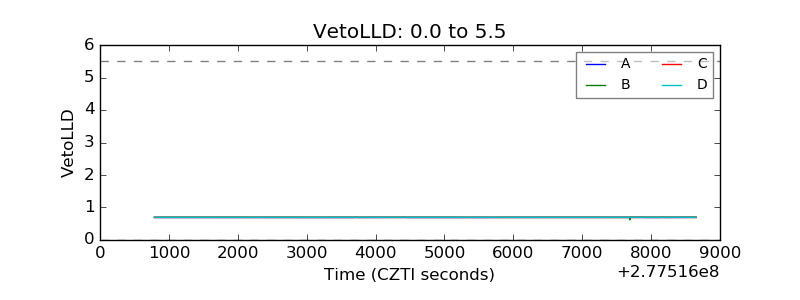 |
| Alpha Counter | 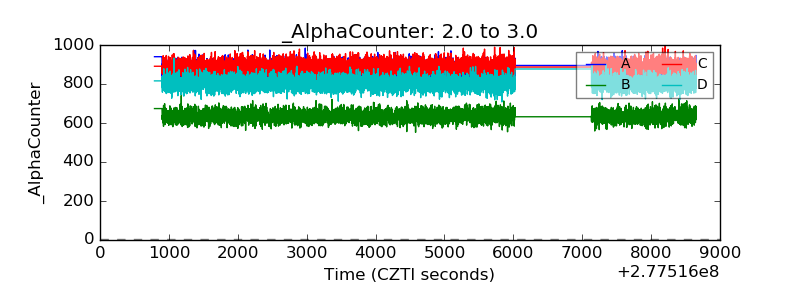 |
| _CPM_Rate | 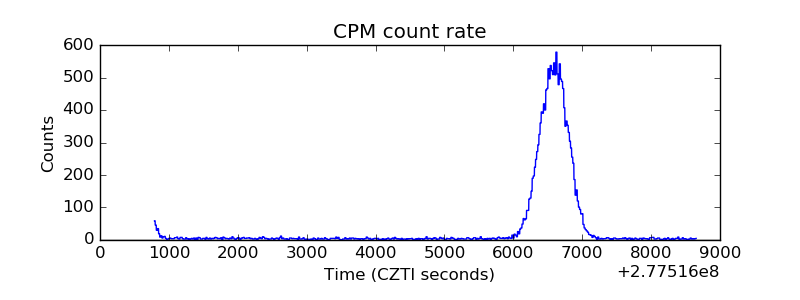 |
| CZT Counter | 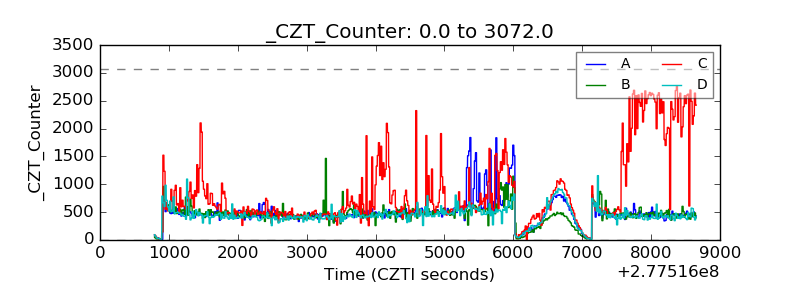 |
| +2.5 Volts monitor | 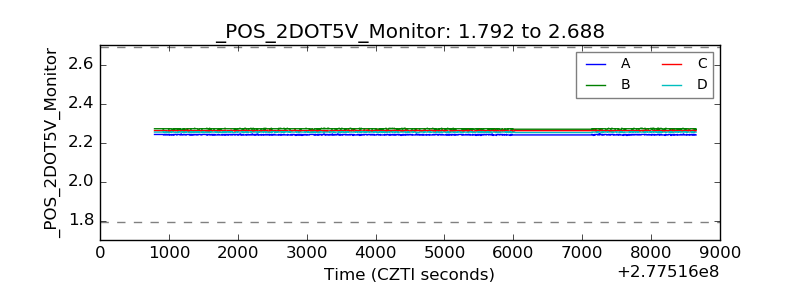 |
| +5 Volts monitor |  |
| _ROLL_ROT | 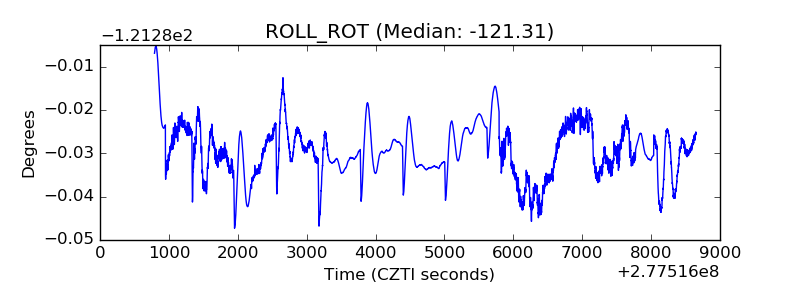 |
| _Roll_DEC | 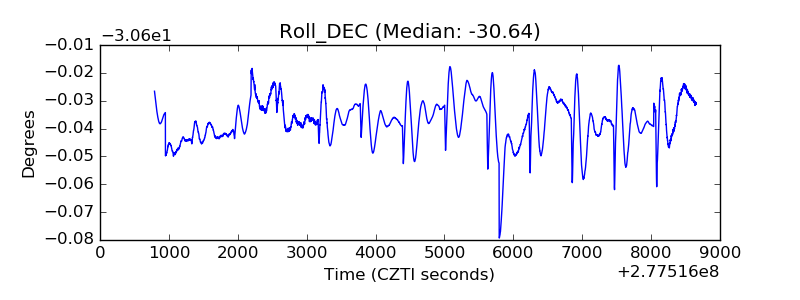 |
| _Roll_RA | 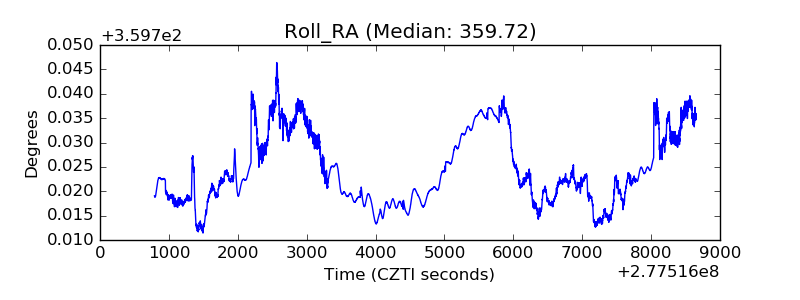 |
| Veto Counter | 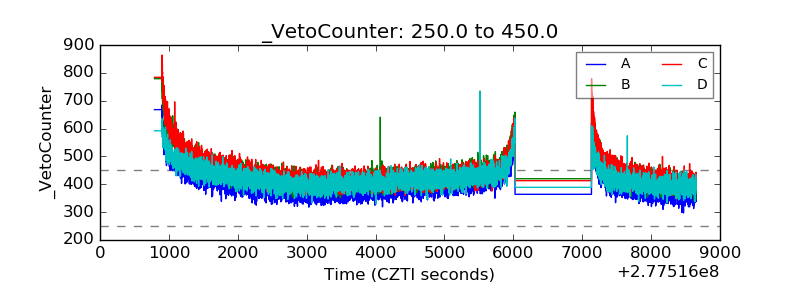 |