| Param | Original file | Final file |
|---|---|---|
| Filename | modeM0/AS1A05_174T01_9000002440_16518cztM0_level2.evt | modeM0/AS1A05_174T01_9000002440_16518cztM0_level2_quad_clean.evt |
| Size (bytes) | 738,489,600 | 81,411,840 |
| Size | 704.3 MB | 77.6 MB |
| Events in quadrant A | 3,260,163 | 534,483 |
| Events in quadrant B | 3,398,693 | 545,478 |
| Events in quadrant C | 11,897,844 | 391,861 |
| Events in quadrant D | 3,341,133 | 511,665 |
| Mode M9 | |||
|---|---|---|---|
| Quadrant | BADHDUFLAG | Total packets | Discarded packets |
| A | 0 | 16 | 0 |
| B | 0 | 16 | 0 |
| C | 0 | 16 | 0 |
| D | 0 | 17 | 0 |
| Mode SS | |||
|---|---|---|---|
| Quadrant | BADHDUFLAG | Total packets | Discarded packets |
| A | 0 | 140 | 0 |
| B | 0 | 140 | 0 |
| C | 0 | 140 | 0 |
| D | 0 | 140 | 0 |
| Mode M0 | |||
|---|---|---|---|
| Quadrant | BADHDUFLAG | Total packets | Discarded packets |
| A | 0 | 14120 | 3 |
| B | 0 | 14523 | 2 |
| C | 0 | 39971 | 2 |
| D | 0 | 14695 | 2 |
| Quadrant | Total seconds | Saturated seconds | Saturation percentage |
|---|---|---|---|
| A | 6899 | 41 | 0.594289% |
| B | 6899 | 75 | 1.087114% |
| C | 6899 | 3727 | 54.022322% |
| D | 6899 | 88 | 1.275547% |
Noise dominated data is calculated using 1-second bins in cleaned event files. If a bin has >2000 counts, and if more than 50% of those come from <1% of pixels, then it is considered to be noise-dominated and hence unusable.
| Quadrant | # 1 sec bins | Bins with >0 counts | Bins with >2000 counts | High rate bins dominated by noise | Noise dominated (total time) | Noise dominated (detector-on time) | Marked lightcurve |
|---|---|---|---|---|---|---|---|
| A | 7635 | 6900 | 0 | 0 | 0.00% | 0.00% | 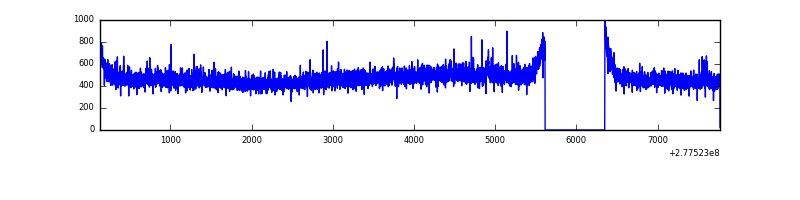 |
| B | 7635 | 6900 | 10 | 10 | 0.13% | 0.14% | 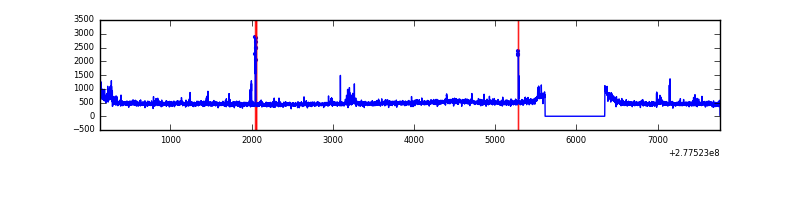 |
| C | 7635 | 6900 | 3175 | 3175 | 41.58% | 46.01% | 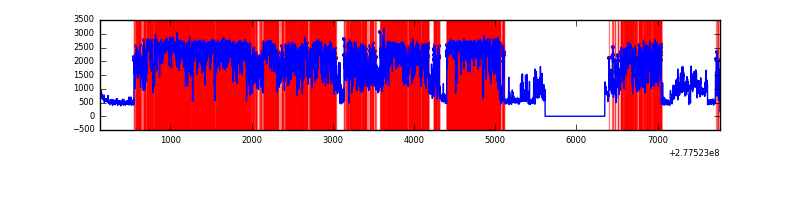 |
| D | 7635 | 6900 | 32 | 32 | 0.42% | 0.46% | 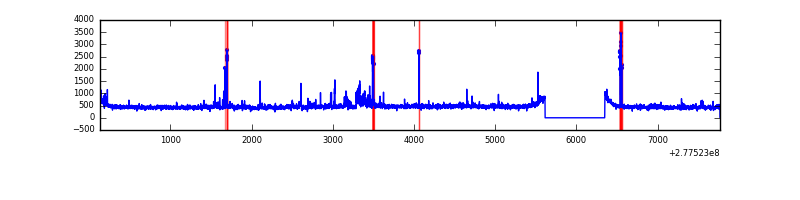 |
Top three noisy pixels from each quadrant. If the there are fewer than three noisy pixels in the level2.evt file, extra rows are filled as -1
| Pixel properties | Quadrant properties | ||||||
|---|---|---|---|---|---|---|---|
| Quadrant | DetID | PixID | Counts | Sigma | Mean | Median | Sigma |
| A | 15 | 223 | 58983 | 350.3 | 817 | 798 | 166.1 |
| A | 15 | 174 | 27102 | 158.36 | 817 | 798 | 166.1 |
| A | 15 | 239 | 26720 | 156.06 | 817 | 798 | 166.1 |
| B | 15 | 35 | 68548 | 423.52 | 824 | 802 | 160.0 |
| B | 0 | 189 | 28422 | 172.67 | 824 | 802 | 160.0 |
| B | 4 | 173 | 26960 | 163.53 | 824 | 802 | 160.0 |
| C | 3 | 233 | 9302944 | 62672.79 | 634 | 638 | 148.4 |
| C | 14 | 238 | 94721 | 633.87 | 634 | 638 | 148.4 |
| C | 7 | 247 | 28429 | 187.24 | 634 | 638 | 148.4 |
| D | 5 | 222 | 192448 | 977.05 | 794 | 768 | 196.2 |
| D | 1 | 52 | 91816 | 464.1 | 794 | 768 | 196.2 |
| D | 10 | 70 | 54704 | 274.93 | 794 | 768 | 196.2 |
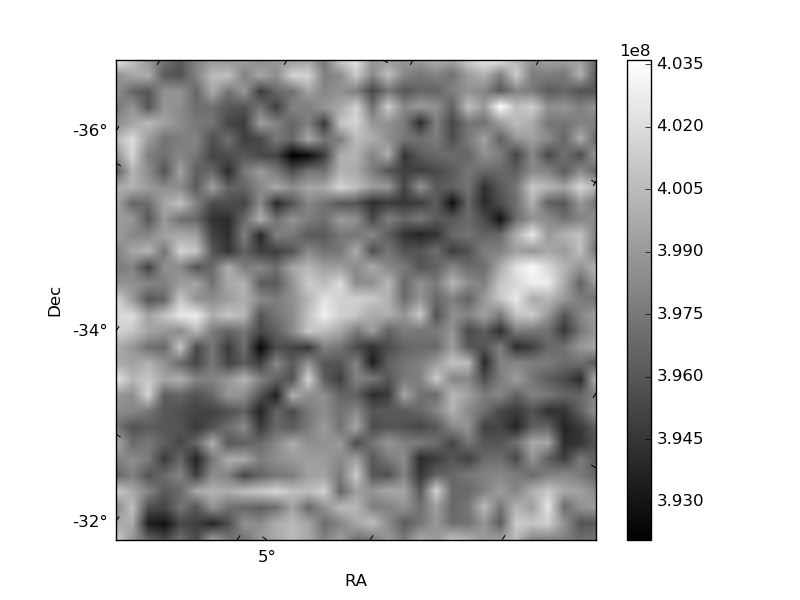
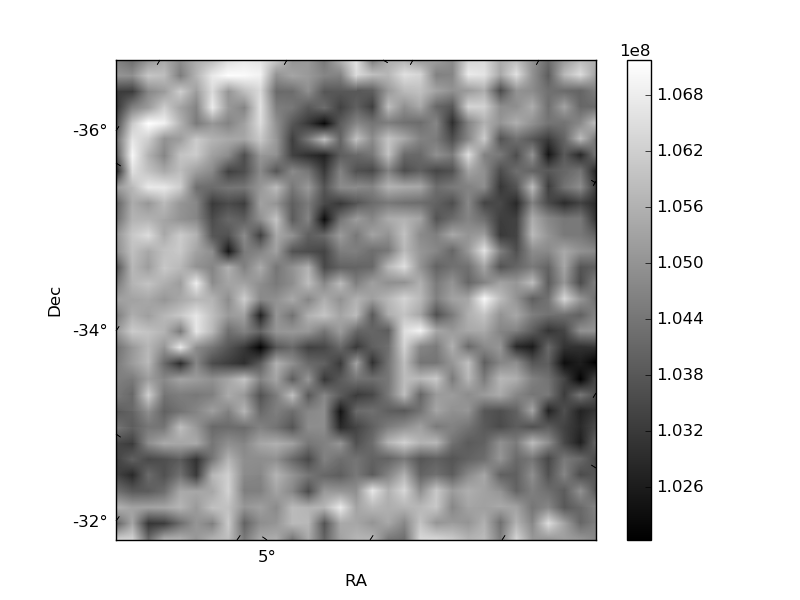
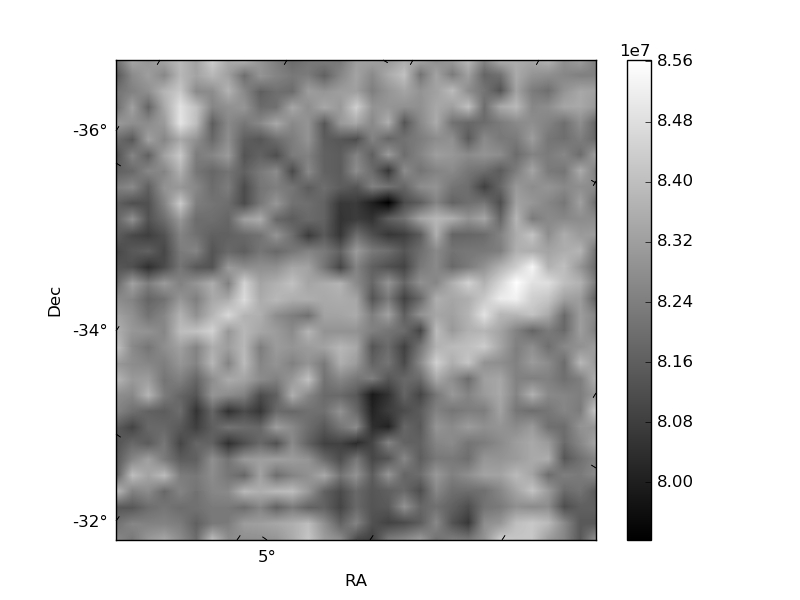
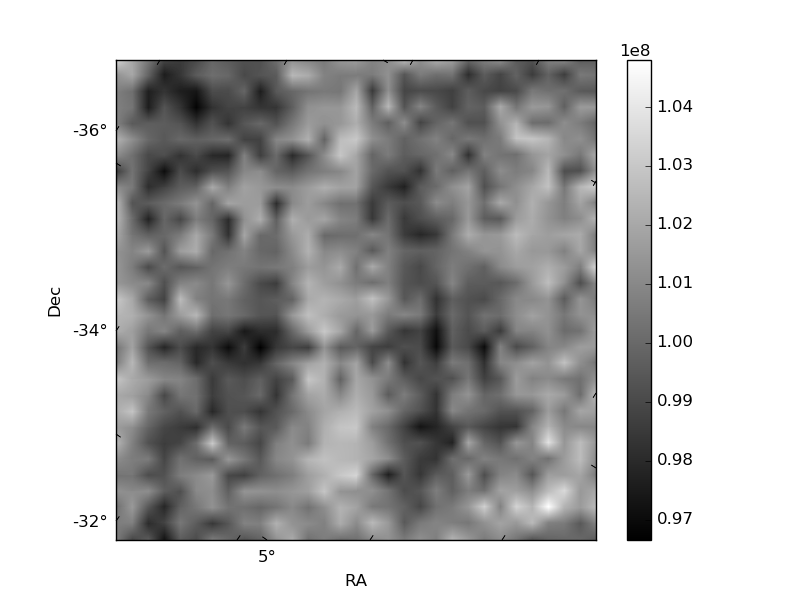
Histogram calculated using DETX and DETY for each event in the final _common_clean file
| Quadrant A | 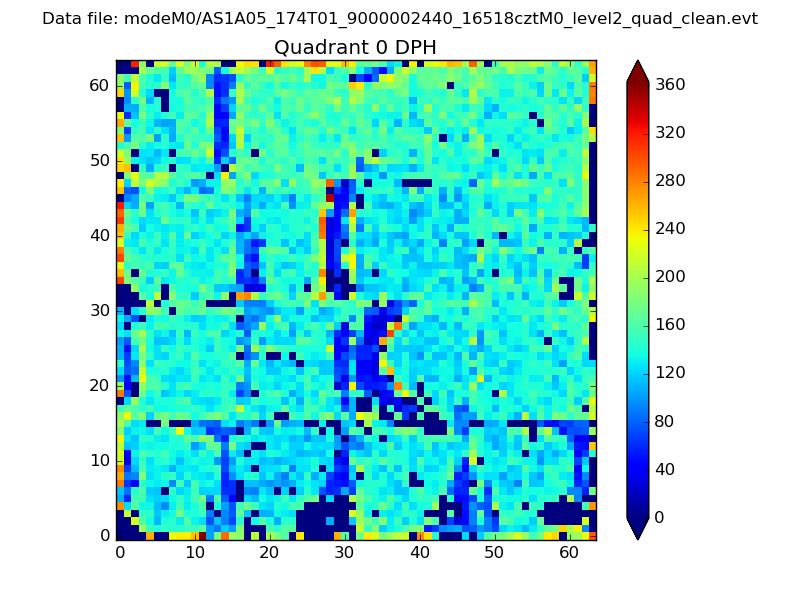 |
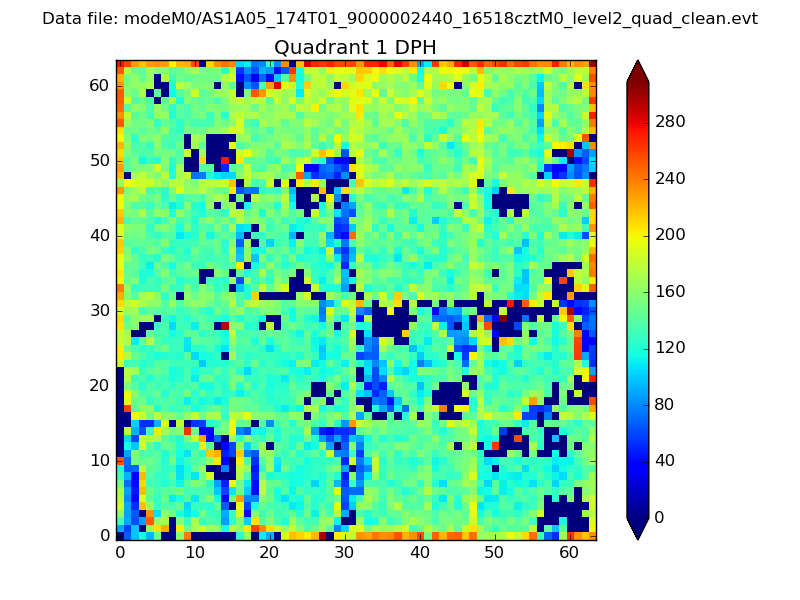 |
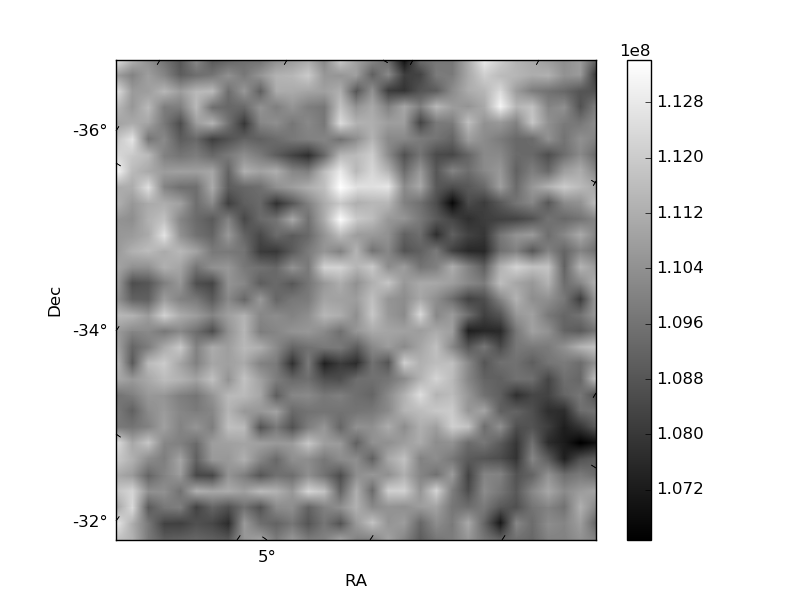
Quadrant B |
|---|---|---|---|
| Quadrant D | 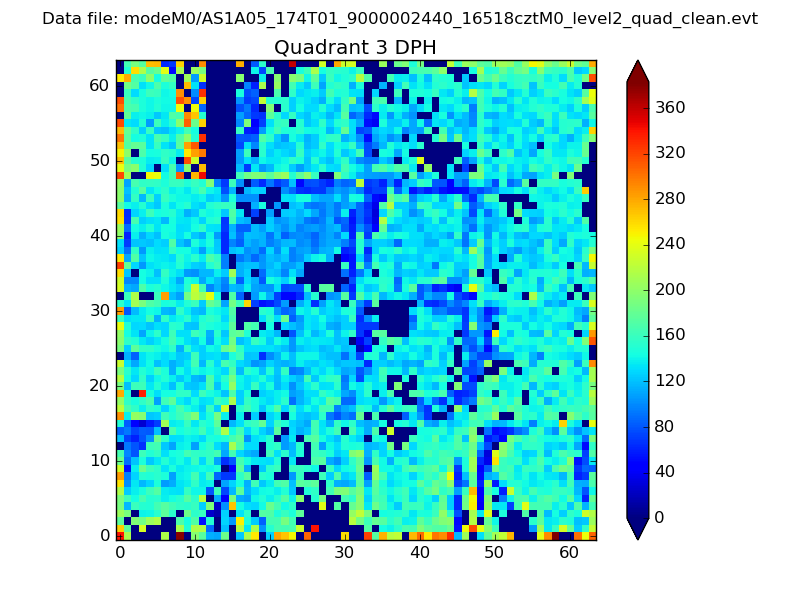 |
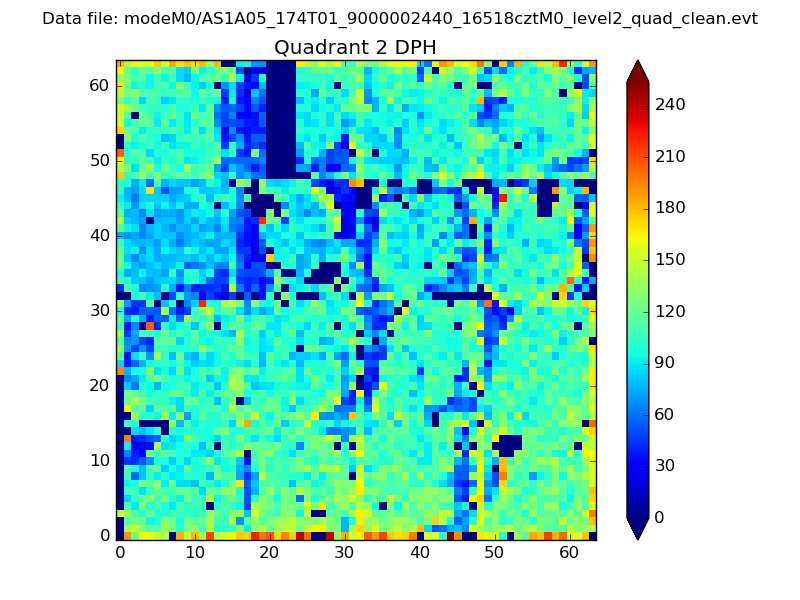 |
Quadrant C |
| Plot type | Count rate plots | Images |
|---|---|---|
| Comparison with Poisson distribution Blue bars denote a histogram of data divided into 1 sec bins. Red curve is a Poisson curve with rate = median count rate of data. |
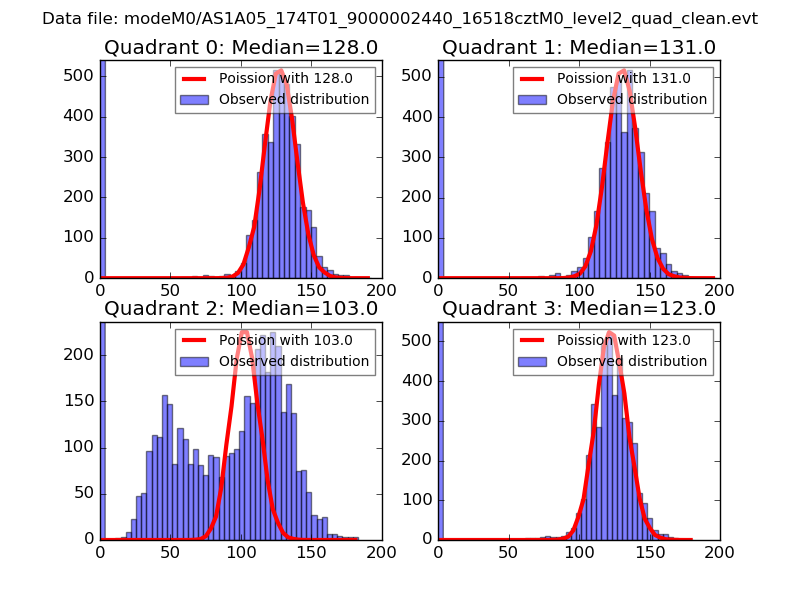 |
 |
| Quadrant-wise count rates Data is divided into 100 sec bins |
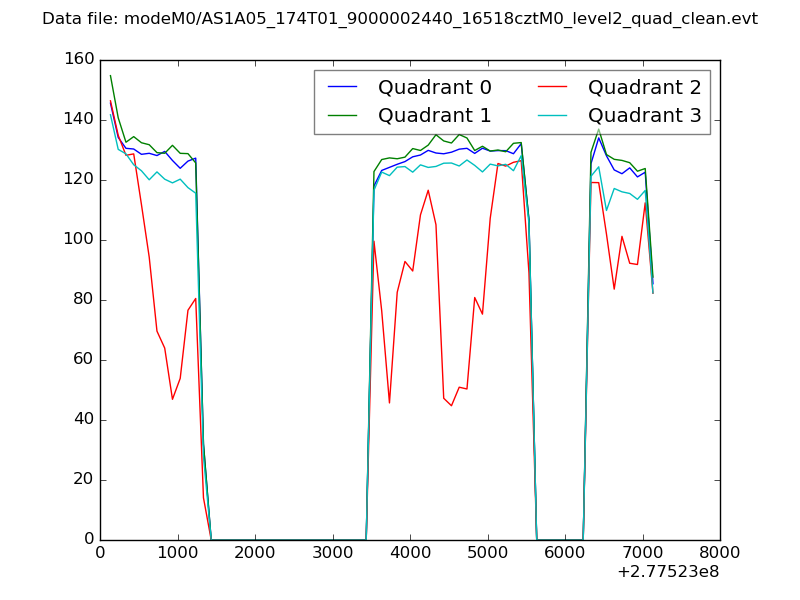 |
|
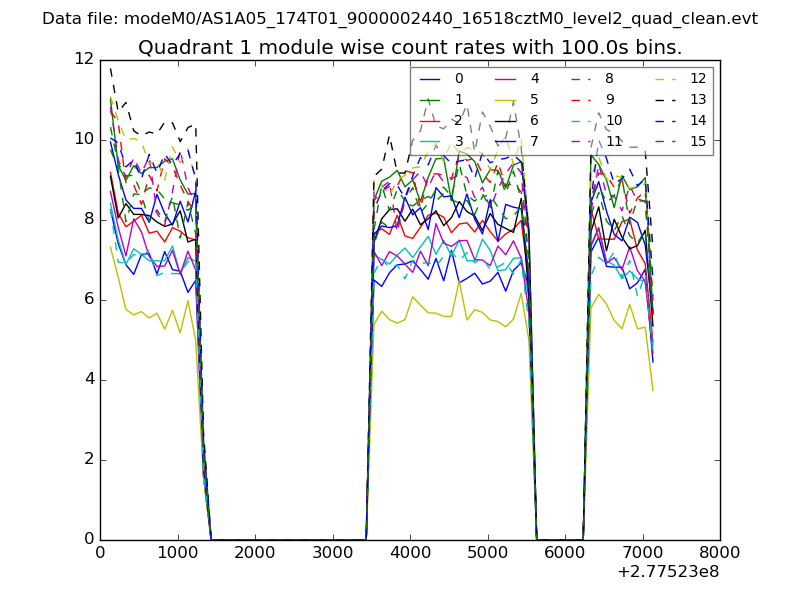
| Module-wise count rates for Quadrant A Data is divided into 100 sec bins |
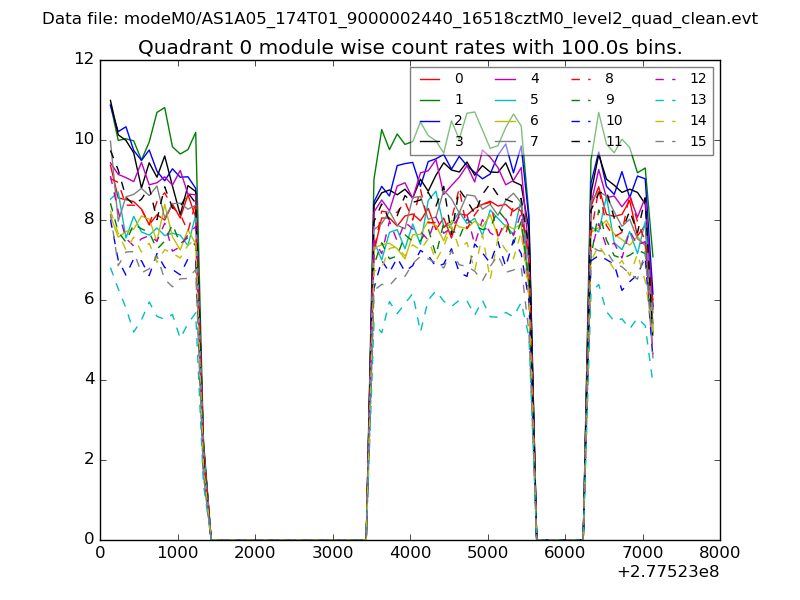 |
 |
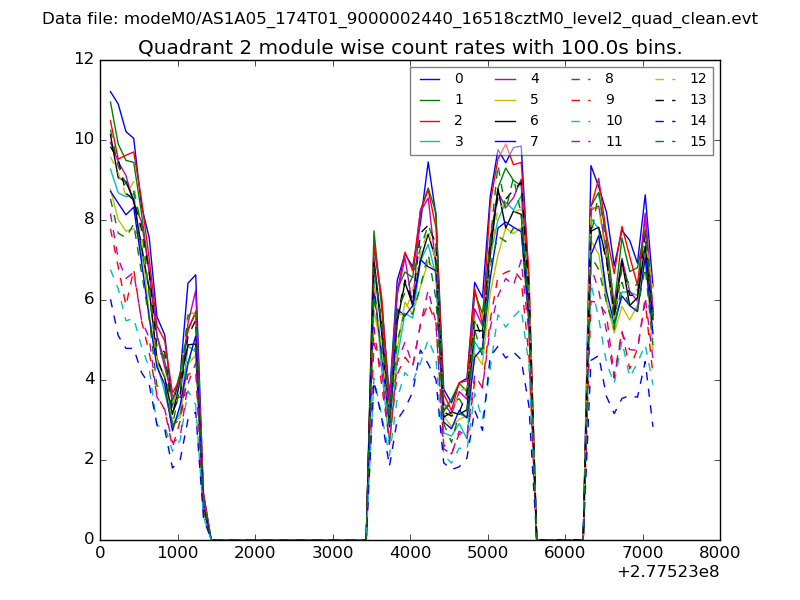
| Module-wise count rates for Quadrant B Data is divided into 100 sec bins |
 |
 |
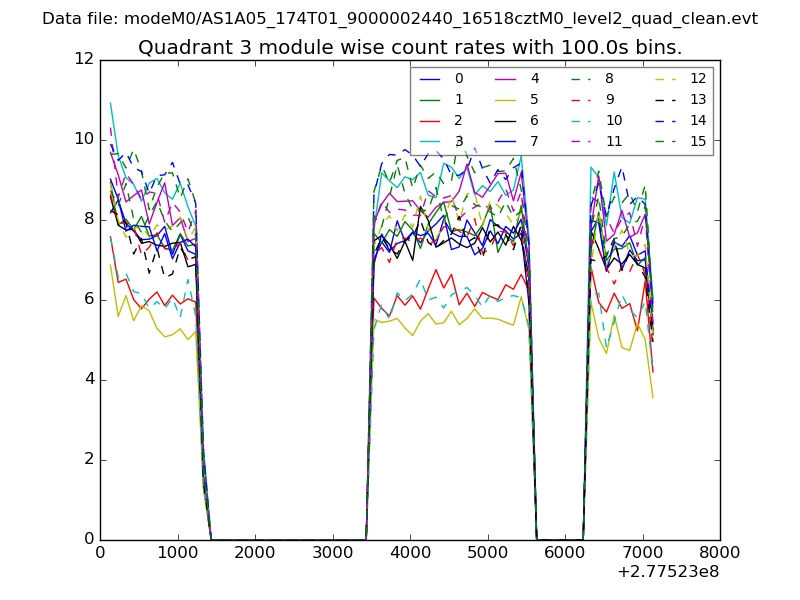
| Module-wise count rates for Quadrant C Data is divided into 100 sec bins |
 |
 |
| Module-wise count rates for Quadrant D Data is divided into 100 sec bins |
 |
 |
| Parameter | Plot |
|---|---|
| CZT HV Monitor | 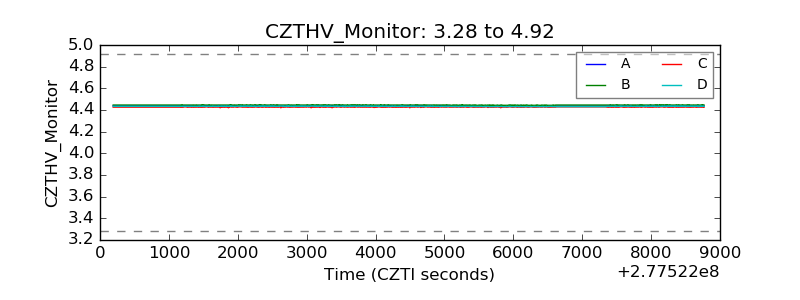 |
| D_VDD |  |
| Temperature 1 | 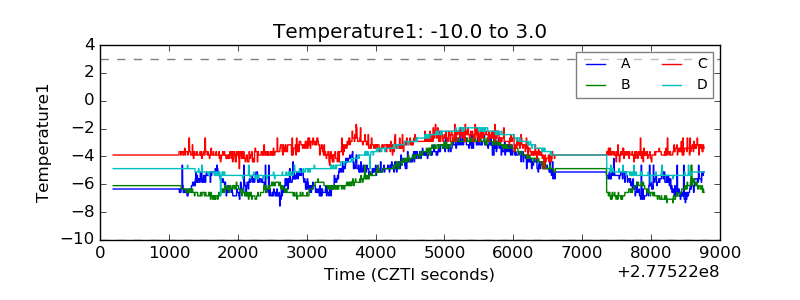 |
| Veto HV Monitor |  |
| Veto LLD | 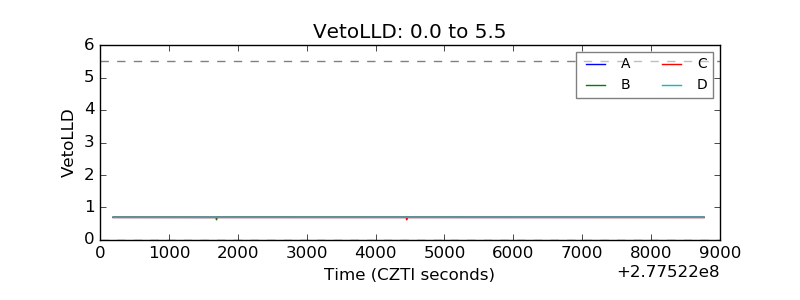 |
| Alpha Counter | 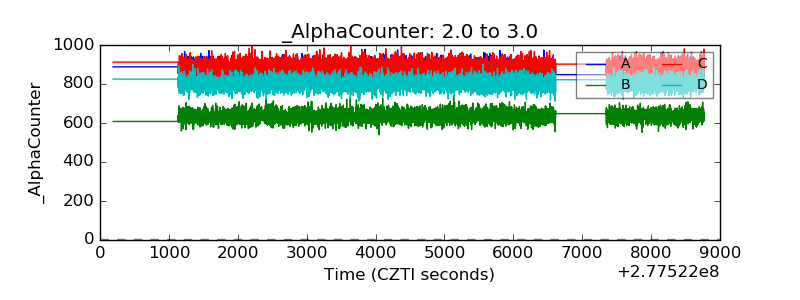 |
| _CPM_Rate | 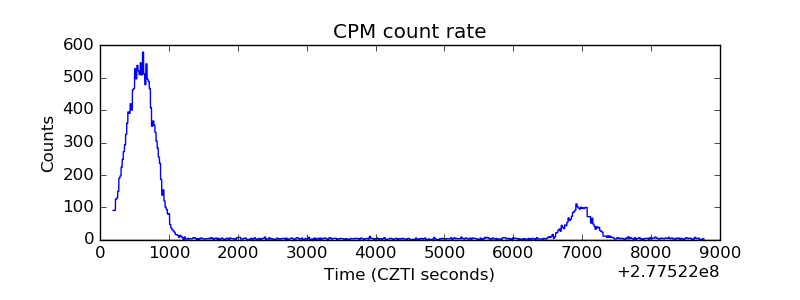 |
| CZT Counter | 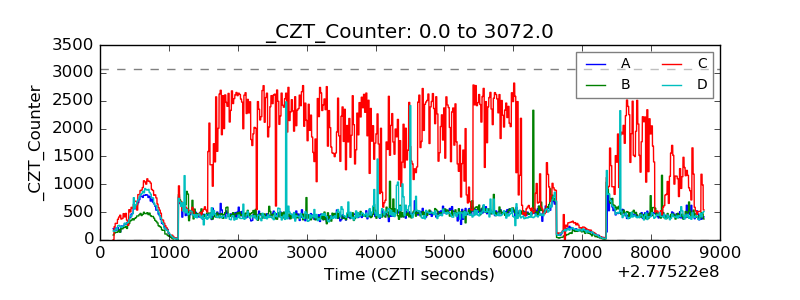 |
| +2.5 Volts monitor |  |
| +5 Volts monitor |  |
| _ROLL_ROT | 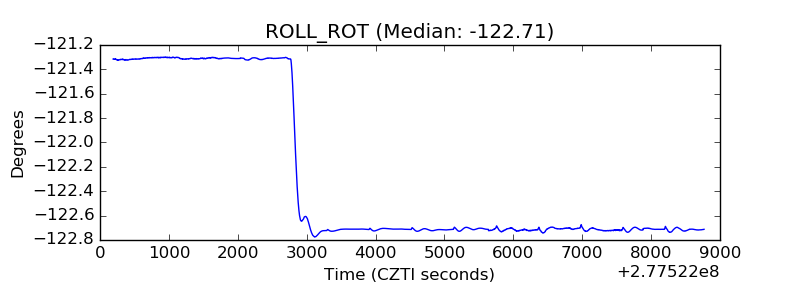 |
| _Roll_DEC | 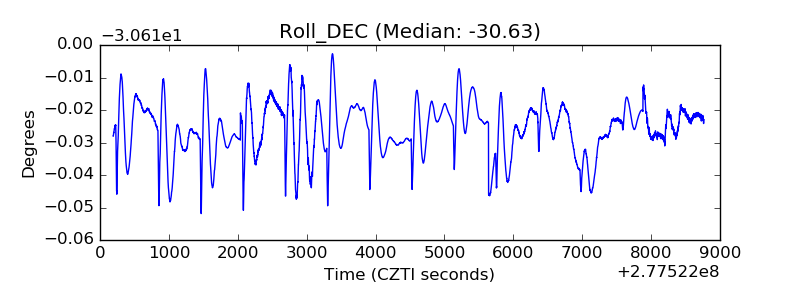 |
| _Roll_RA |  |
| Veto Counter | 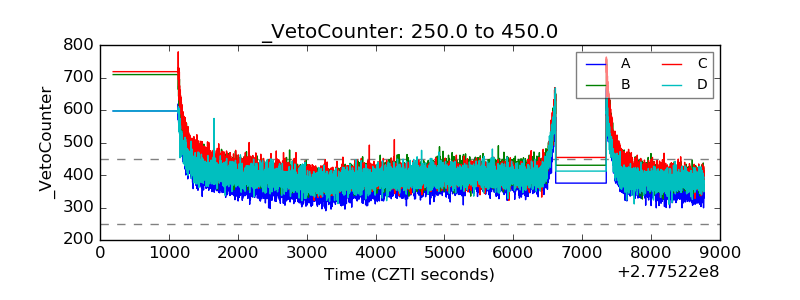 |