| Param | Original file | Final file |
|---|---|---|
| Filename | modeM0/AS1A05_174T01_9000002440_16519cztM0_level2.evt | modeM0/AS1A05_174T01_9000002440_16519cztM0_level2_quad_clean.evt |
| Size (bytes) | 616,838,400 | 85,510,080 |
| Size | 588.3 MB | 81.5 MB |
| Events in quadrant A | 3,957,413 | 522,684 |
| Events in quadrant B | 3,709,269 | 540,410 |
| Events in quadrant C | 6,758,057 | 497,857 |
| Events in quadrant D | 3,750,651 | 509,088 |
| Mode M9 | |||
|---|---|---|---|
| Quadrant | BADHDUFLAG | Total packets | Discarded packets |
| A | 0 | 12 | 0 |
| B | 0 | 12 | 0 |
| C | 0 | 12 | 0 |
| D | 0 | 12 | 0 |
| Mode SS | |||
|---|---|---|---|
| Quadrant | BADHDUFLAG | Total packets | Discarded packets |
| A | 0 | 156 | 0 |
| B | 0 | 156 | 0 |
| C | 0 | 156 | 0 |
| D | 0 | 156 | 0 |
| Mode M0 | |||
|---|---|---|---|
| Quadrant | BADHDUFLAG | Total packets | Discarded packets |
| A | 0 | 16814 | 2 |
| B | 0 | 15937 | 1 |
| C | 0 | 24978 | 1 |
| D | 0 | 16482 | 1 |
| Quadrant | Total seconds | Saturated seconds | Saturation percentage |
|---|---|---|---|
| A | 7458 | 238 | 3.191204% |
| B | 7458 | 147 | 1.971038% |
| C | 7458 | 1145 | 15.352641% |
| D | 7458 | 155 | 2.078305% |
Noise dominated data is calculated using 1-second bins in cleaned event files. If a bin has >2000 counts, and if more than 50% of those come from <1% of pixels, then it is considered to be noise-dominated and hence unusable.
| Quadrant | # 1 sec bins | Bins with >0 counts | Bins with >2000 counts | High rate bins dominated by noise | Noise dominated (total time) | Noise dominated (detector-on time) | Marked lightcurve |
|---|---|---|---|---|---|---|---|
| A | 8569 | 7459 | 121 | 121 | 1.41% | 1.62% | 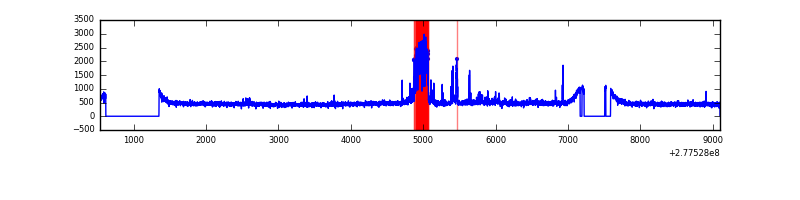 |
| B | 8569 | 7459 | 3 | 3 | 0.04% | 0.04% | 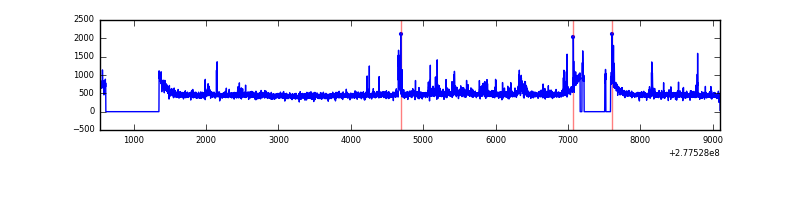 |
| C | 8569 | 7459 | 753 | 753 | 8.79% | 10.10% | 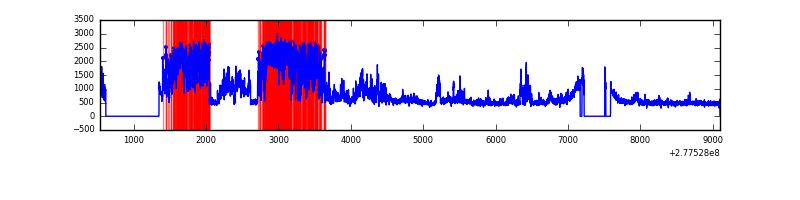 |
| D | 8569 | 7459 | 30 | 30 | 0.35% | 0.40% | 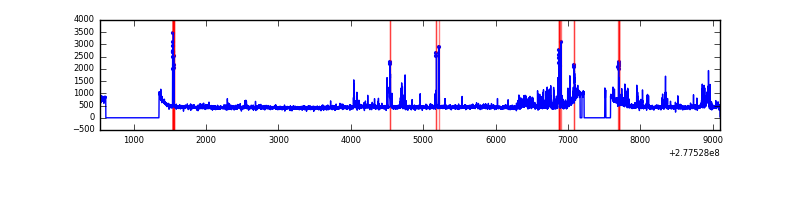 |
Top three noisy pixels from each quadrant. If the there are fewer than three noisy pixels in the level2.evt file, extra rows are filled as -1
| Pixel properties | Quadrant properties | ||||||
|---|---|---|---|---|---|---|---|
| Quadrant | DetID | PixID | Counts | Sigma | Mean | Median | Sigma |
| A | 15 | 174 | 500168 | 2780.12 | 887 | 868 | 179.6 |
| A | 15 | 223 | 29092 | 157.15 | 887 | 868 | 179.6 |
| A | 15 | 239 | 15848 | 83.41 | 887 | 868 | 179.6 |
| B | 15 | 35 | 53785 | 302.9 | 898 | 875 | 174.7 |
| B | 0 | 189 | 45899 | 257.75 | 898 | 875 | 174.7 |
| B | 10 | 16 | 41189 | 230.79 | 898 | 875 | 174.7 |
| C | 3 | 233 | 3361476 | 17297.55 | 825 | 831 | 194.3 |
| C | 14 | 238 | 123952 | 633.72 | 825 | 831 | 194.3 |
| C | 7 | 247 | 50443 | 255.36 | 825 | 831 | 194.3 |
| D | 12 | 110 | 173714 | 805.24 | 873 | 844 | 214.7 |
| D | 5 | 222 | 121736 | 563.12 | 873 | 844 | 214.7 |
| D | 10 | 70 | 120660 | 558.11 | 873 | 844 | 214.7 |
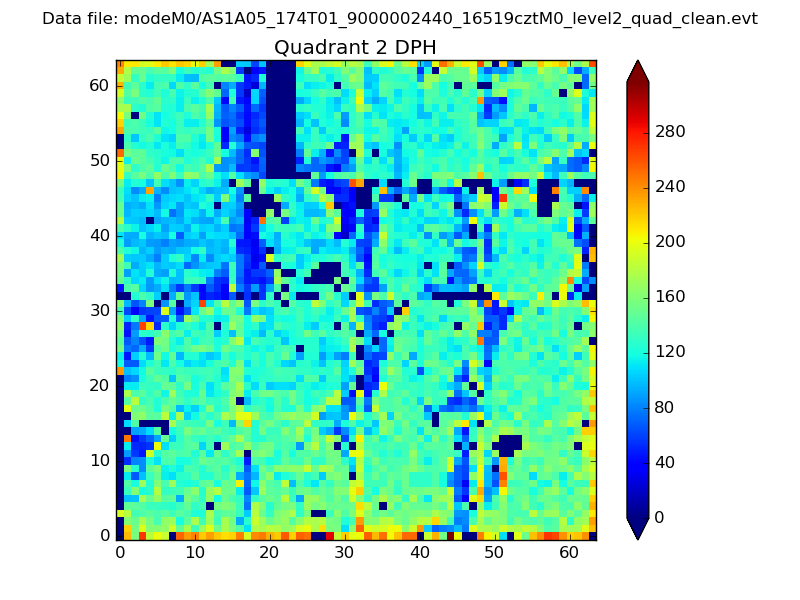
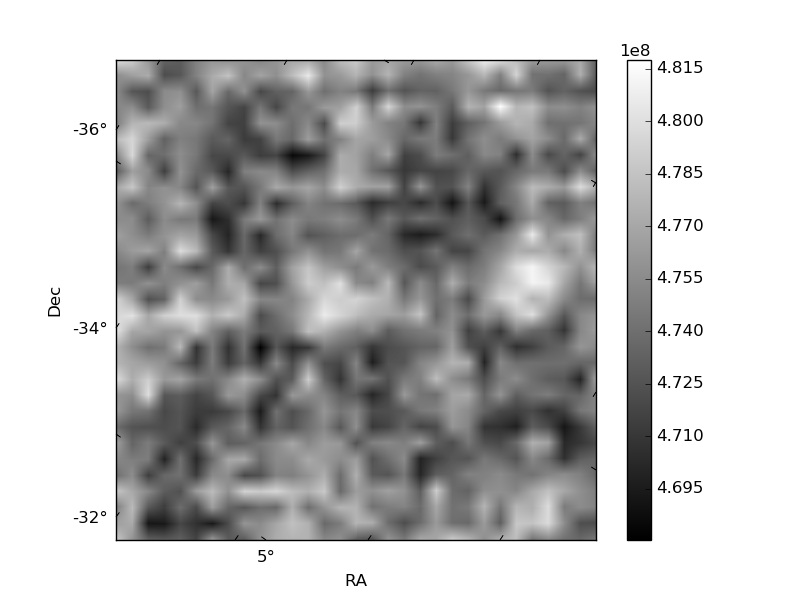
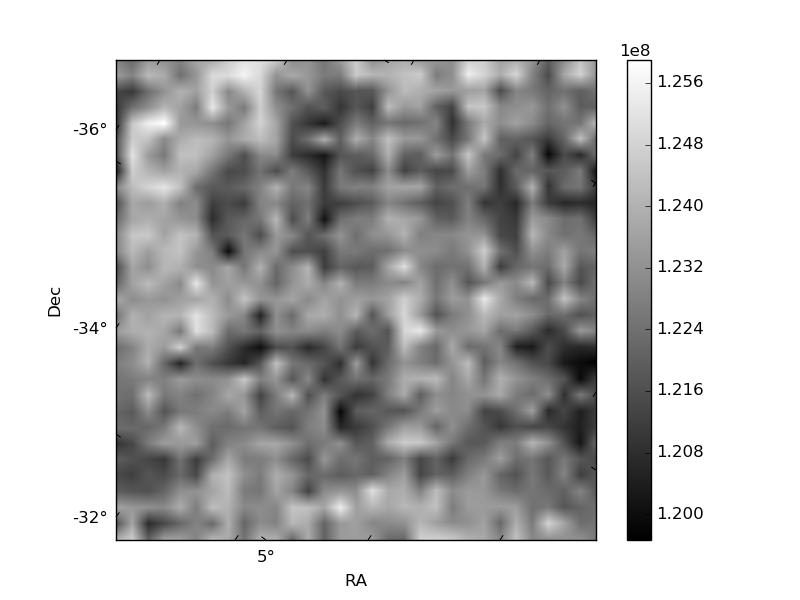
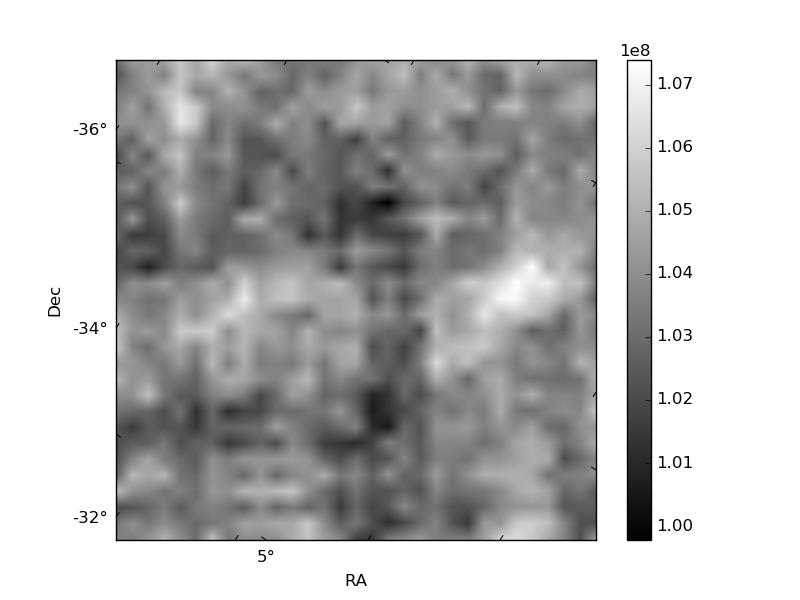
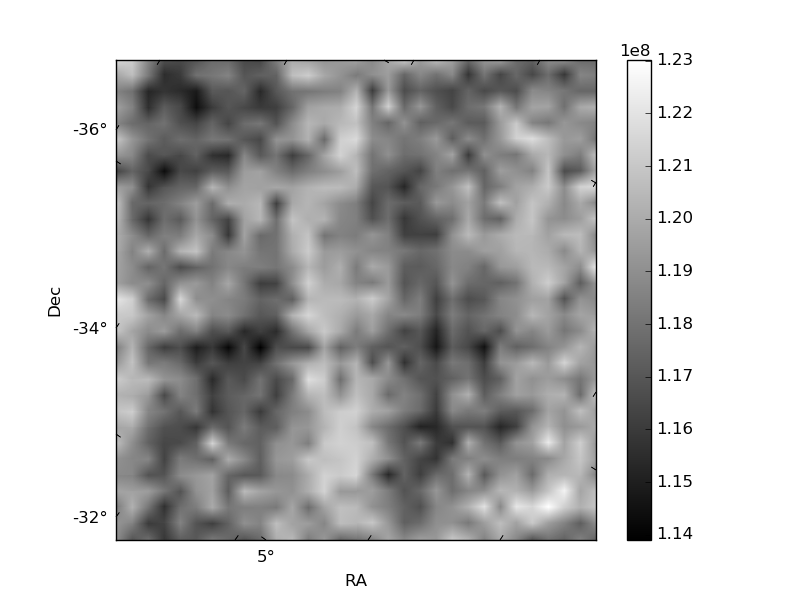
Histogram calculated using DETX and DETY for each event in the final _common_clean file
| Quadrant A | 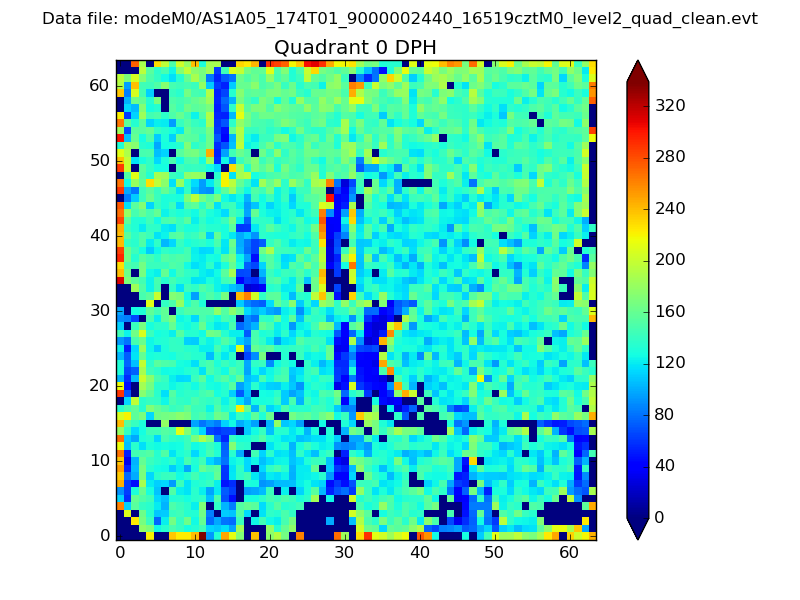 |
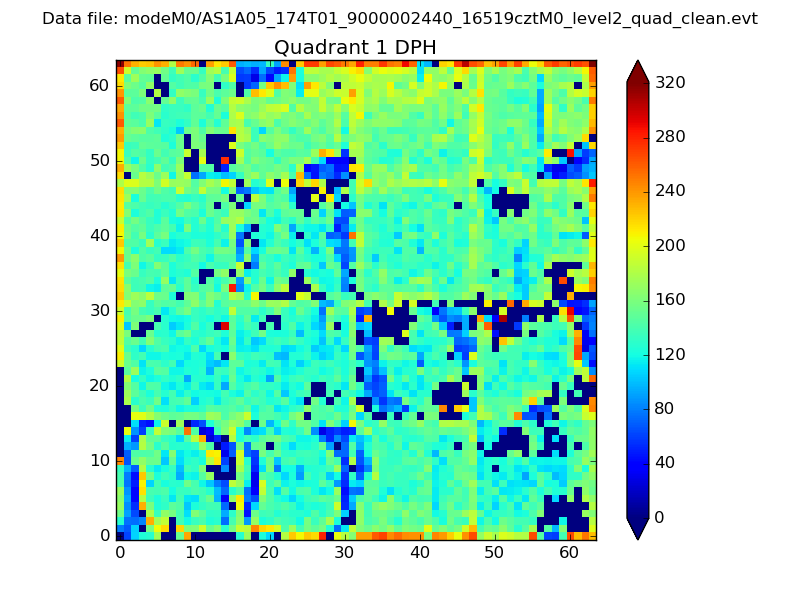 |
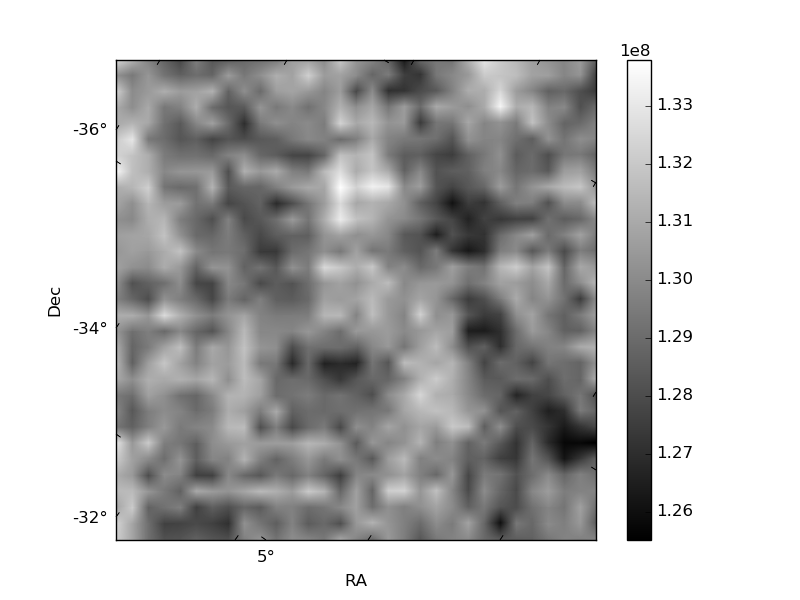
Quadrant B |
|---|---|---|---|
| Quadrant D | 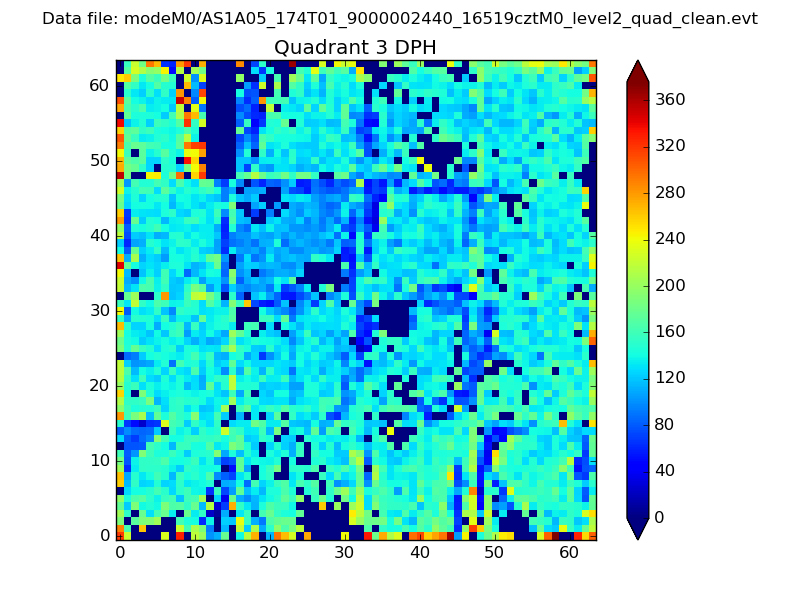 |
 |
Quadrant C |
| Plot type | Count rate plots | Images |
|---|---|---|
| Comparison with Poisson distribution Blue bars denote a histogram of data divided into 1 sec bins. Red curve is a Poisson curve with rate = median count rate of data. |
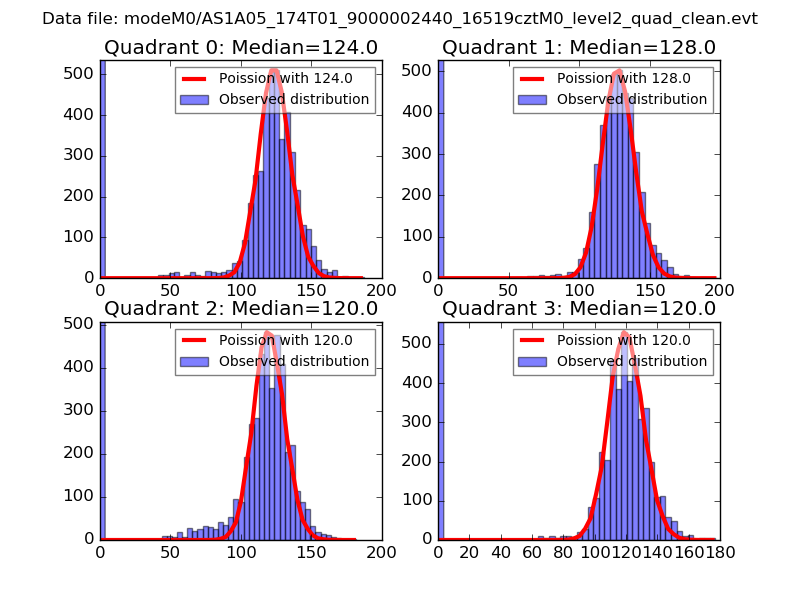 |
 |
| Quadrant-wise count rates Data is divided into 100 sec bins |
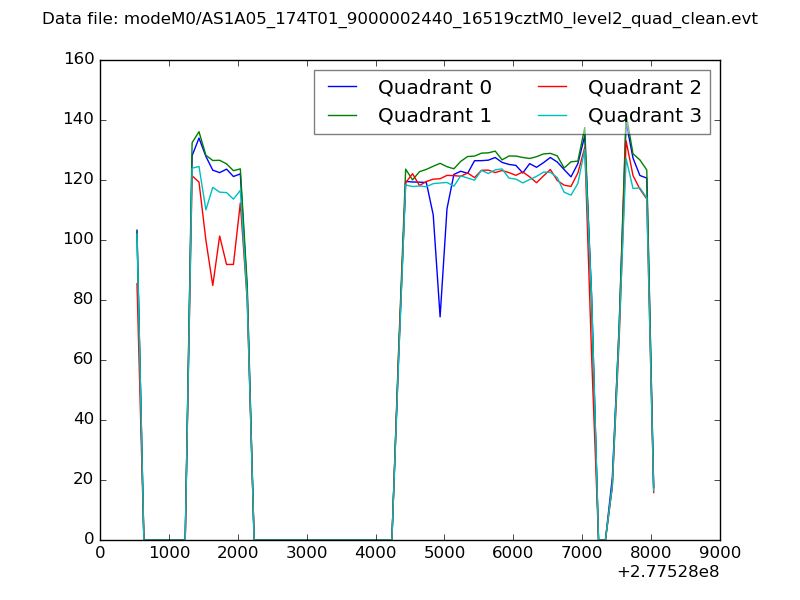 |
|
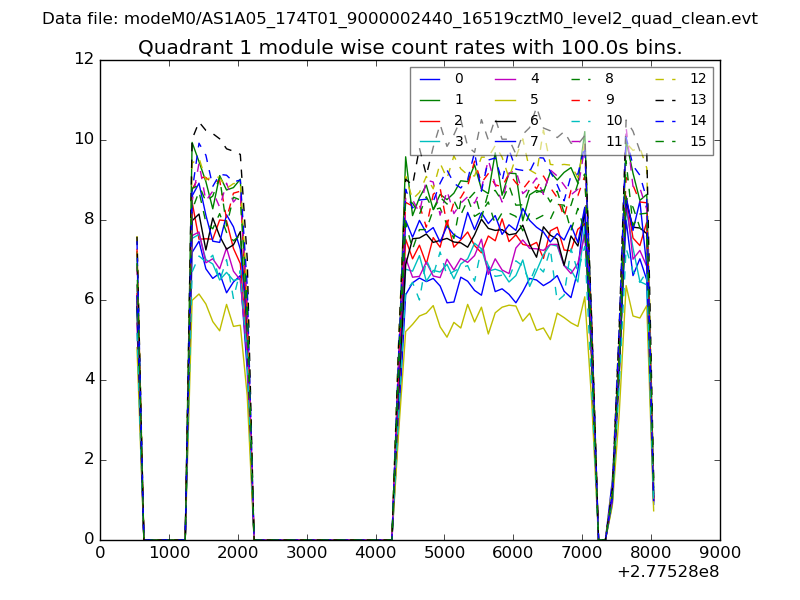
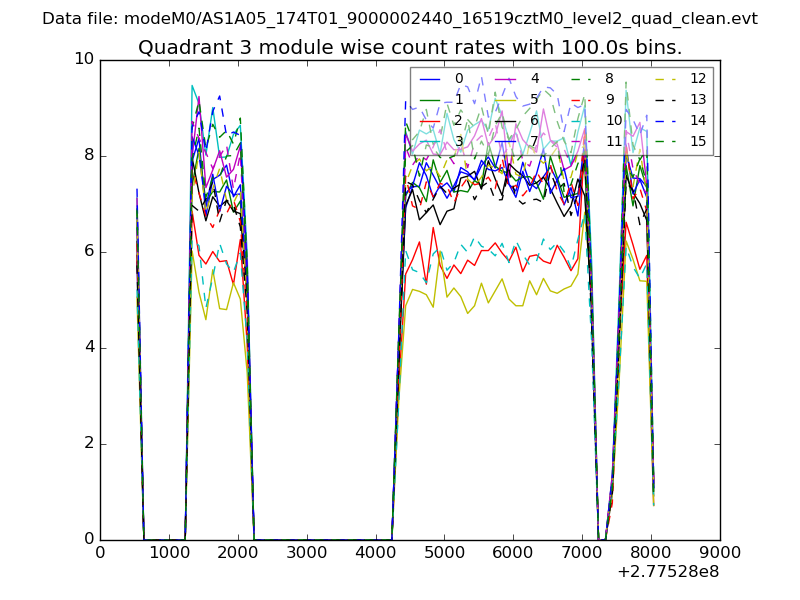
| Module-wise count rates for Quadrant A Data is divided into 100 sec bins |
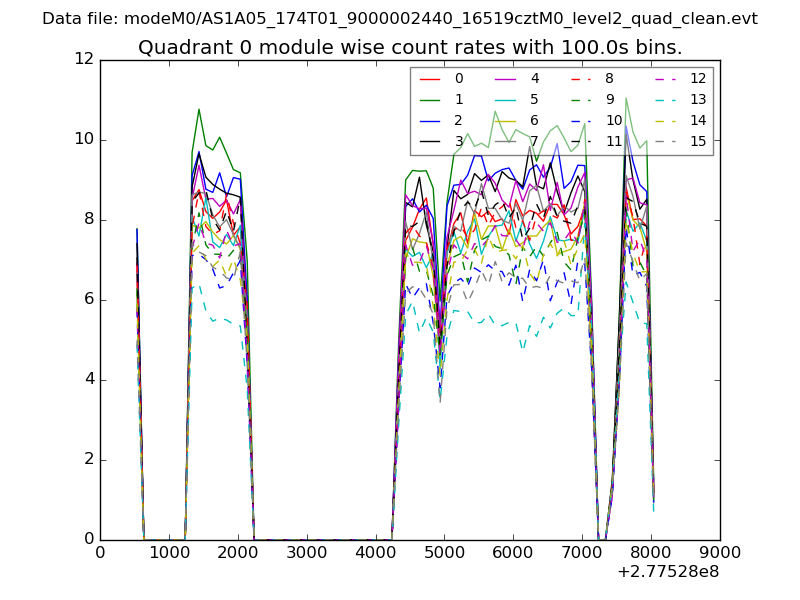 |
 |
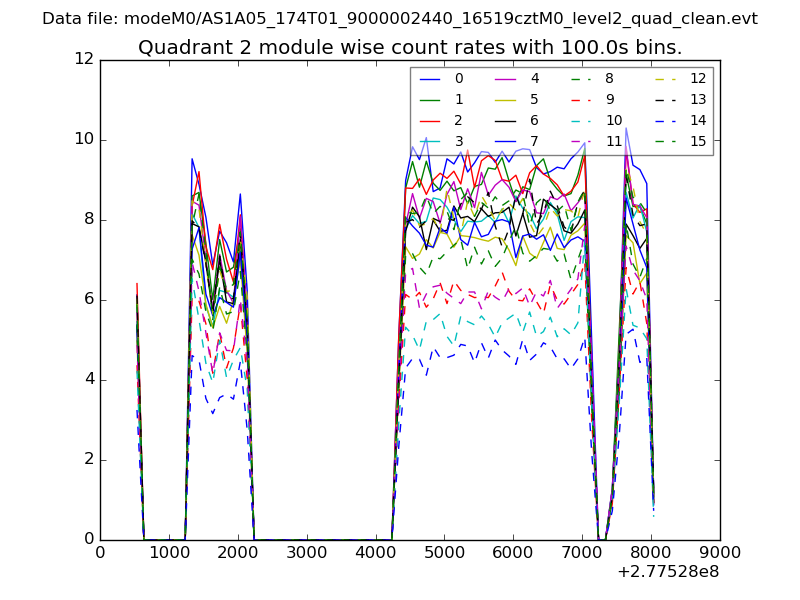
| Module-wise count rates for Quadrant B Data is divided into 100 sec bins |
 |
 |
| Module-wise count rates for Quadrant C Data is divided into 100 sec bins |
 |
 |
| Module-wise count rates for Quadrant D Data is divided into 100 sec bins |
 |
 |
| Parameter | Plot |
|---|---|
| CZT HV Monitor | 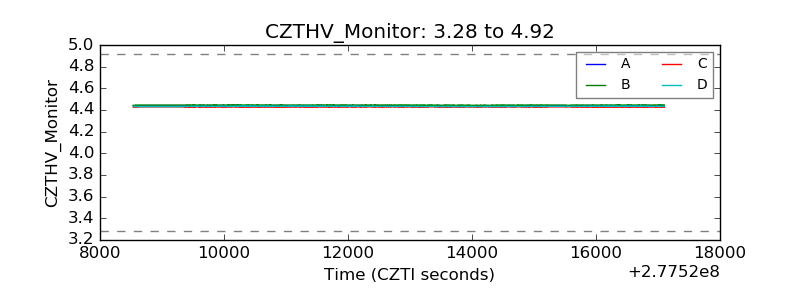 |
| D_VDD | 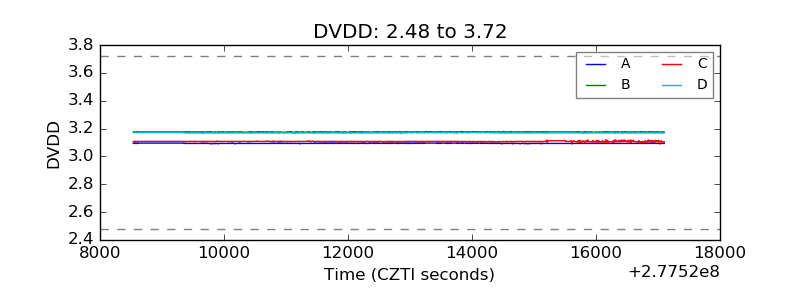 |
| Temperature 1 | 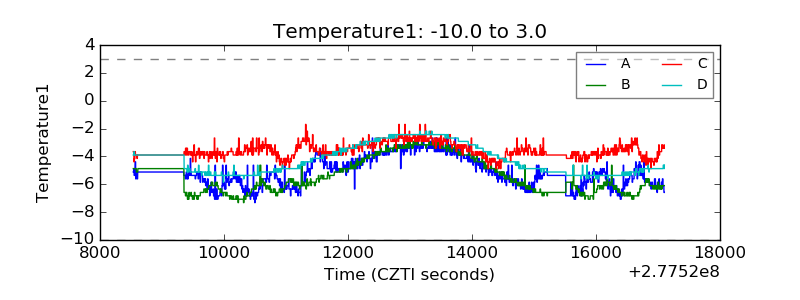 |
| Veto HV Monitor | 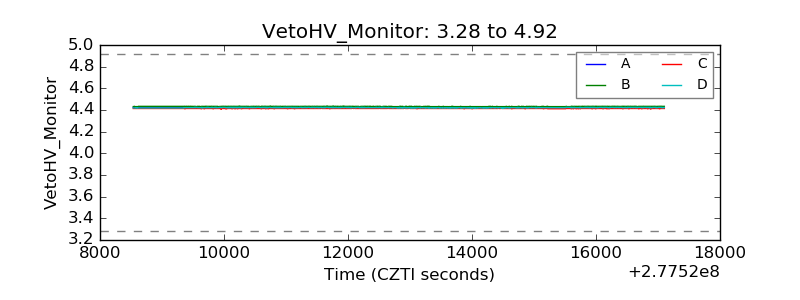 |
| Veto LLD | 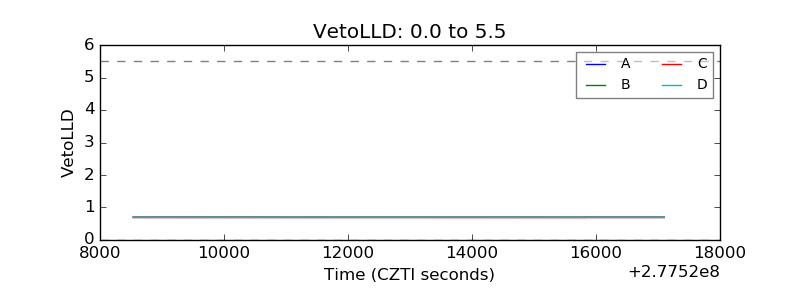 |
| Alpha Counter | 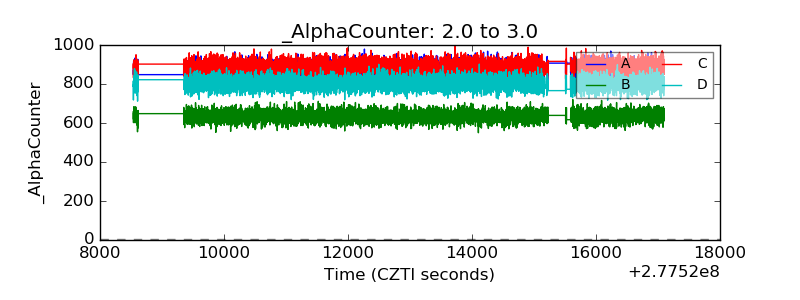 |
| _CPM_Rate | 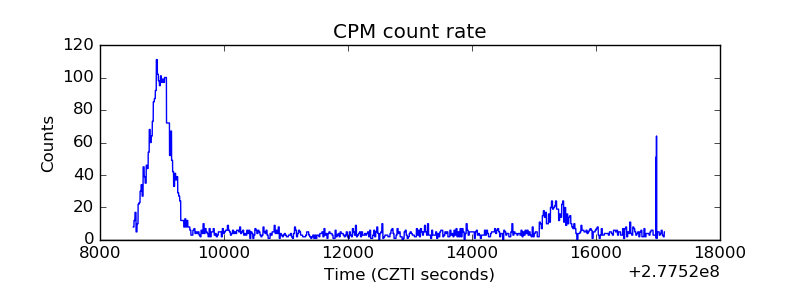 |
| CZT Counter | 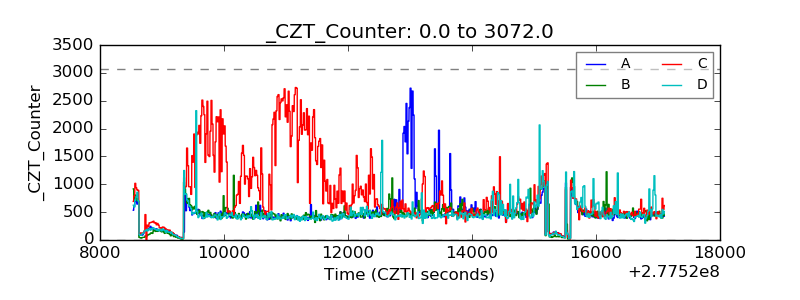 |
| +2.5 Volts monitor |  |
| +5 Volts monitor |  |
| _ROLL_ROT | 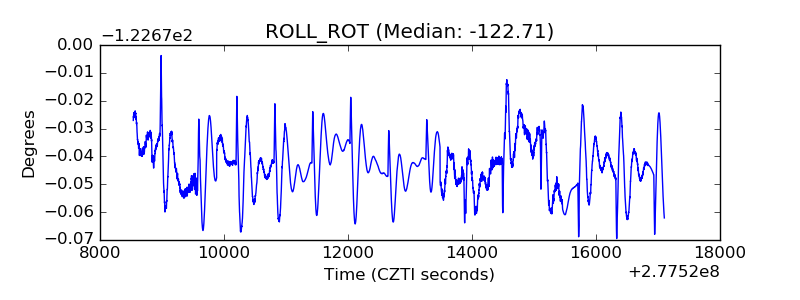 |
| _Roll_DEC | 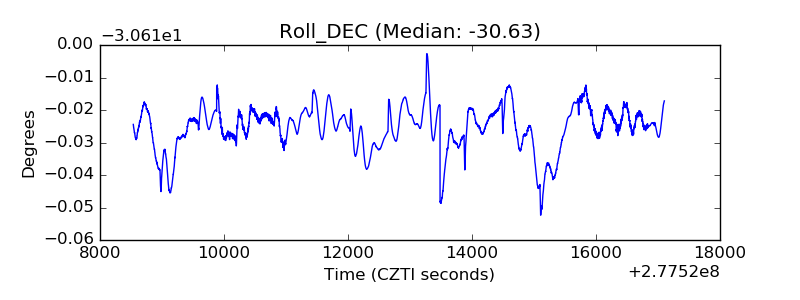 |
| _Roll_RA | 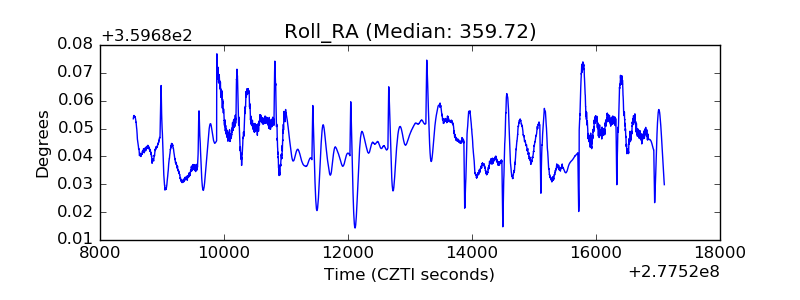 |
| Veto Counter | 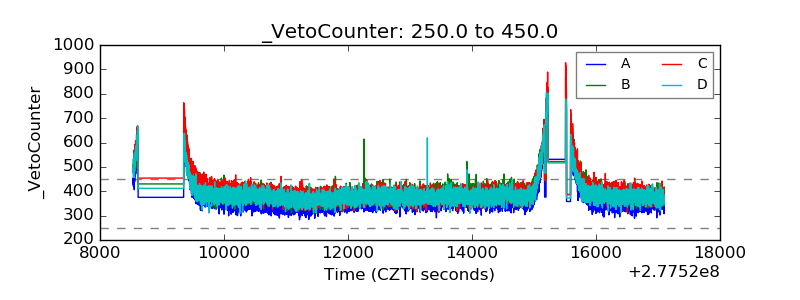 |