| Param | Original file | Final file |
|---|---|---|
| Filename | modeM0/AS1A05_174T01_9000002440_16523cztM0_level2.evt | modeM0/AS1A05_174T01_9000002440_16523cztM0_level2_quad_clean.evt |
| Size (bytes) | 1,078,058,880 | 152,055,360 |
| Size | 1.0 GB | 145.0 MB |
| Events in quadrant A | 6,664,726 | 952,236 |
| Events in quadrant B | 6,291,480 | 972,101 |
| Events in quadrant C | 12,993,209 | 864,062 |
| Events in quadrant D | 5,830,567 | 927,359 |
| Mode M9 | |||
|---|---|---|---|
| Quadrant | BADHDUFLAG | Total packets | Discarded packets |
| A | 0 | 13 | 0 |
| B | 0 | 13 | 0 |
| C | 0 | 13 | 0 |
| D | 0 | 14 | 0 |
| Mode SS | |||
|---|---|---|---|
| Quadrant | BADHDUFLAG | Total packets | Discarded packets |
| A | 0 | 260 | 0 |
| B | 0 | 260 | 0 |
| C | 0 | 260 | 0 |
| D | 0 | 260 | 0 |
| Mode M0 | |||
|---|---|---|---|
| Quadrant | BADHDUFLAG | Total packets | Discarded packets |
| A | 0 | 28341 | 4 |
| B | 0 | 26901 | 3 |
| C | 0 | 47067 | 3 |
| D | 0 | 26515 | 3 |
| Quadrant | Total seconds | Saturated seconds | Saturation percentage |
|---|---|---|---|
| A | 12864 | 250 | 1.943408% |
| B | 12864 | 251 | 1.951182% |
| C | 12864 | 2123 | 16.503420% |
| D | 12864 | 150 | 1.166045% |
Noise dominated data is calculated using 1-second bins in cleaned event files. If a bin has >2000 counts, and if more than 50% of those come from <1% of pixels, then it is considered to be noise-dominated and hence unusable.
| Quadrant | # 1 sec bins | Bins with >0 counts | Bins with >2000 counts | High rate bins dominated by noise | Noise dominated (total time) | Noise dominated (detector-on time) | Marked lightcurve |
|---|---|---|---|---|---|---|---|
| A | 14115 | 12865 | 26 | 26 | 0.18% | 0.20% | 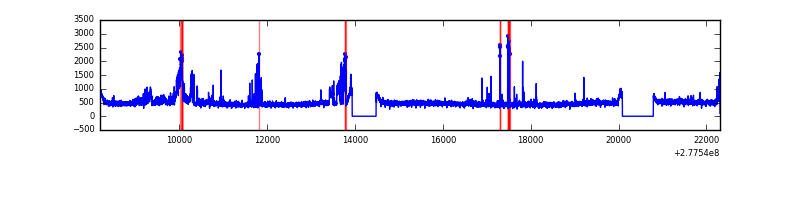 |
| B | 14115 | 12865 | 15 | 15 | 0.11% | 0.12% | 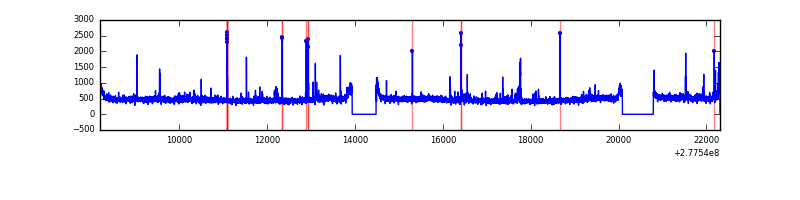 |
| C | 14115 | 12865 | 1528 | 1528 | 10.83% | 11.88% | 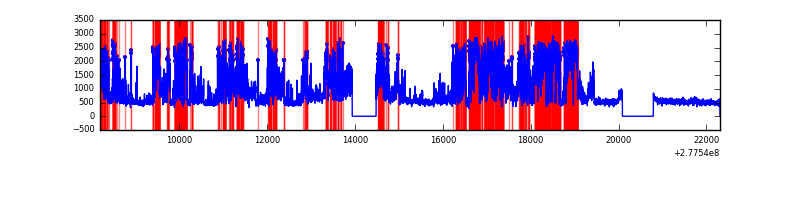 |
| D | 14115 | 12865 | 3 | 3 | 0.02% | 0.02% | 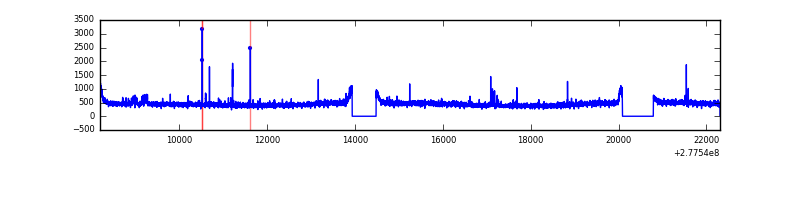 |
Top three noisy pixels from each quadrant. If the there are fewer than three noisy pixels in the level2.evt file, extra rows are filled as -1
| Pixel properties | Quadrant properties | ||||||
|---|---|---|---|---|---|---|---|
| Quadrant | DetID | PixID | Counts | Sigma | Mean | Median | Sigma |
| A | 15 | 174 | 767022 | 2464.84 | 1528 | 1492 | 310.6 |
| A | 3 | 1 | 19734 | 58.74 | 1528 | 1492 | 310.6 |
| A | 0 | 226 | 13040 | 37.18 | 1528 | 1492 | 310.6 |
| B | 15 | 35 | 85655 | 284.75 | 1531 | 1490 | 295.6 |
| B | 4 | 48 | 55420 | 182.46 | 1531 | 1490 | 295.6 |
| B | 12 | 111 | 36651 | 118.96 | 1531 | 1490 | 295.6 |
| C | 3 | 233 | 7303325 | 22271.77 | 1397 | 1403 | 327.9 |
| C | 14 | 238 | 211827 | 641.82 | 1397 | 1403 | 327.9 |
| C | 7 | 247 | 35386 | 103.65 | 1397 | 1403 | 327.9 |
| D | 12 | 227 | 75183 | 201.71 | 1498 | 1452 | 365.5 |
| D | 2 | 234 | 51822 | 137.8 | 1498 | 1452 | 365.5 |
| D | 12 | 144 | 42091 | 111.18 | 1498 | 1452 | 365.5 |
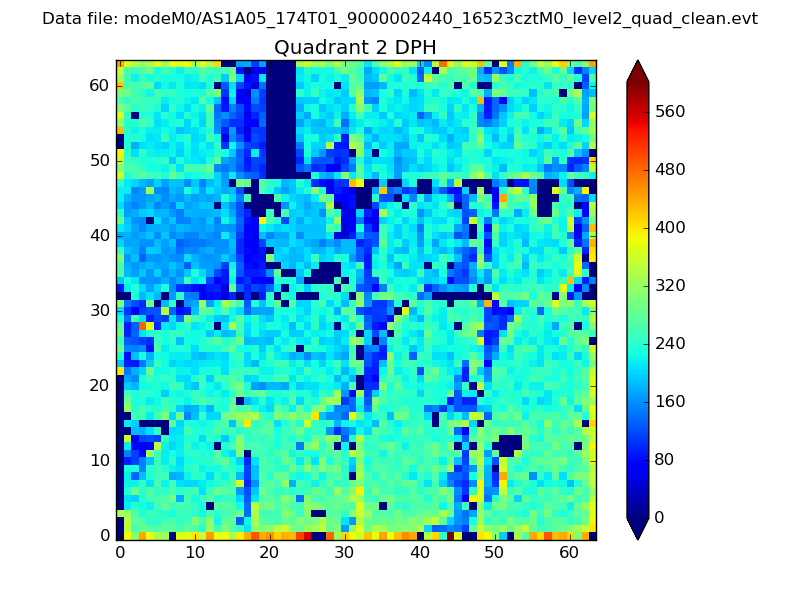
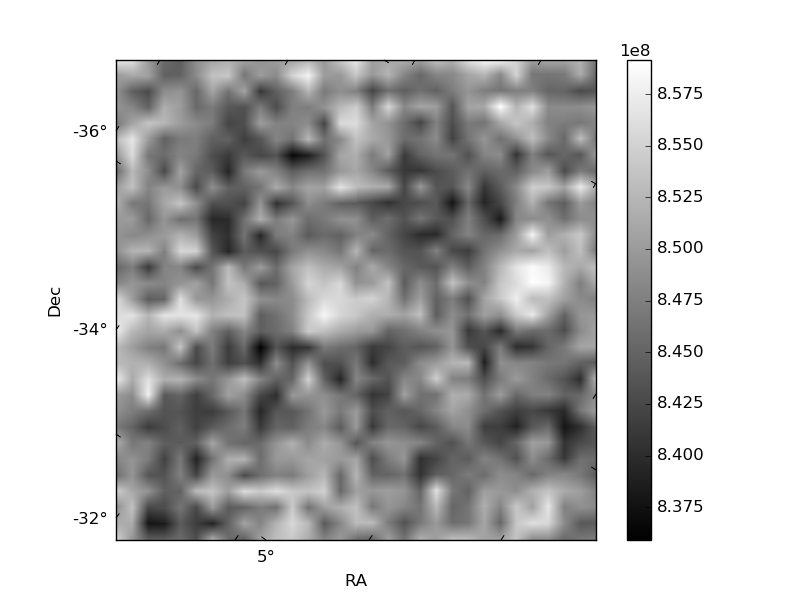
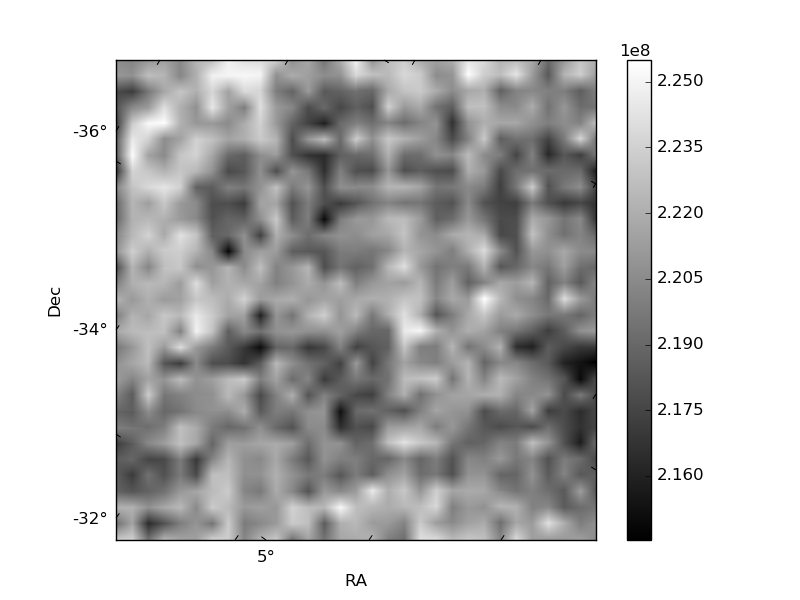
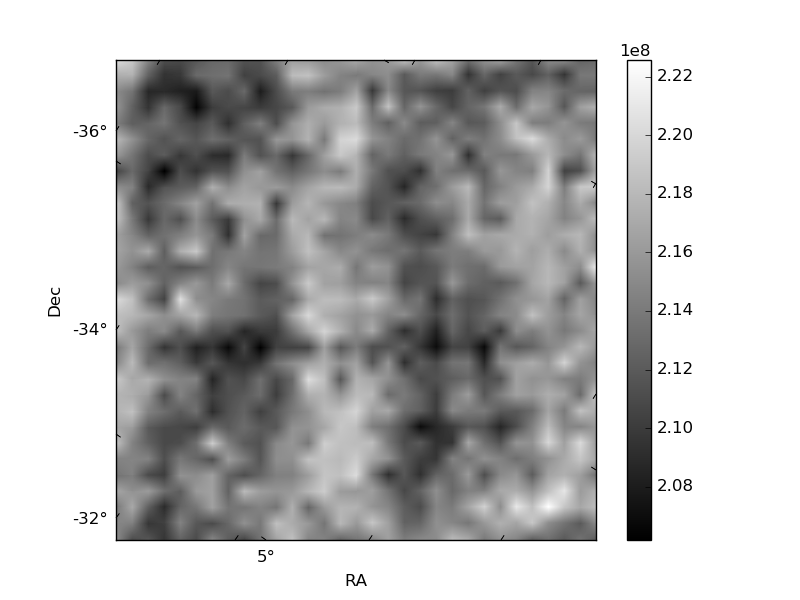
Histogram calculated using DETX and DETY for each event in the final _common_clean file
| Quadrant A | 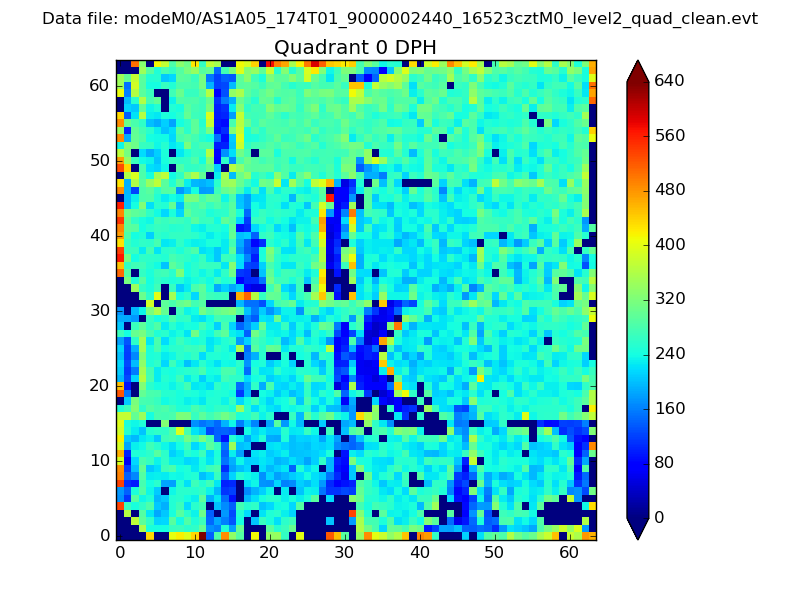 |
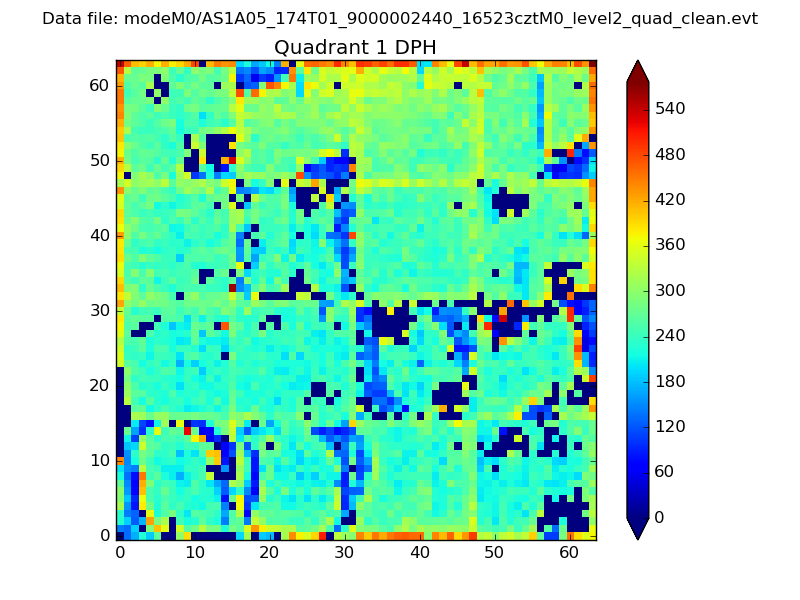 |
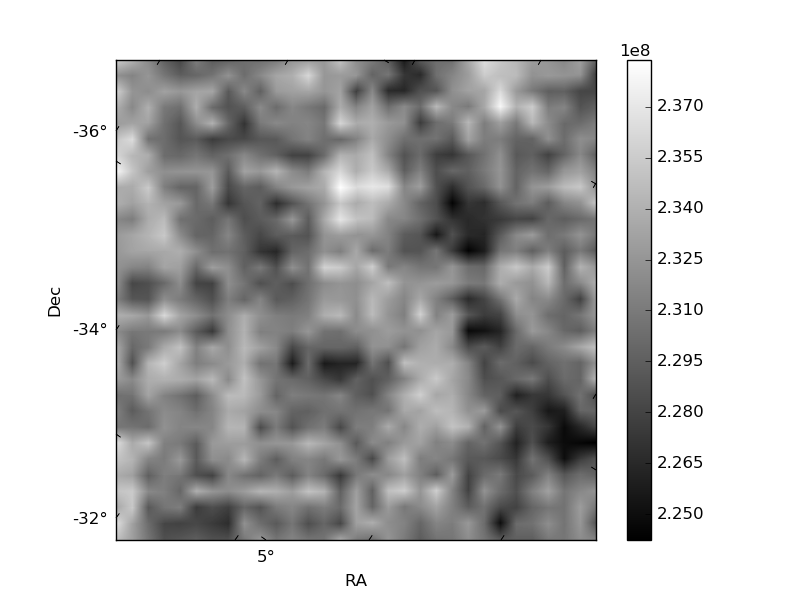
Quadrant B |
|---|---|---|---|
| Quadrant D | 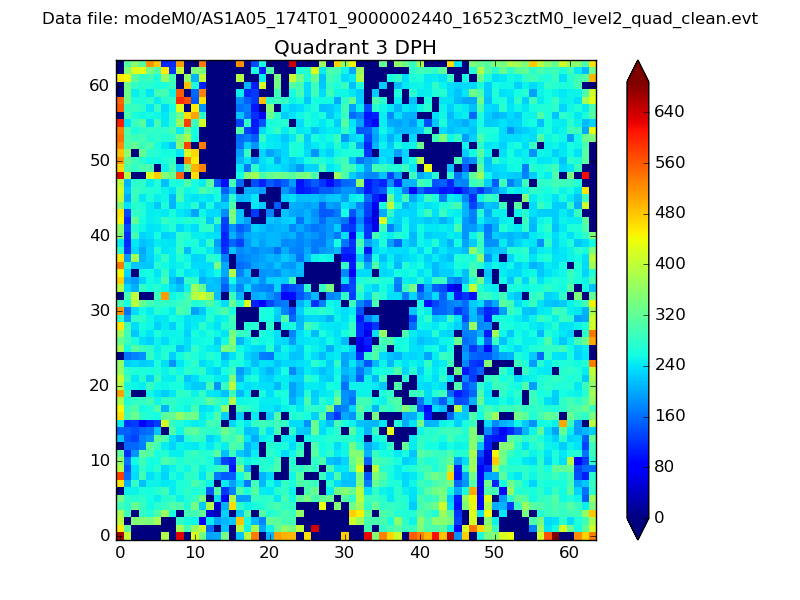 |
 |
Quadrant C |
| Plot type | Count rate plots | Images |
|---|---|---|
| Comparison with Poisson distribution Blue bars denote a histogram of data divided into 1 sec bins. Red curve is a Poisson curve with rate = median count rate of data. |
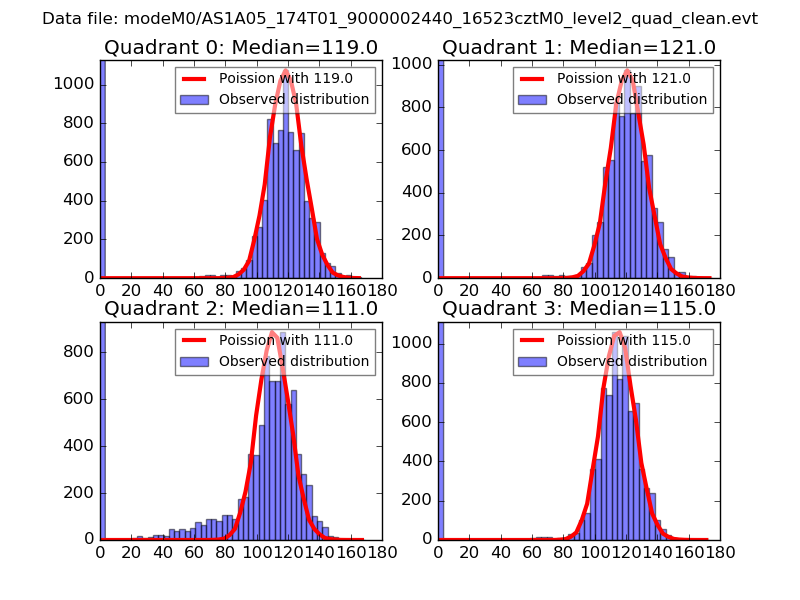 |
 |
| Quadrant-wise count rates Data is divided into 100 sec bins |
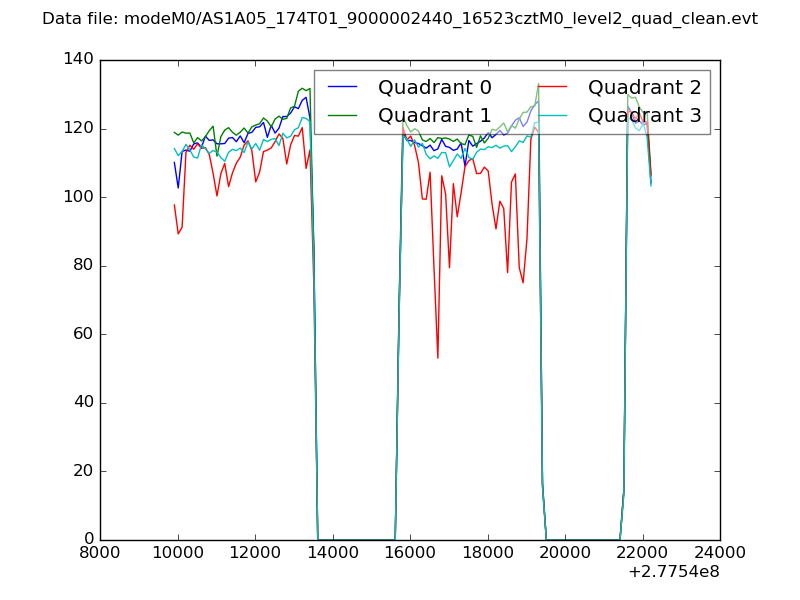 |
|
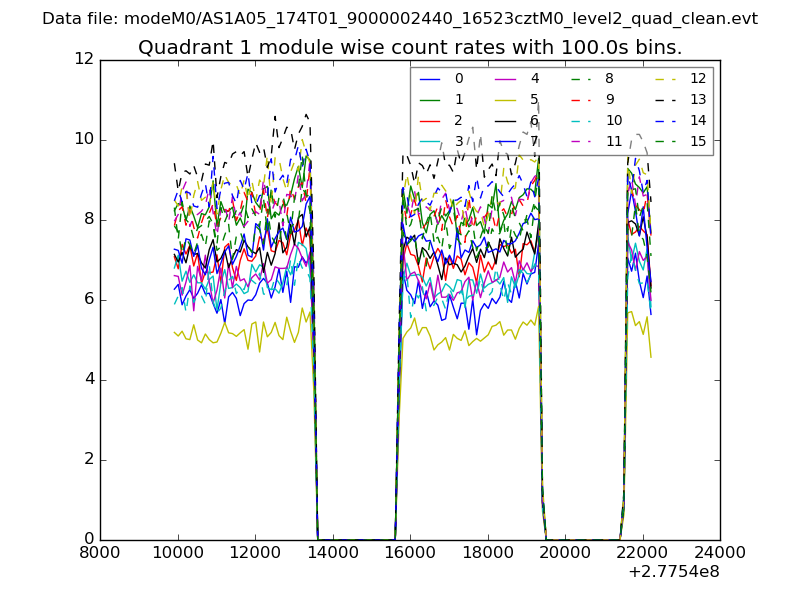
| Module-wise count rates for Quadrant A Data is divided into 100 sec bins |
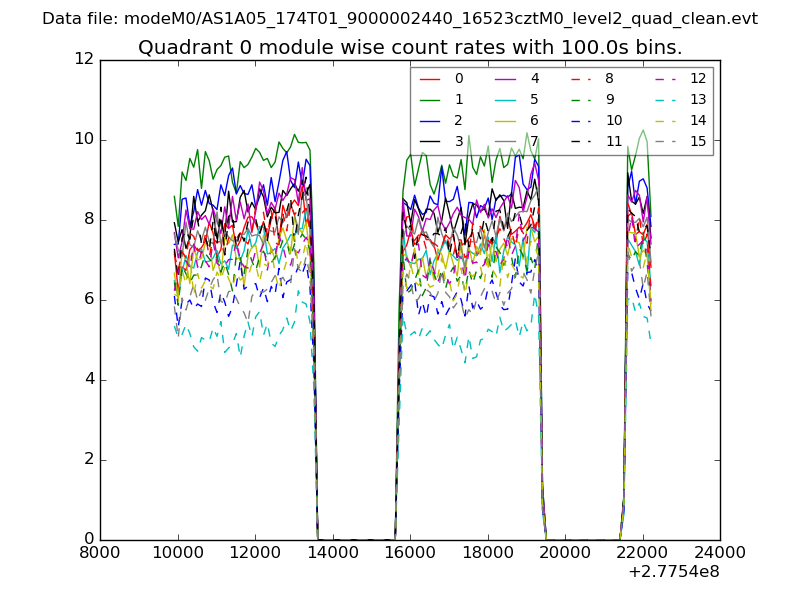 |
 |
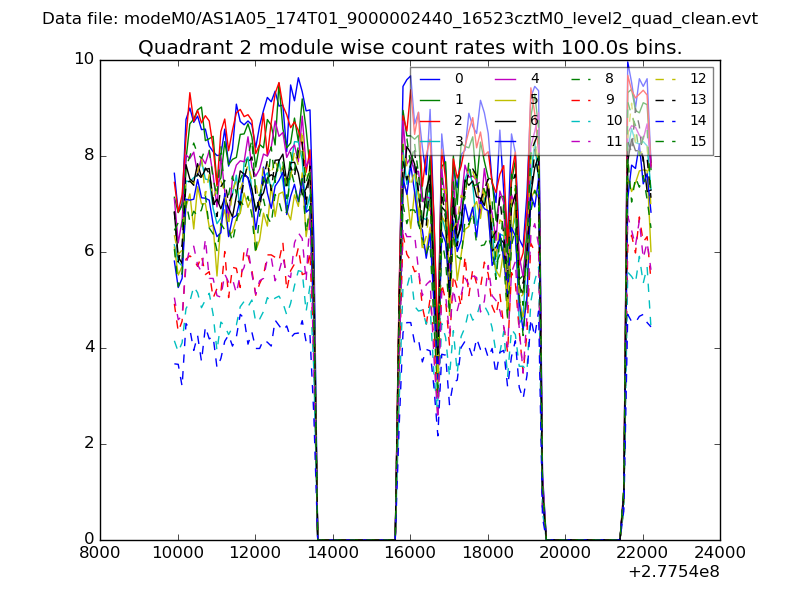
| Module-wise count rates for Quadrant B Data is divided into 100 sec bins |
 |
 |
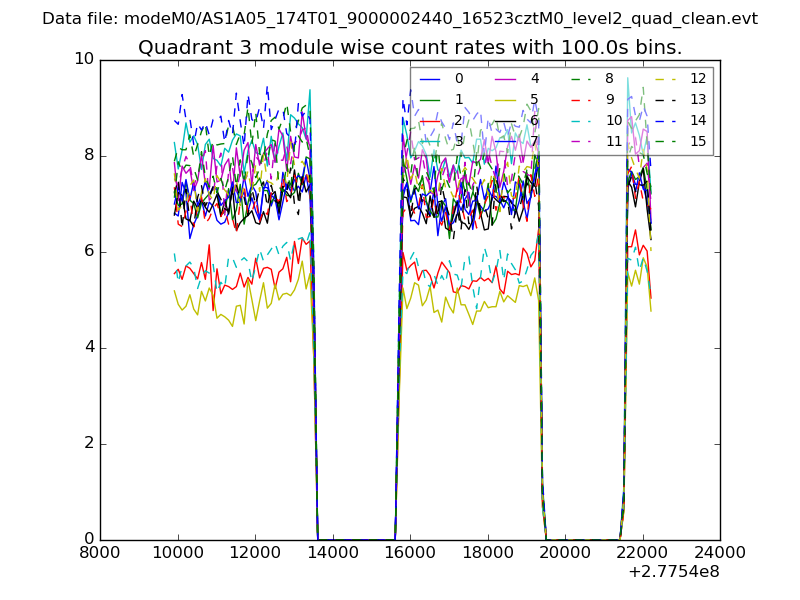
| Module-wise count rates for Quadrant C Data is divided into 100 sec bins |
 |
 |
| Module-wise count rates for Quadrant D Data is divided into 100 sec bins |
 |
 |
| Parameter | Plot |
|---|---|
| CZT HV Monitor | 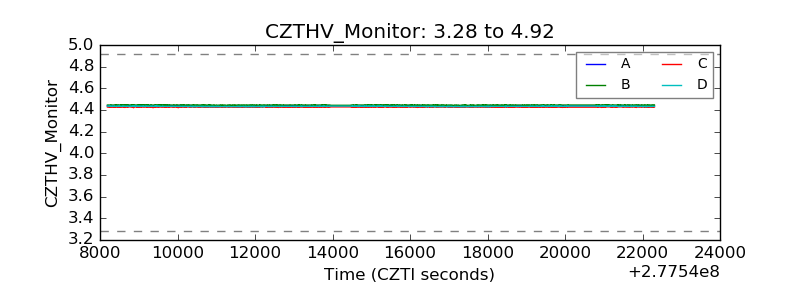 |
| D_VDD | 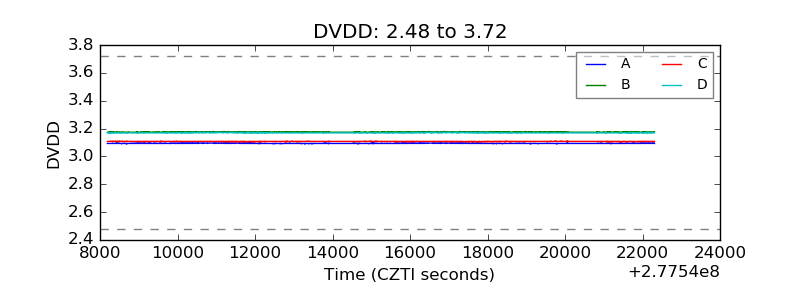 |
| Temperature 1 | 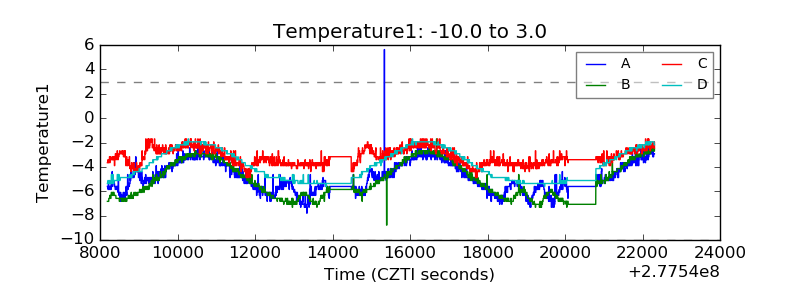 |
| Veto HV Monitor | 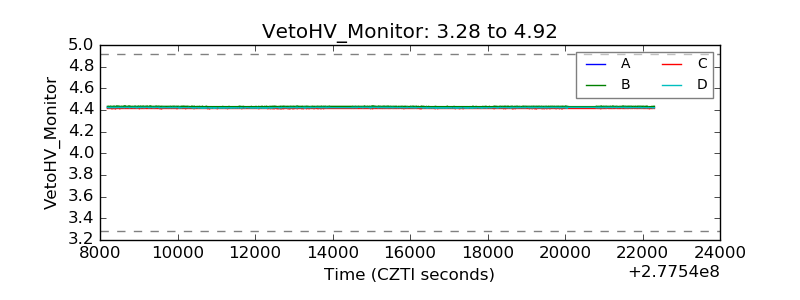 |
| Veto LLD | 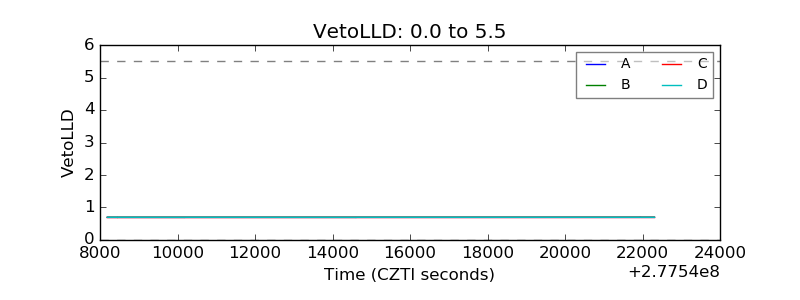 |
| Alpha Counter | 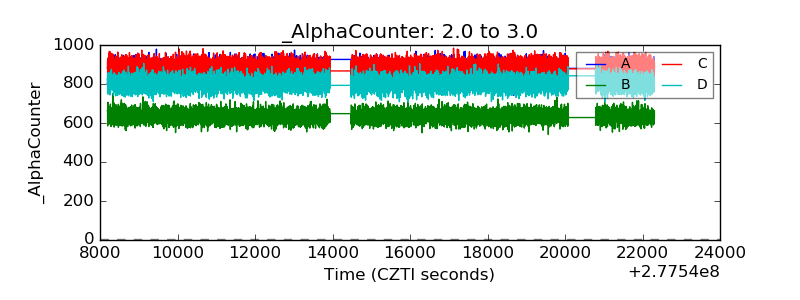 |
| _CPM_Rate | 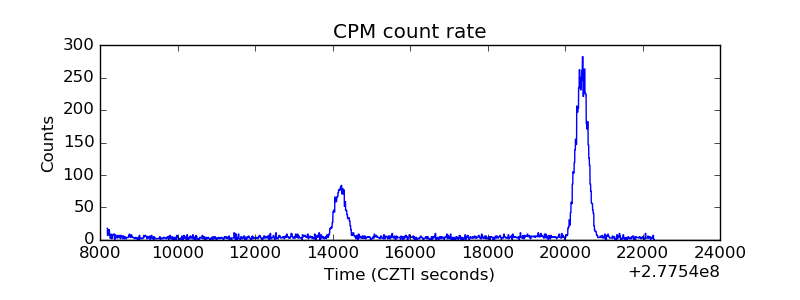 |
| CZT Counter | 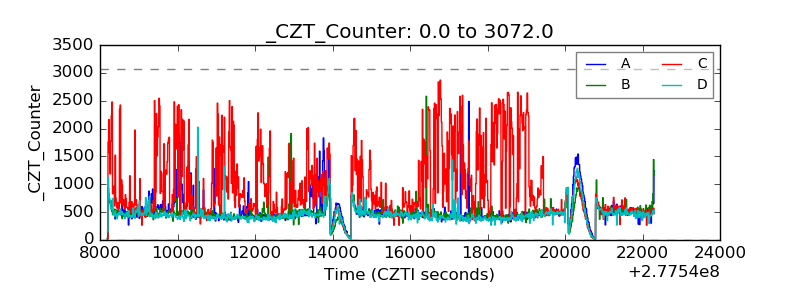 |
| +2.5 Volts monitor |  |
| +5 Volts monitor |  |
| _ROLL_ROT | 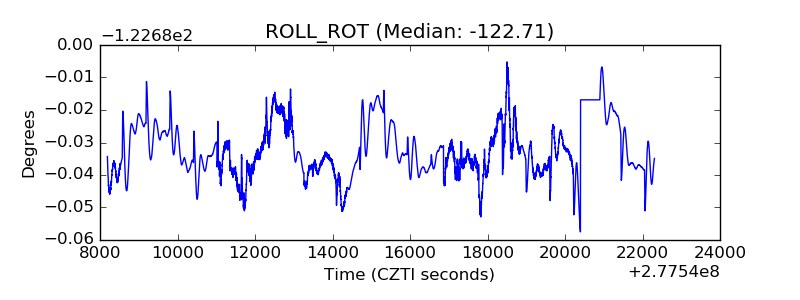 |
| _Roll_DEC | 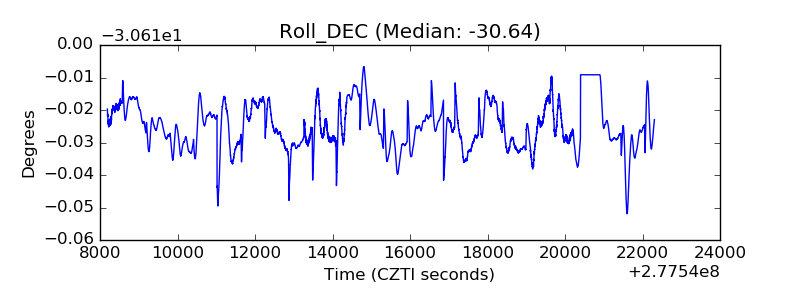 |
| _Roll_RA | 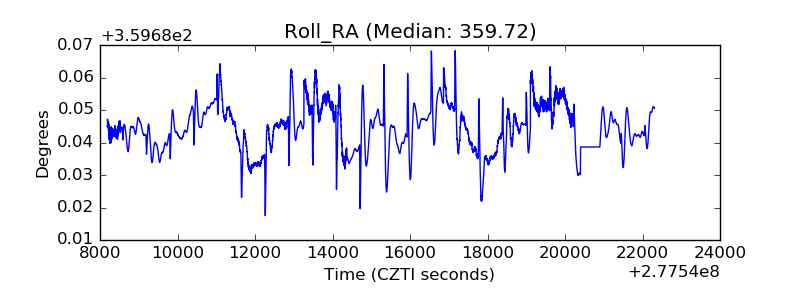 |
| Veto Counter | 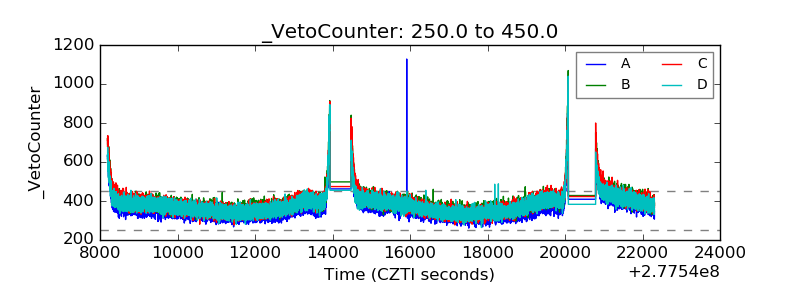 |