| Param | Original file | Final file |
|---|---|---|
| Filename | modeM0/AS1A05_174T01_9000002440_16524cztM0_level2.evt | modeM0/AS1A05_174T01_9000002440_16524cztM0_level2_quad_clean.evt |
| Size (bytes) | 469,368,000 | 89,876,160 |
| Size | 447.6 MB | 85.7 MB |
| Events in quadrant A | 3,567,561 | 565,349 |
| Events in quadrant B | 3,568,298 | 576,602 |
| Events in quadrant C | 3,488,920 | 553,924 |
| Events in quadrant D | 3,124,140 | 548,349 |
| Mode M9 | |||
|---|---|---|---|
| Quadrant | BADHDUFLAG | Total packets | Discarded packets |
| A | 0 | 17 | 0 |
| B | 0 | 17 | 0 |
| C | 0 | 17 | 0 |
| D | 0 | 17 | 0 |
| Mode SS | |||
|---|---|---|---|
| Quadrant | BADHDUFLAG | Total packets | Discarded packets |
| A | 0 | 140 | 0 |
| B | 0 | 140 | 0 |
| C | 0 | 140 | 0 |
| D | 0 | 140 | 0 |
| Mode M0 | |||
|---|---|---|---|
| Quadrant | BADHDUFLAG | Total packets | Discarded packets |
| A | 0 | 15076 | 3 |
| B | 0 | 14936 | 2 |
| C | 0 | 14774 | 2 |
| D | 0 | 14098 | 2 |
| Quadrant | Total seconds | Saturated seconds | Saturation percentage |
|---|---|---|---|
| A | 6857 | 181 | 2.639638% |
| B | 6857 | 189 | 2.756307% |
| C | 6857 | 160 | 2.333382% |
| D | 6857 | 101 | 1.472947% |
Noise dominated data is calculated using 1-second bins in cleaned event files. If a bin has >2000 counts, and if more than 50% of those come from <1% of pixels, then it is considered to be noise-dominated and hence unusable.
| Quadrant | # 1 sec bins | Bins with >0 counts | Bins with >2000 counts | High rate bins dominated by noise | Noise dominated (total time) | Noise dominated (detector-on time) | Marked lightcurve |
|---|---|---|---|---|---|---|---|
| A | 8463 | 6858 | 35 | 35 | 0.41% | 0.51% | 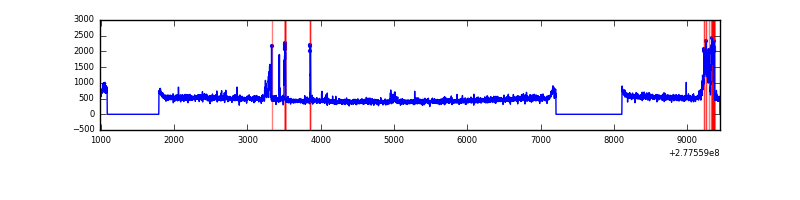 |
| B | 8463 | 6858 | 11 | 11 | 0.13% | 0.16% |  |
| C | 8463 | 6858 | 0 | 0 | 0.00% | 0.00% | 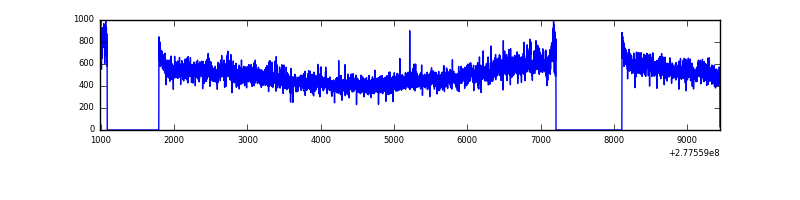 |
| D | 8463 | 6858 | 0 | 0 | 0.00% | 0.00% | 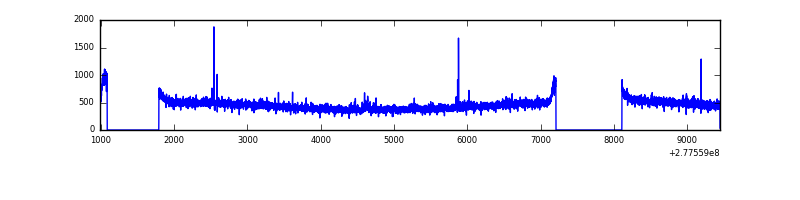 |
Top three noisy pixels from each quadrant. If the there are fewer than three noisy pixels in the level2.evt file, extra rows are filled as -1
| Pixel properties | Quadrant properties | ||||||
|---|---|---|---|---|---|---|---|
| Quadrant | DetID | PixID | Counts | Sigma | Mean | Median | Sigma |
| A | 15 | 174 | 327722 | 1915.97 | 841 | 822 | 170.6 |
| A | 0 | 226 | 7437 | 38.77 | 841 | 822 | 170.6 |
| A | 15 | 223 | 7327 | 38.13 | 841 | 822 | 170.6 |
| B | 15 | 35 | 80876 | 486.28 | 838 | 815 | 164.6 |
| B | 4 | 173 | 57020 | 341.38 | 838 | 815 | 164.6 |
| B | 4 | 48 | 45920 | 273.96 | 838 | 815 | 164.6 |
| C | 3 | 233 | 227469 | 1199.61 | 802 | 806 | 188.9 |
| C | 14 | 238 | 123451 | 649.1 | 802 | 806 | 188.9 |
| C | 7 | 247 | 12956 | 64.3 | 802 | 806 | 188.9 |
| D | 2 | 234 | 27902 | 135.89 | 817 | 792 | 199.5 |
| D | 15 | 0 | 13623 | 64.32 | 817 | 792 | 199.5 |
| D | 1 | 52 | 9232 | 42.31 | 817 | 792 | 199.5 |
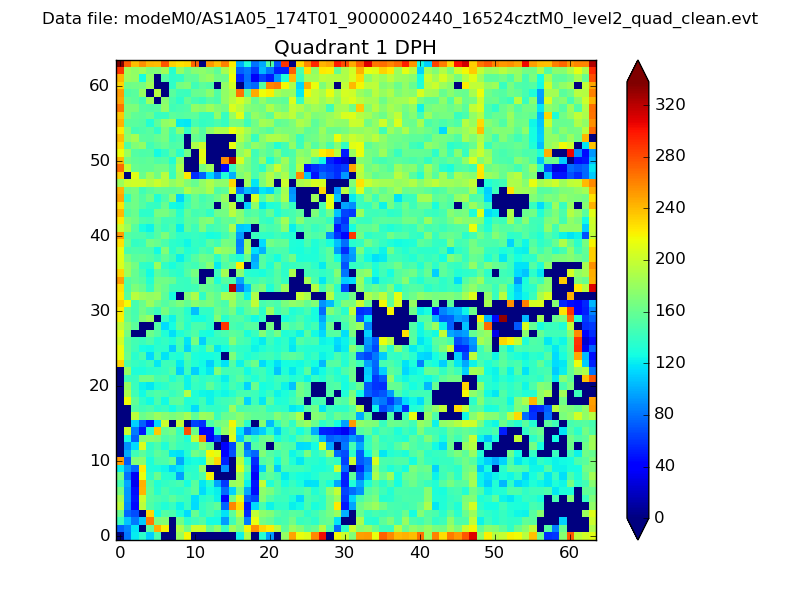
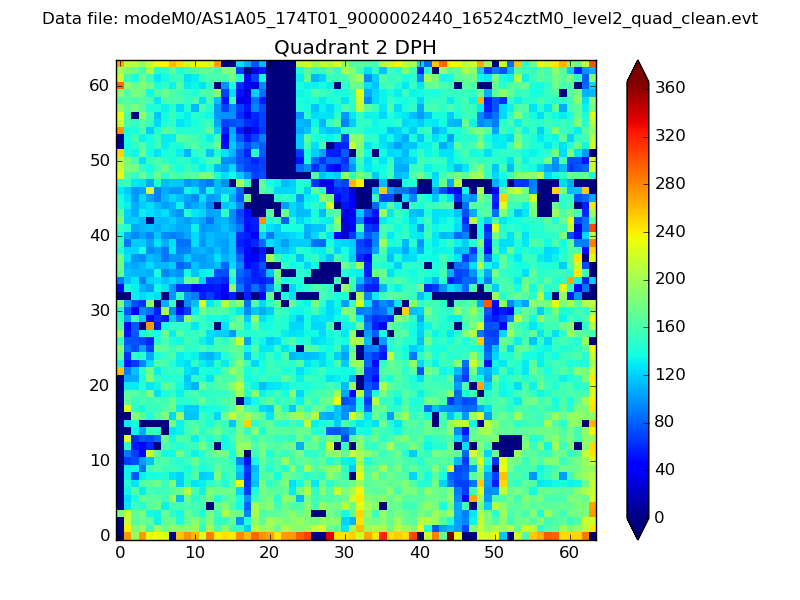
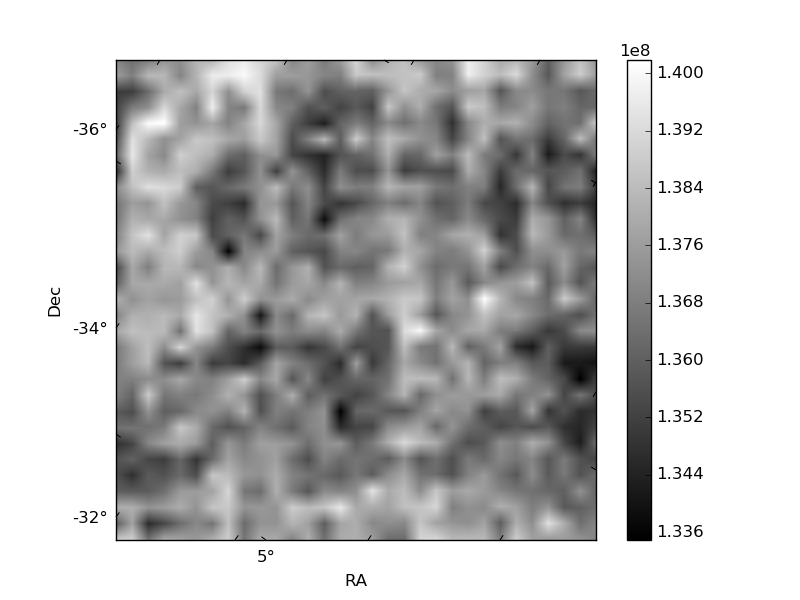
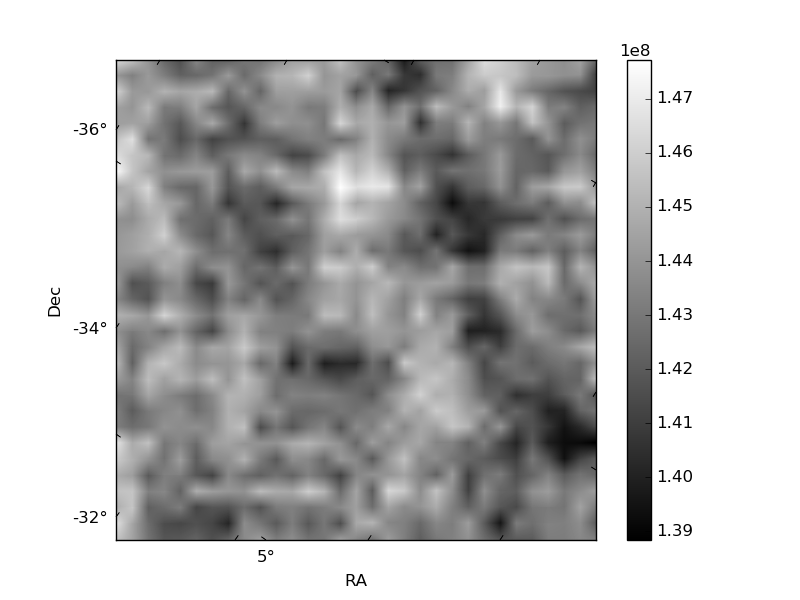
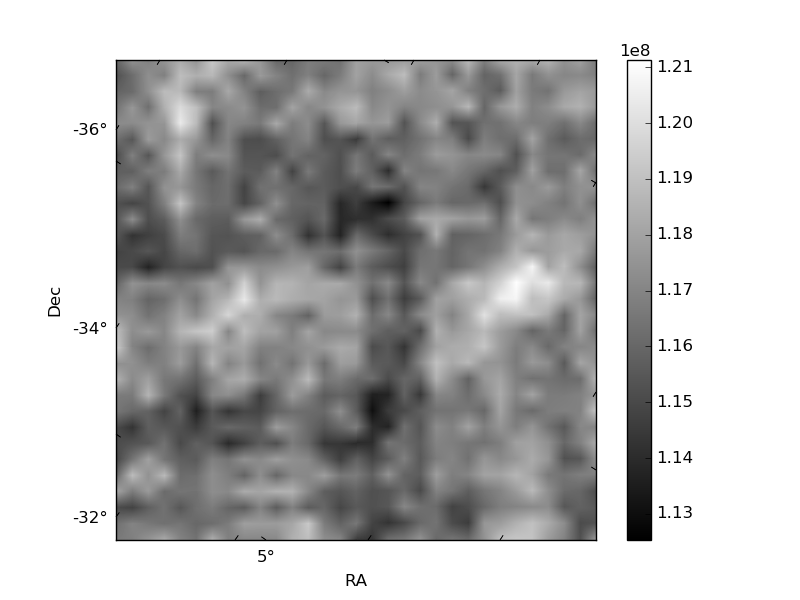
Histogram calculated using DETX and DETY for each event in the final _common_clean file
| Quadrant A | 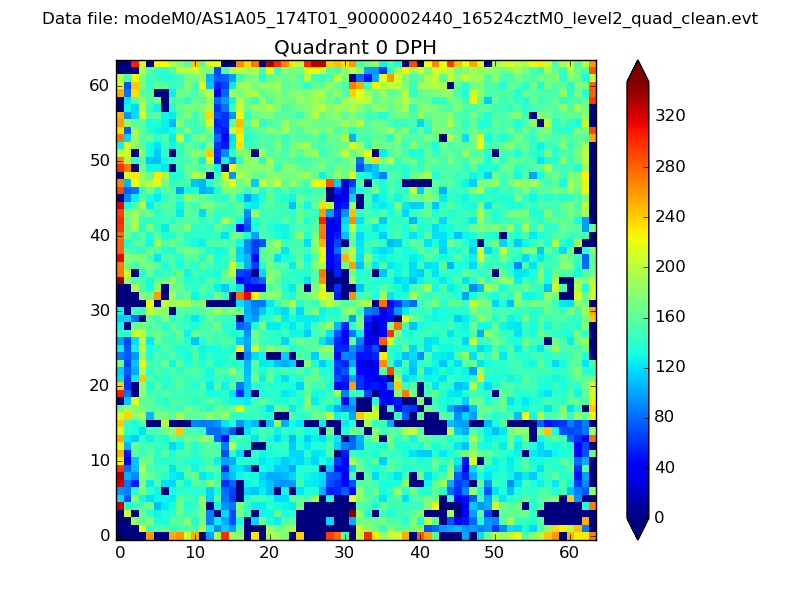 |
 |
Quadrant B |
|---|---|---|---|
| Quadrant D |  |
 |
Quadrant C |
| Plot type | Count rate plots | Images |
|---|---|---|
| Comparison with Poisson distribution Blue bars denote a histogram of data divided into 1 sec bins. Red curve is a Poisson curve with rate = median count rate of data. |
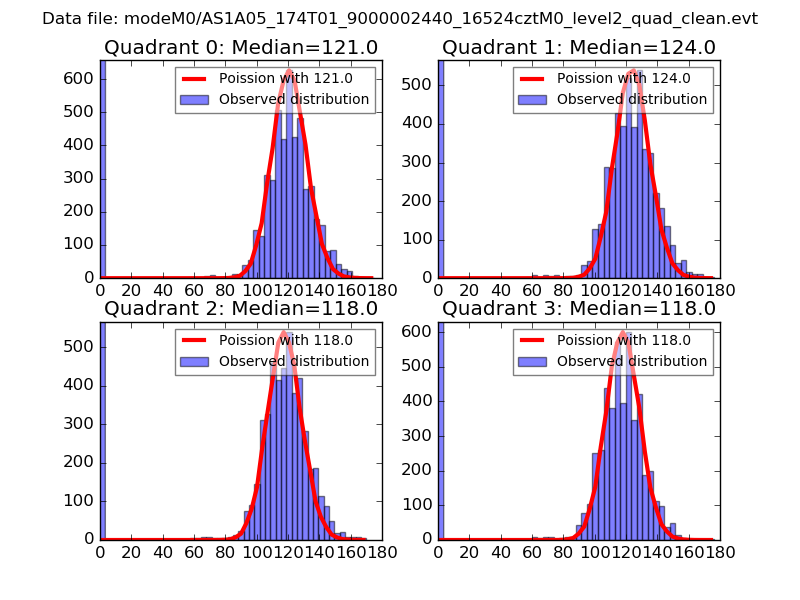 |
 |
| Quadrant-wise count rates Data is divided into 100 sec bins |
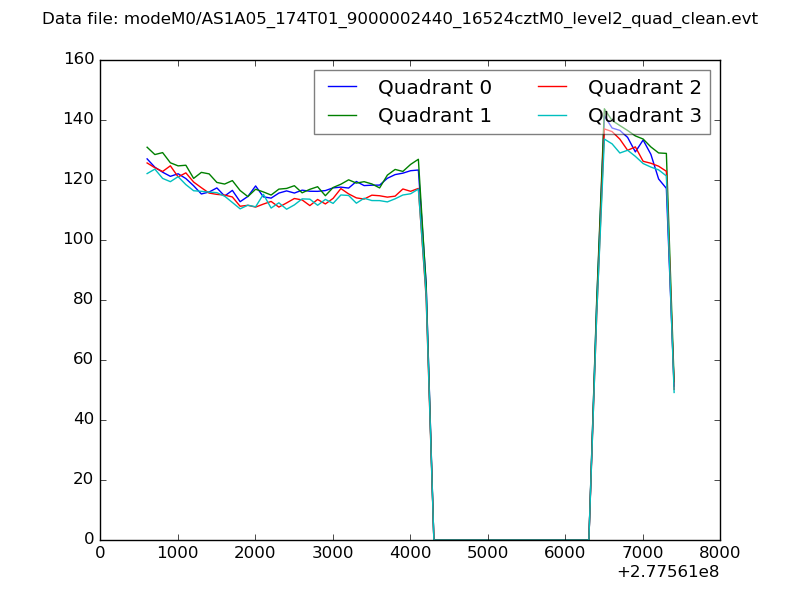 |
|
| Module-wise count rates for Quadrant A Data is divided into 100 sec bins |
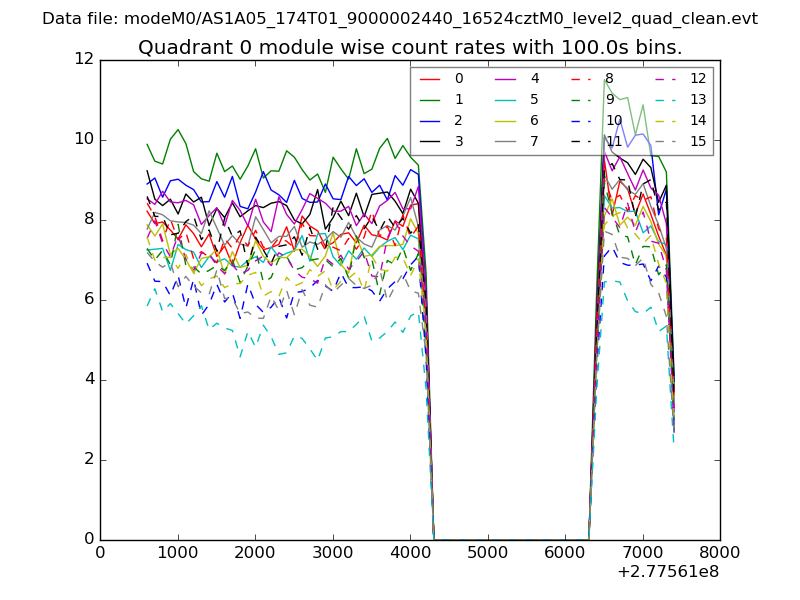 |
 |
| Module-wise count rates for Quadrant B Data is divided into 100 sec bins |
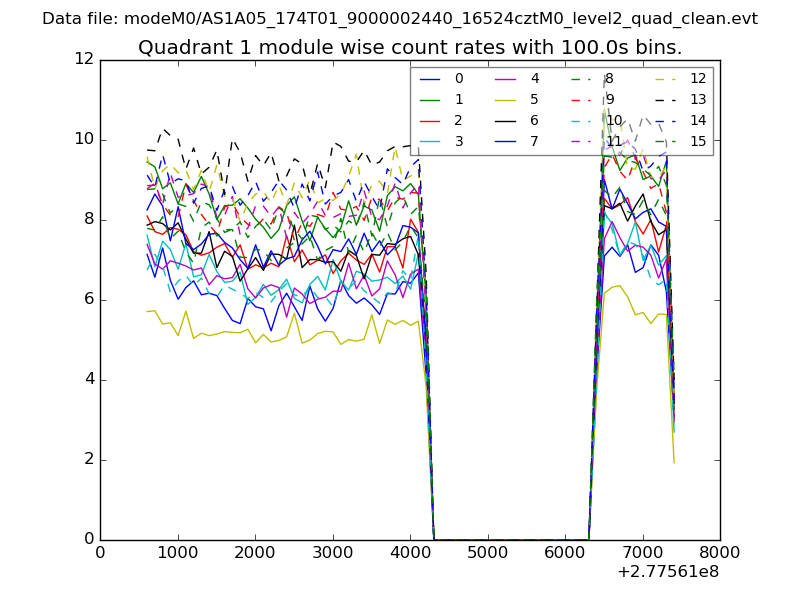 |
 |
| Module-wise count rates for Quadrant C Data is divided into 100 sec bins |
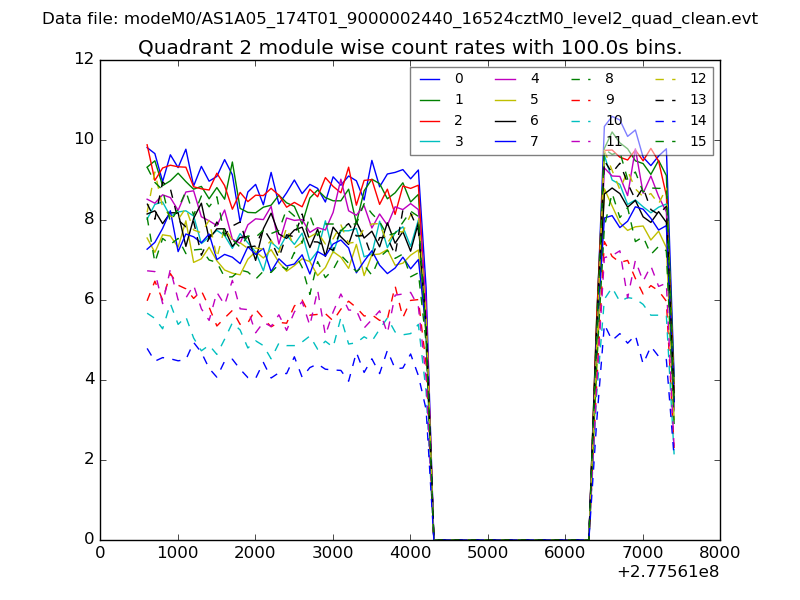 |
 |
| Module-wise count rates for Quadrant D Data is divided into 100 sec bins |
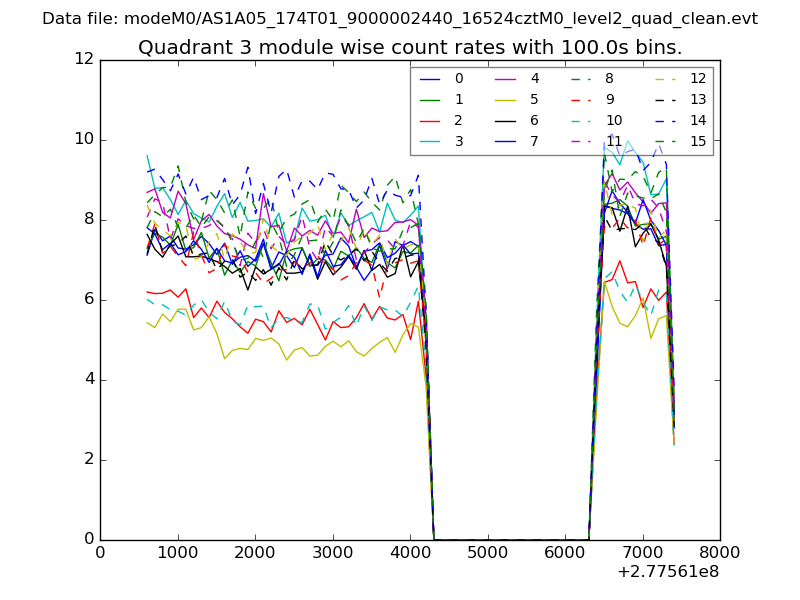 |
 |
| Parameter | Plot |
|---|---|
| CZT HV Monitor | 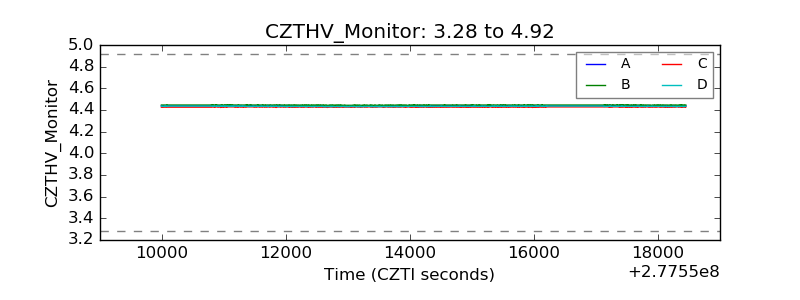 |
| D_VDD | 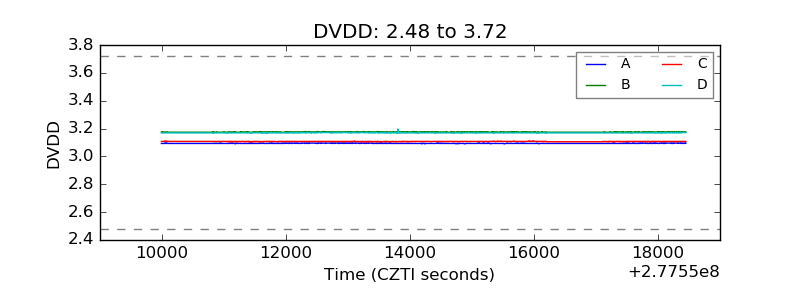 |
| Temperature 1 | 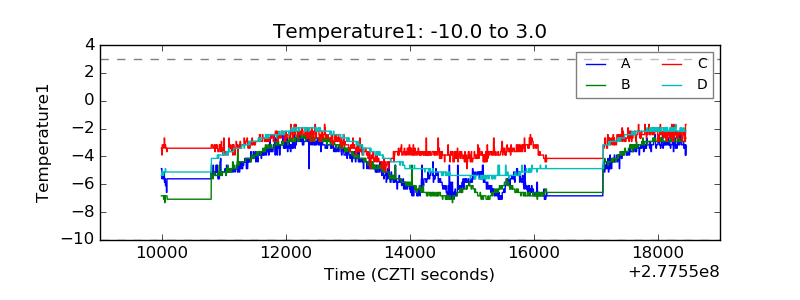 |
| Veto HV Monitor | 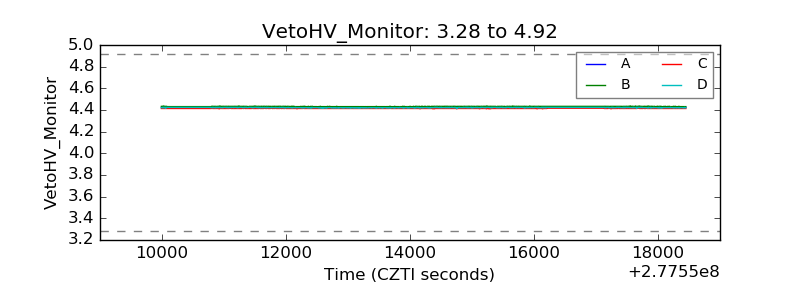 |
| Veto LLD |  |
| Alpha Counter | 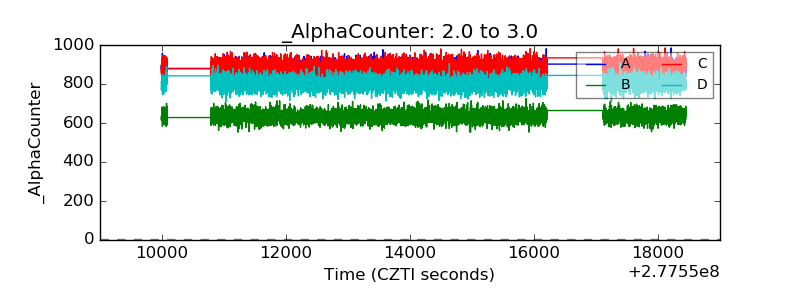 |
| _CPM_Rate | 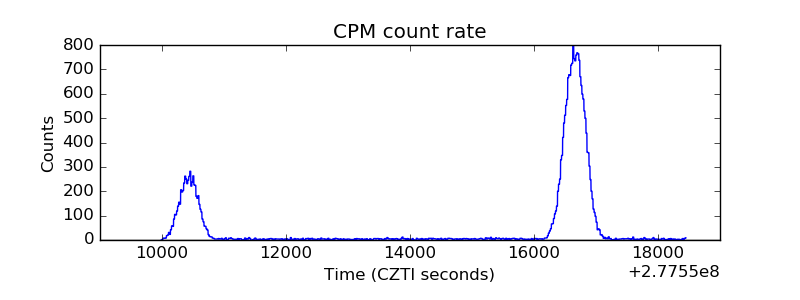 |
| CZT Counter | 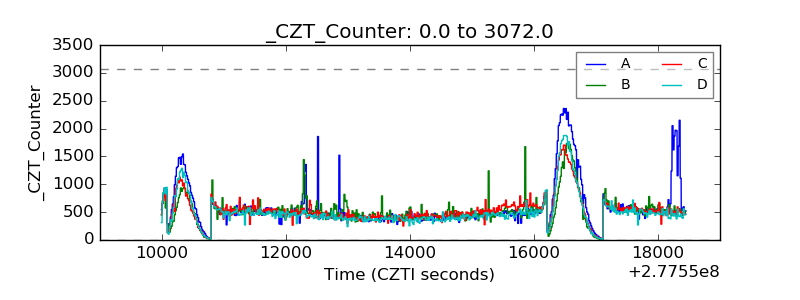 |
| +2.5 Volts monitor |  |
| +5 Volts monitor |  |
| _ROLL_ROT | 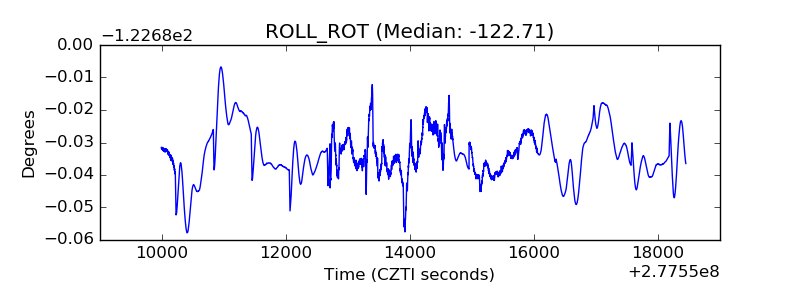 |
| _Roll_DEC | 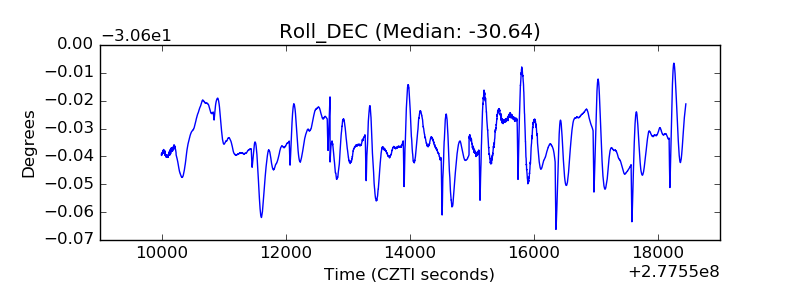 |
| _Roll_RA | 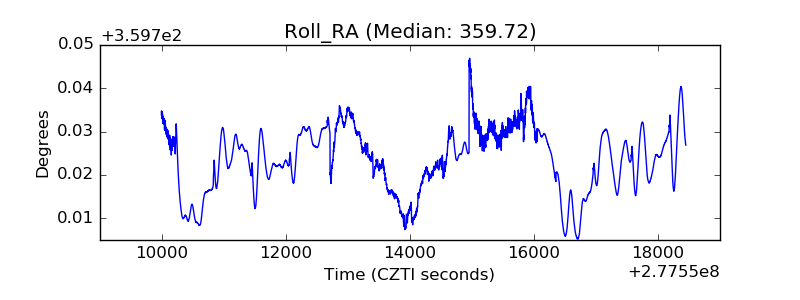 |
| Veto Counter | 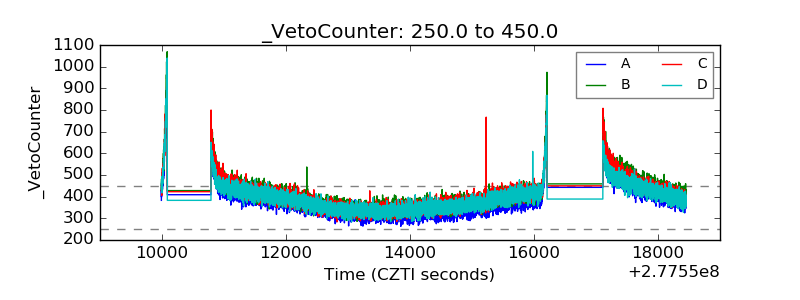 |