| Param | Original file | Final file |
|---|---|---|
| Filename | modeM0/AS1A05_174T01_9000002440_16525cztM0_level2.evt | modeM0/AS1A05_174T01_9000002440_16525cztM0_level2_quad_clean.evt |
| Size (bytes) | 479,856,960 | 97,934,400 |
| Size | 457.6 MB | 93.4 MB |
| Events in quadrant A | 3,578,966 | 630,997 |
| Events in quadrant B | 3,598,916 | 644,002 |
| Events in quadrant C | 3,676,884 | 610,168 |
| Events in quadrant D | 3,213,239 | 604,114 |
| Mode M9 | |||
|---|---|---|---|
| Quadrant | BADHDUFLAG | Total packets | Discarded packets |
| A | 0 | 20 | 0 |
| B | 0 | 20 | 0 |
| C | 0 | 20 | 0 |
| D | 0 | 20 | 0 |
| Mode SS | |||
|---|---|---|---|
| Quadrant | BADHDUFLAG | Total packets | Discarded packets |
| A | 0 | 140 | 0 |
| B | 0 | 140 | 0 |
| C | 0 | 140 | 0 |
| D | 0 | 140 | 0 |
| Mode M0 | |||
|---|---|---|---|
| Quadrant | BADHDUFLAG | Total packets | Discarded packets |
| A | 0 | 15080 | 3 |
| B | 0 | 15172 | 2 |
| C | 0 | 15225 | 2 |
| D | 0 | 14347 | 2 |
| Quadrant | Total seconds | Saturated seconds | Saturation percentage |
|---|---|---|---|
| A | 6841 | 124 | 1.812600% |
| B | 6841 | 117 | 1.710276% |
| C | 6841 | 102 | 1.491010% |
| D | 6841 | 71 | 1.037860% |
Noise dominated data is calculated using 1-second bins in cleaned event files. If a bin has >2000 counts, and if more than 50% of those come from <1% of pixels, then it is considered to be noise-dominated and hence unusable.
| Quadrant | # 1 sec bins | Bins with >0 counts | Bins with >2000 counts | High rate bins dominated by noise | Noise dominated (total time) | Noise dominated (detector-on time) | Marked lightcurve |
|---|---|---|---|---|---|---|---|
| A | 8812 | 6842 | 27 | 27 | 0.31% | 0.39% | 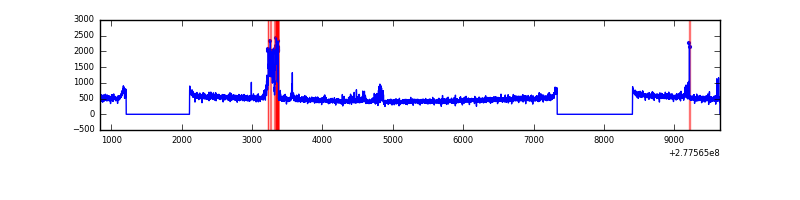 |
| B | 8812 | 6842 | 10 | 10 | 0.11% | 0.15% | 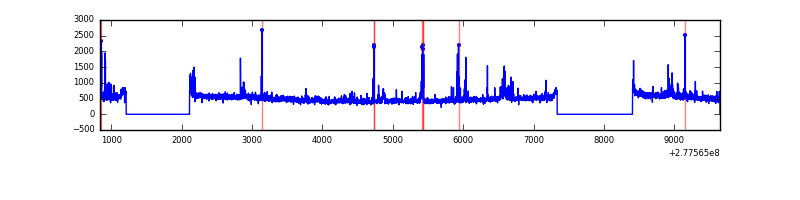 |
| C | 8812 | 6842 | 0 | 0 | 0.00% | 0.00% | 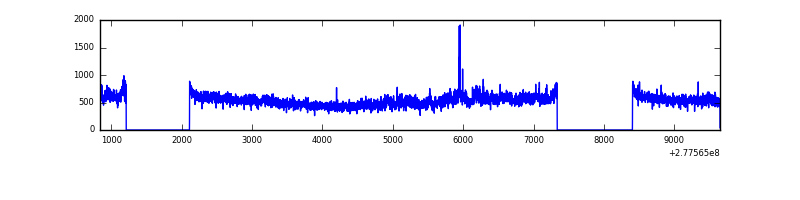 |
| D | 8812 | 6843 | 13 | 13 | 0.15% | 0.19% | 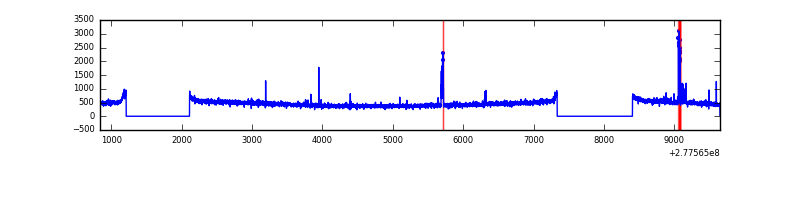 |
Top three noisy pixels from each quadrant. If the there are fewer than three noisy pixels in the level2.evt file, extra rows are filled as -1
| Pixel properties | Quadrant properties | ||||||
|---|---|---|---|---|---|---|---|
| Quadrant | DetID | PixID | Counts | Sigma | Mean | Median | Sigma |
| A | 15 | 174 | 291180 | 1692.58 | 850 | 832 | 171.5 |
| A | 15 | 223 | 15578 | 85.96 | 850 | 832 | 171.5 |
| A | 15 | 239 | 7788 | 40.55 | 850 | 832 | 171.5 |
| B | 10 | 16 | 95563 | 575.98 | 847 | 826 | 164.5 |
| B | 4 | 173 | 47314 | 282.64 | 847 | 826 | 164.5 |
| B | 0 | 198 | 44880 | 267.84 | 847 | 826 | 164.5 |
| C | 3 | 233 | 385815 | 2040.89 | 804 | 808 | 188.6 |
| C | 14 | 238 | 124241 | 654.31 | 804 | 808 | 188.6 |
| C | 7 | 247 | 35604 | 184.45 | 804 | 808 | 188.6 |
| D | 15 | 0 | 99400 | 496.36 | 819 | 796 | 198.7 |
| D | 2 | 234 | 28355 | 138.73 | 819 | 796 | 198.7 |
| D | 14 | 226 | 7917 | 35.85 | 819 | 796 | 198.7 |
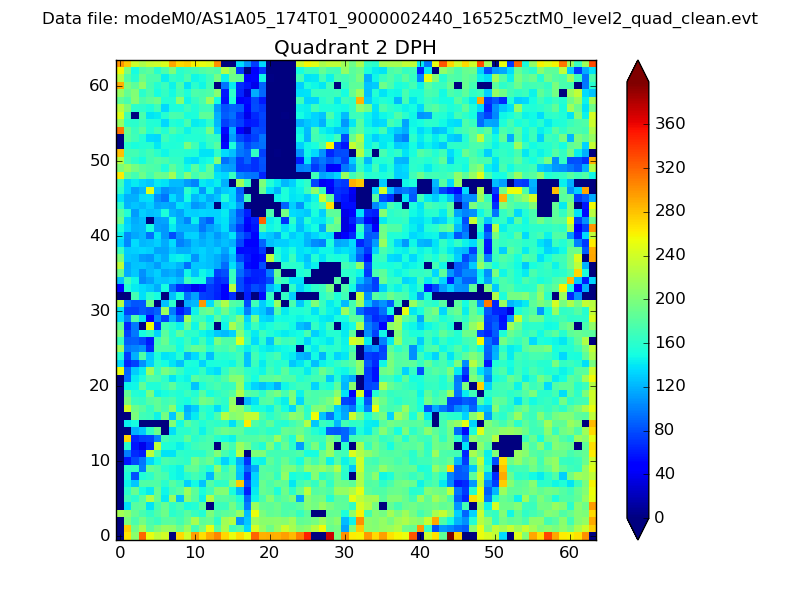
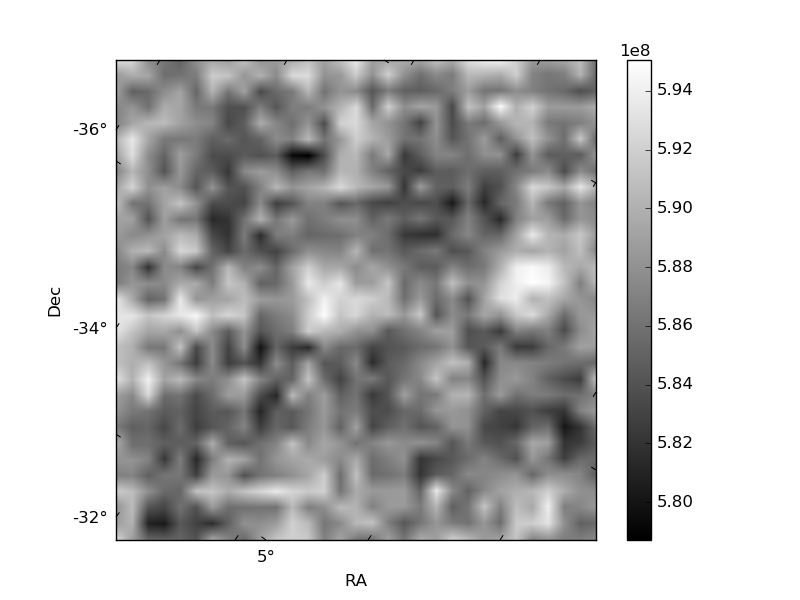
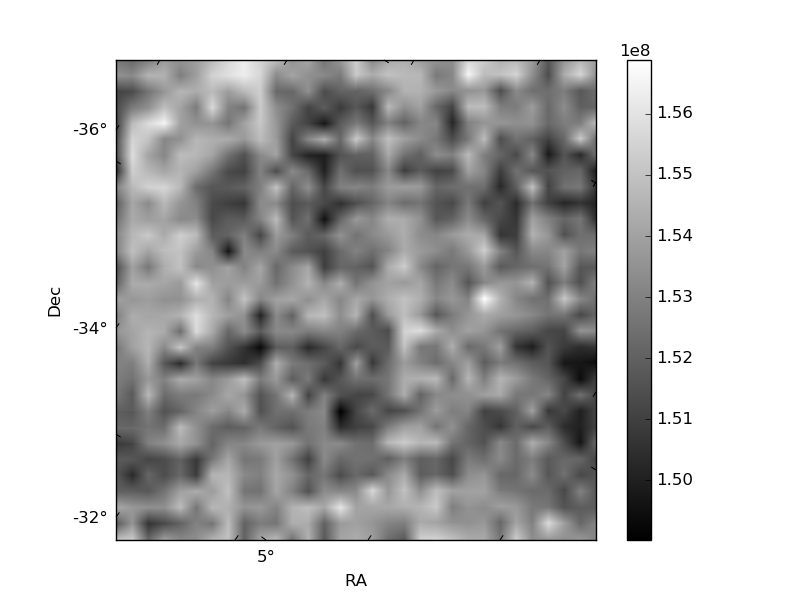
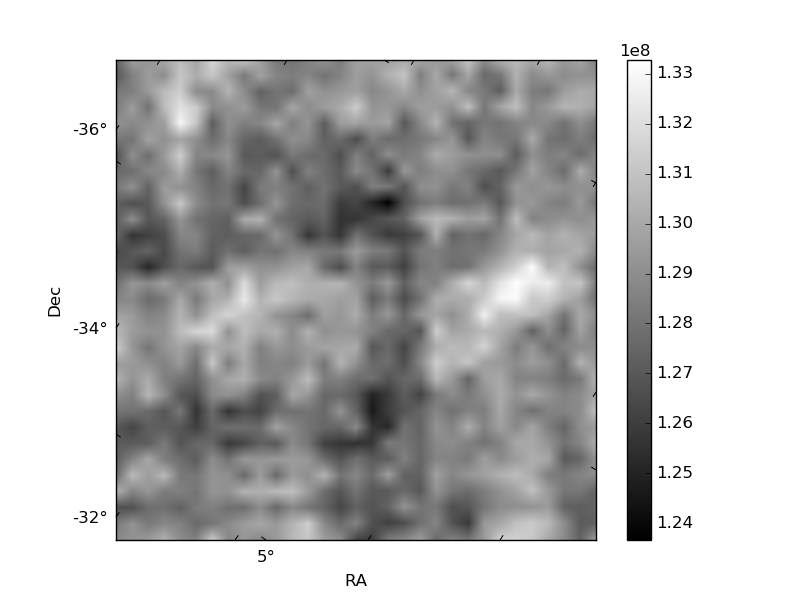
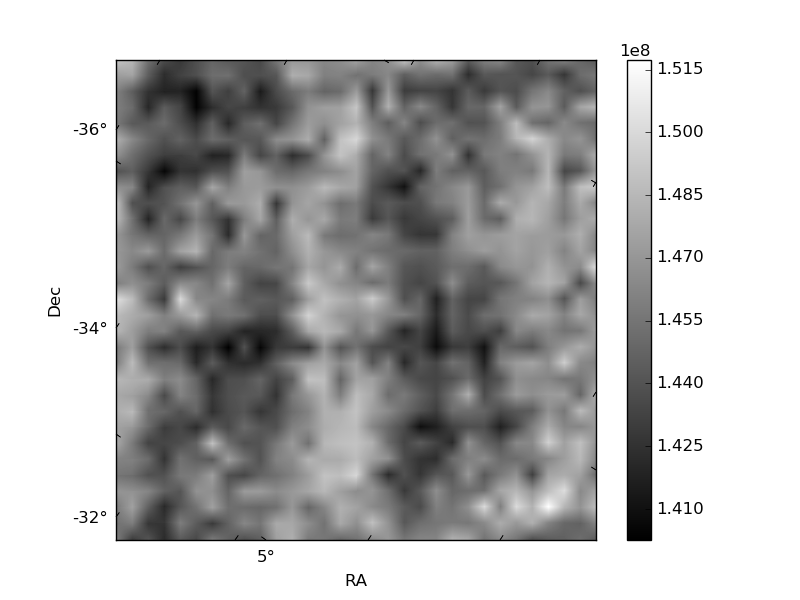
Histogram calculated using DETX and DETY for each event in the final _common_clean file
| Quadrant A | 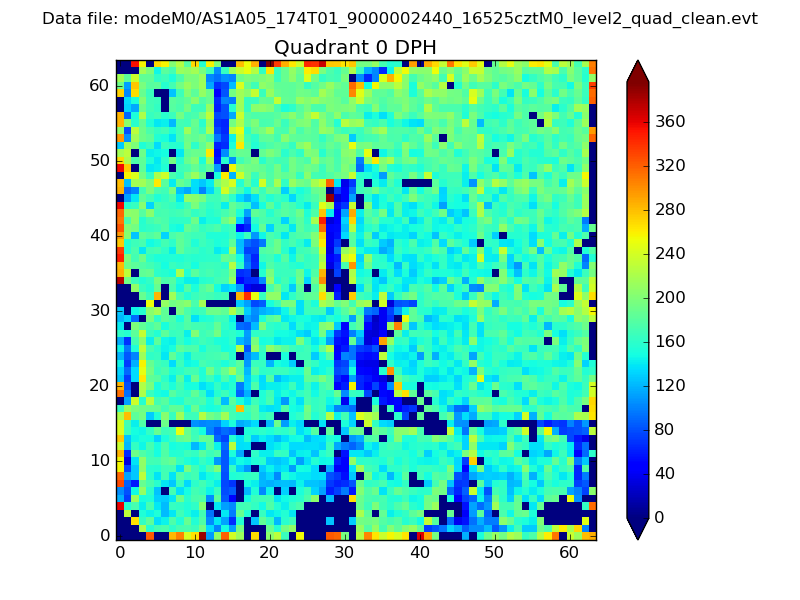 |
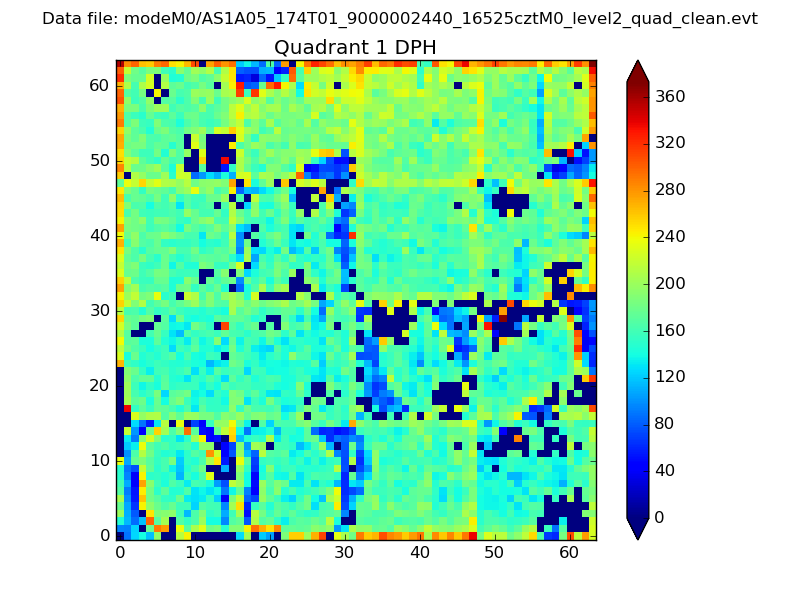 |
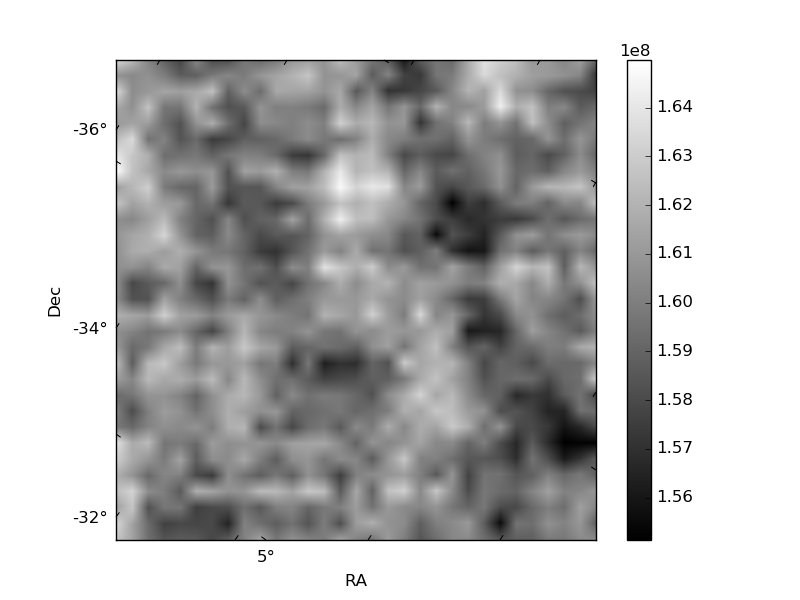
Quadrant B |
|---|---|---|---|
| Quadrant D | 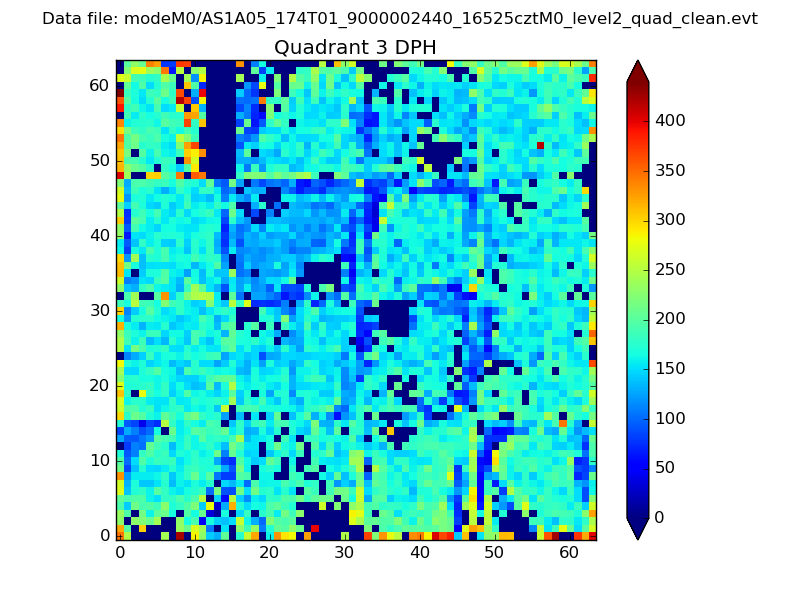 |
 |
Quadrant C |
| Plot type | Count rate plots | Images |
|---|---|---|
| Comparison with Poisson distribution Blue bars denote a histogram of data divided into 1 sec bins. Red curve is a Poisson curve with rate = median count rate of data. |
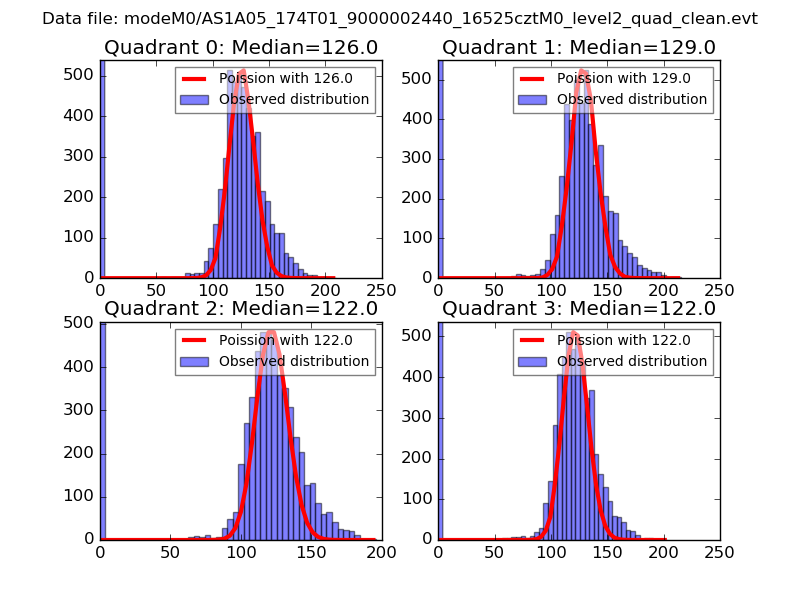 |
 |
| Quadrant-wise count rates Data is divided into 100 sec bins |
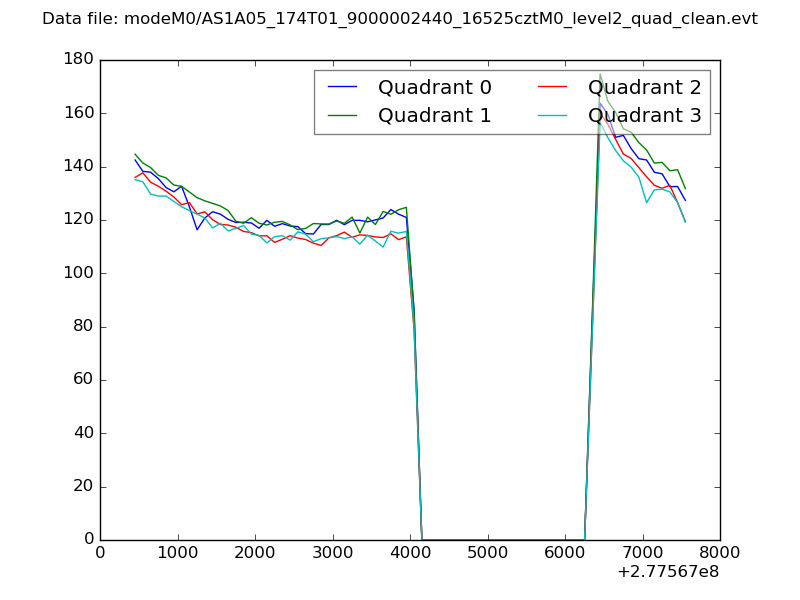 |
|
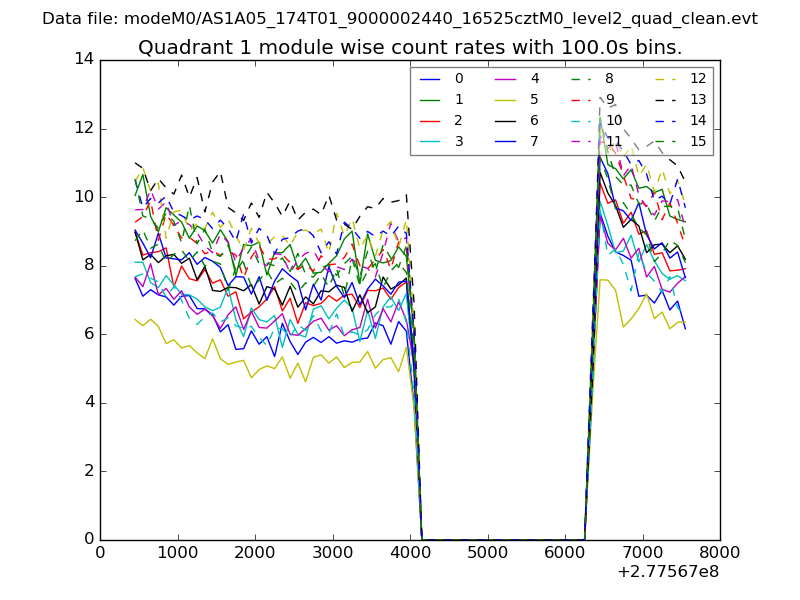
| Module-wise count rates for Quadrant A Data is divided into 100 sec bins |
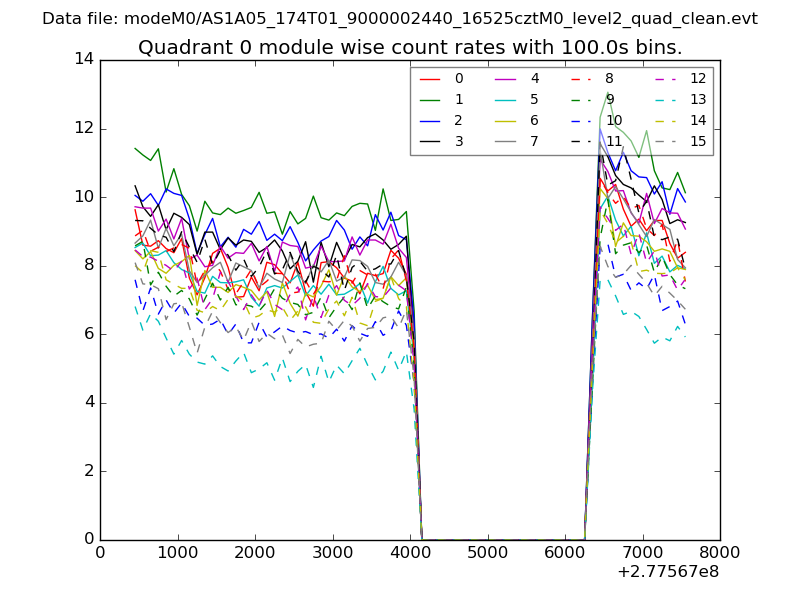 |
 |
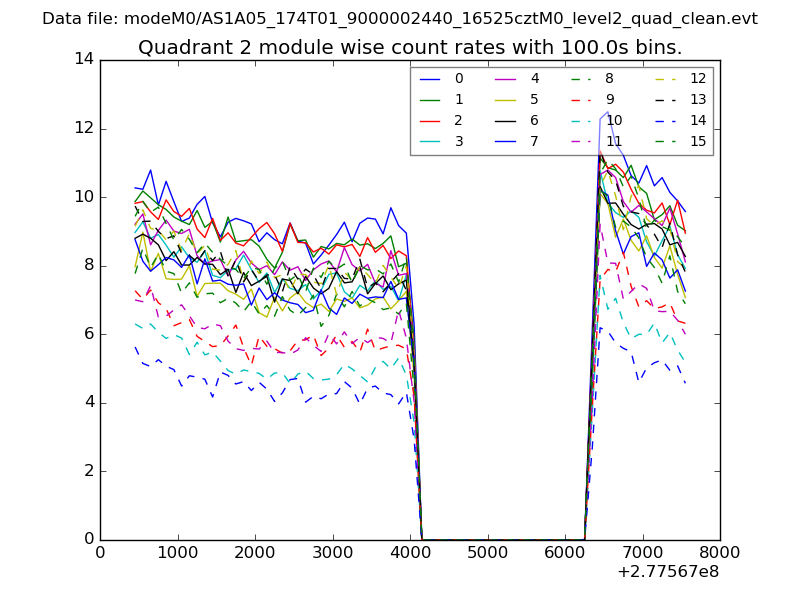
| Module-wise count rates for Quadrant B Data is divided into 100 sec bins |
 |
 |
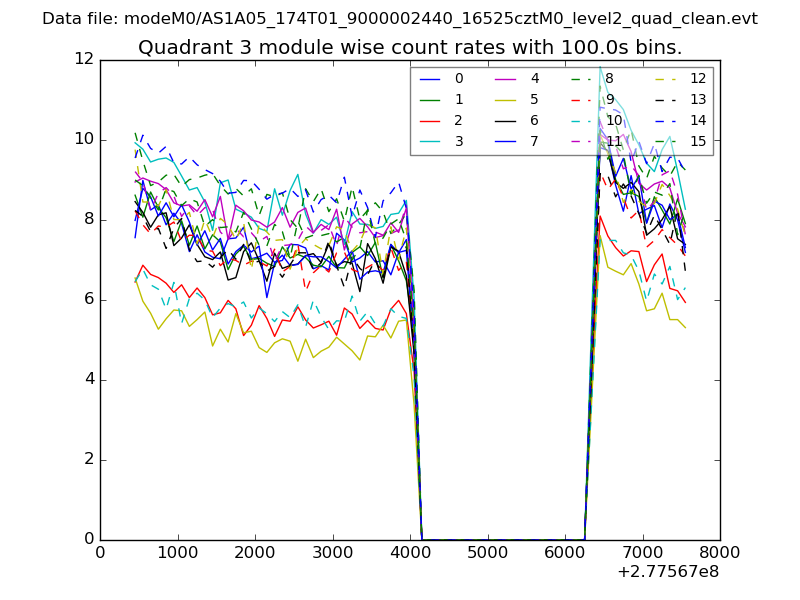
| Module-wise count rates for Quadrant C Data is divided into 100 sec bins |
 |
 |
| Module-wise count rates for Quadrant D Data is divided into 100 sec bins |
 |
 |
| Parameter | Plot |
|---|---|
| CZT HV Monitor | 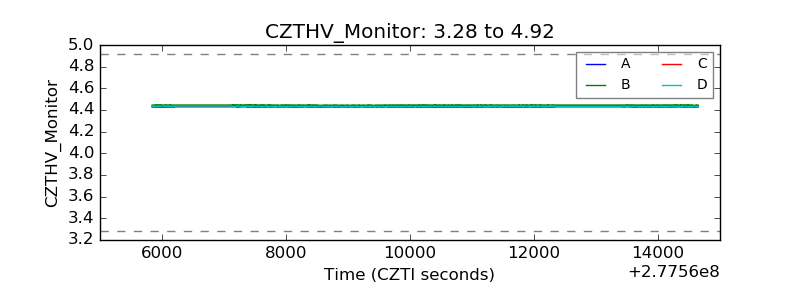 |
| D_VDD | 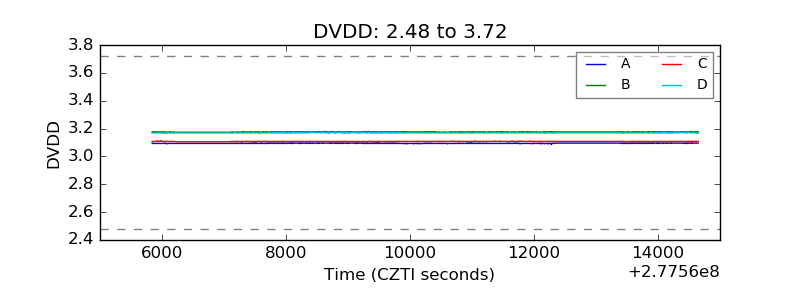 |
| Temperature 1 | 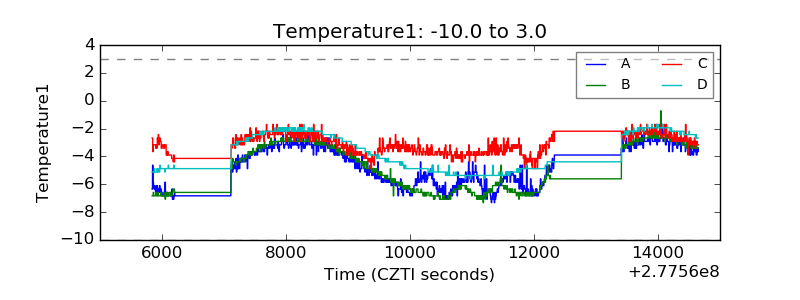 |
| Veto HV Monitor | 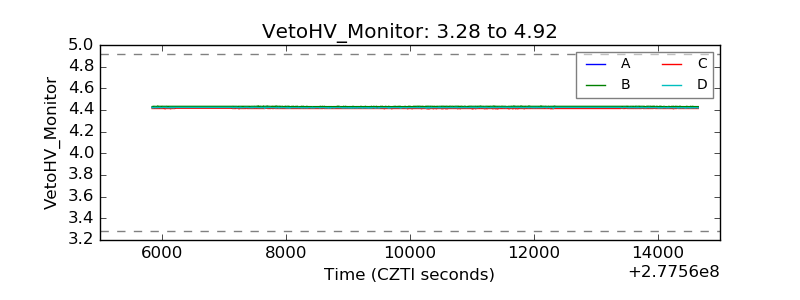 |
| Veto LLD | 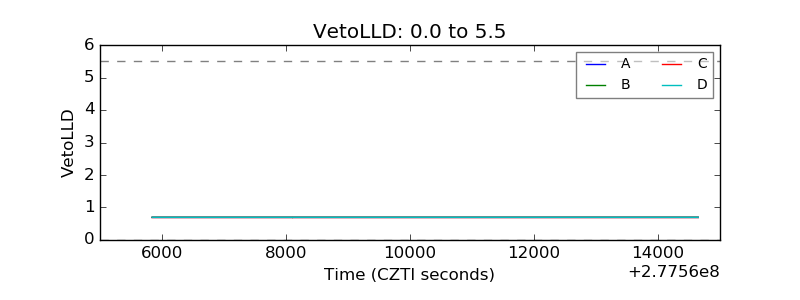 |
| Alpha Counter | 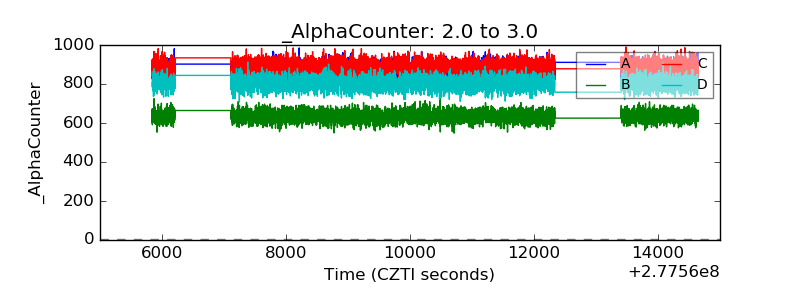 |
| _CPM_Rate | 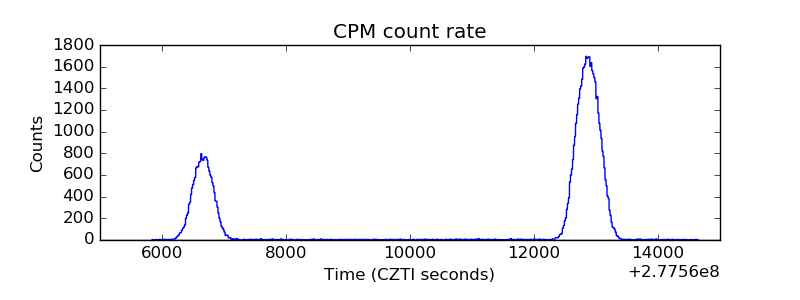 |
| CZT Counter | 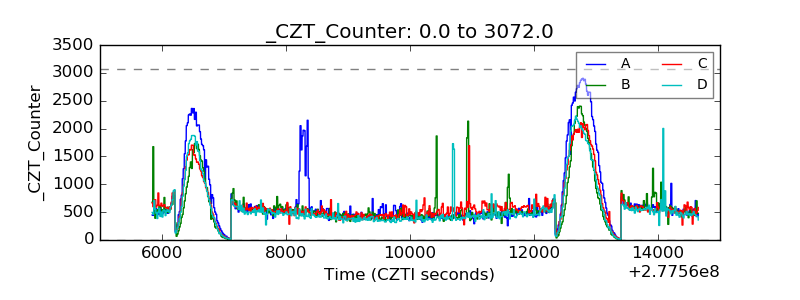 |
| +2.5 Volts monitor |  |
| +5 Volts monitor |  |
| _ROLL_ROT | 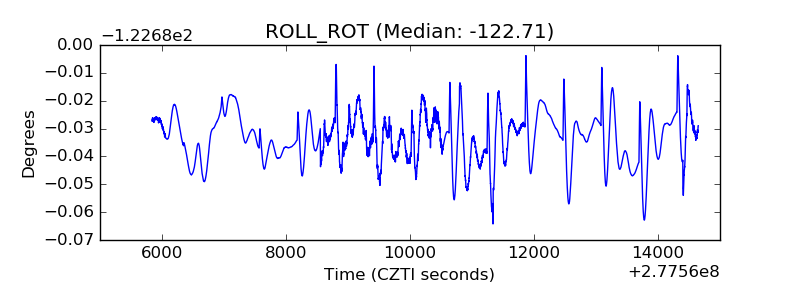 |
| _Roll_DEC | 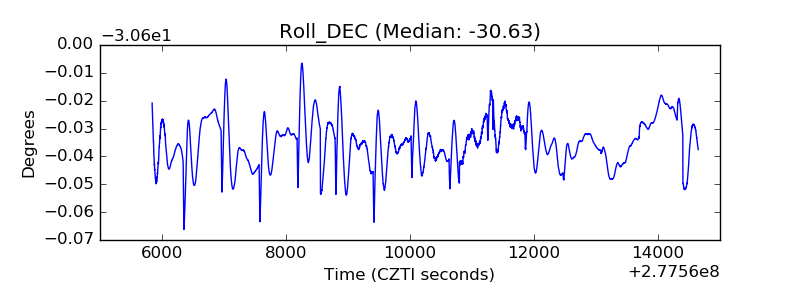 |
| _Roll_RA |  |
| Veto Counter | 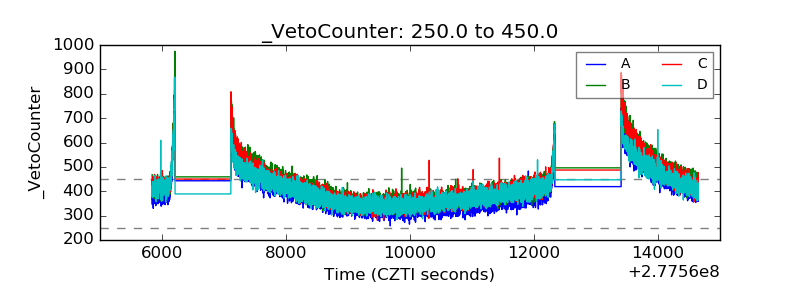 |