| Param | Original file | Final file |
|---|---|---|
| Filename | modeM0/AS1A05_174T01_9000002440_16527cztM0_level2.evt | modeM0/AS1A05_174T01_9000002440_16527cztM0_level2_quad_clean.evt |
| Size (bytes) | 162,489,600 | 44,472,960 |
| Size | 155.0 MB | 42.4 MB |
| Events in quadrant A | 1,456,530 | 297,086 |
| Events in quadrant B | 1,153,716 | 307,743 |
| Events in quadrant C | 1,104,450 | 289,433 |
| Events in quadrant D | 1,048,590 | 287,386 |
| Mode SS | |||
|---|---|---|---|
| Quadrant | BADHDUFLAG | Total packets | Discarded packets |
| A | 0 | 46 | 0 |
| B | 0 | 46 | 0 |
| C | 0 | 46 | 0 |
| D | 0 | 46 | 0 |
| Mode M0 | |||
|---|---|---|---|
| Quadrant | BADHDUFLAG | Total packets | Discarded packets |
| A | 0 | 5808 | 0 |
| B | 0 | 4948 | 0 |
| C | 0 | 4714 | 0 |
| D | 0 | 4776 | 0 |
| Quadrant | Total seconds | Saturated seconds | Saturation percentage |
|---|---|---|---|
| A | 2283 | 69 | 3.022339% |
| B | 2283 | 3 | 0.131406% |
| C | 2283 | 6 | 0.262812% |
| D | 2283 | 12 | 0.525624% |
Noise dominated data is calculated using 1-second bins in cleaned event files. If a bin has >2000 counts, and if more than 50% of those come from <1% of pixels, then it is considered to be noise-dominated and hence unusable.
| Quadrant | # 1 sec bins | Bins with >0 counts | Bins with >2000 counts | High rate bins dominated by noise | Noise dominated (total time) | Noise dominated (detector-on time) | Marked lightcurve |
|---|---|---|---|---|---|---|---|
| A | 2284 | 2284 | 75 | 75 | 3.28% | 3.28% | 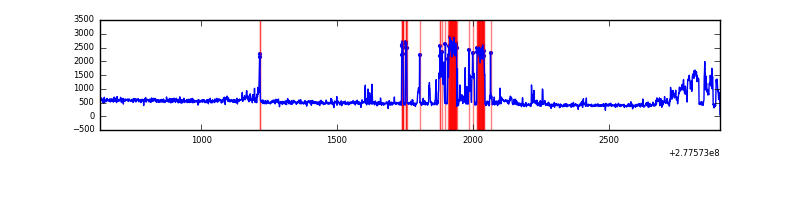 |
| B | 2284 | 2284 | 3 | 3 | 0.13% | 0.13% | 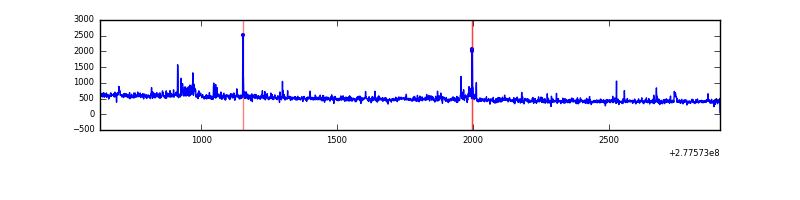 |
| C | 2284 | 2284 | 0 | 0 | 0.00% | 0.00% | 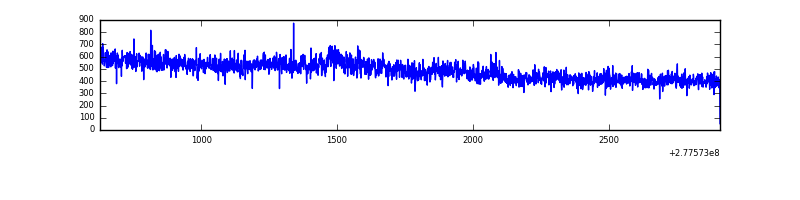 |
| D | 2284 | 2284 | 11 | 11 | 0.48% | 0.48% | 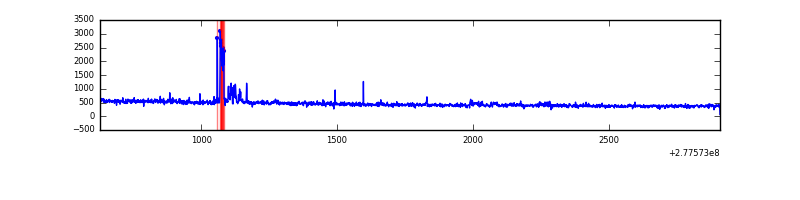 |
Top three noisy pixels from each quadrant. If the there are fewer than three noisy pixels in the level2.evt file, extra rows are filled as -1
| Pixel properties | Quadrant properties | ||||||
|---|---|---|---|---|---|---|---|
| Quadrant | DetID | PixID | Counts | Sigma | Mean | Median | Sigma |
| A | 15 | 174 | 403650 | 7124.88 | 272 | 267 | 56.6 |
| A | 15 | 223 | 3832 | 62.97 | 272 | 267 | 56.6 |
| A | 0 | 226 | 2458 | 38.7 | 272 | 267 | 56.6 |
| B | 0 | 198 | 34759 | 632.66 | 273 | 266 | 54.5 |
| B | 4 | 48 | 12417 | 222.87 | 273 | 266 | 54.5 |
| B | 3 | 209 | 12346 | 221.57 | 273 | 266 | 54.5 |
| C | 3 | 233 | 73984 | 1230.35 | 253 | 254 | 59.9 |
| C | 14 | 238 | 39936 | 662.18 | 253 | 254 | 59.9 |
| C | 7 | 247 | 5223 | 82.92 | 253 | 254 | 59.9 |
| D | 15 | 0 | 65599 | 998.82 | 258 | 250 | 65.4 |
| D | 2 | 234 | 9472 | 140.95 | 258 | 250 | 65.4 |
| D | 1 | 52 | 2556 | 35.25 | 258 | 250 | 65.4 |
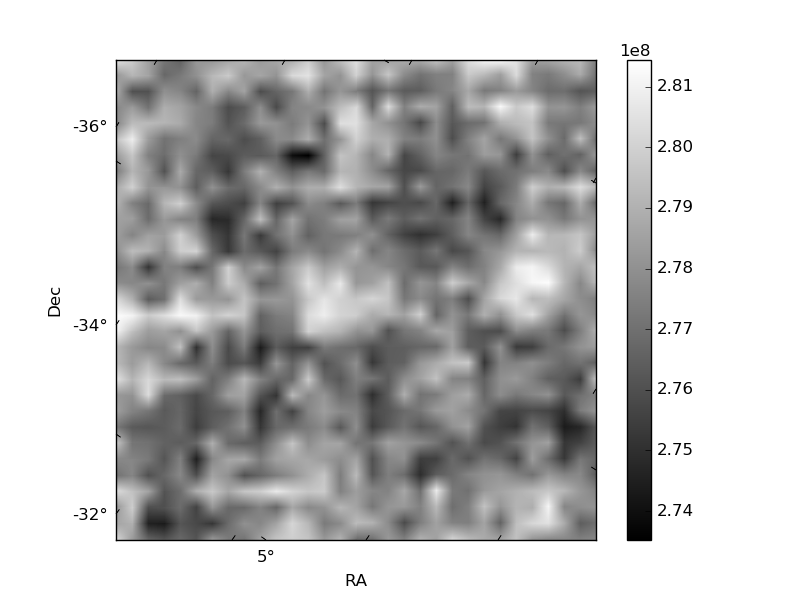
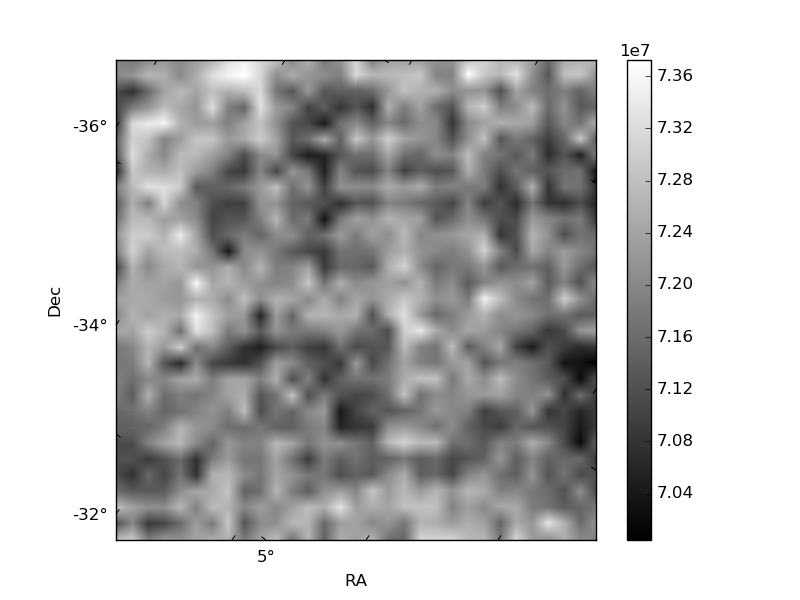
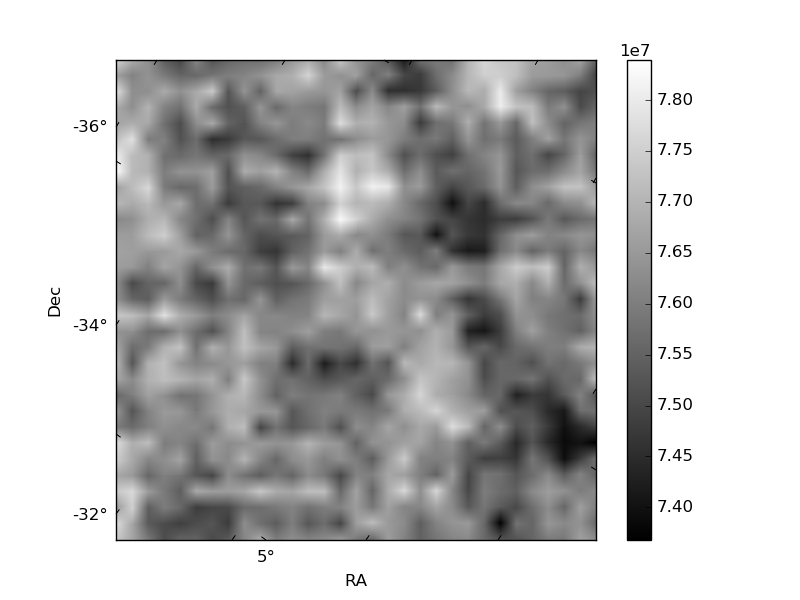
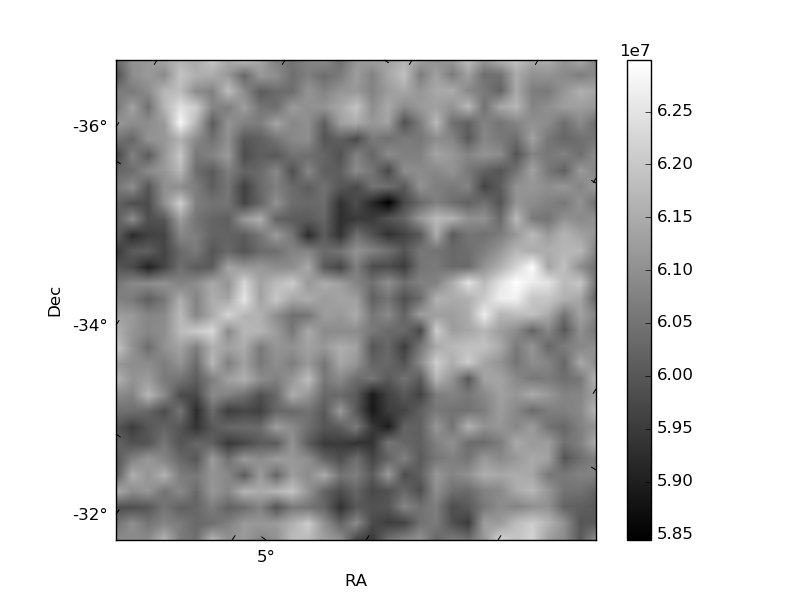
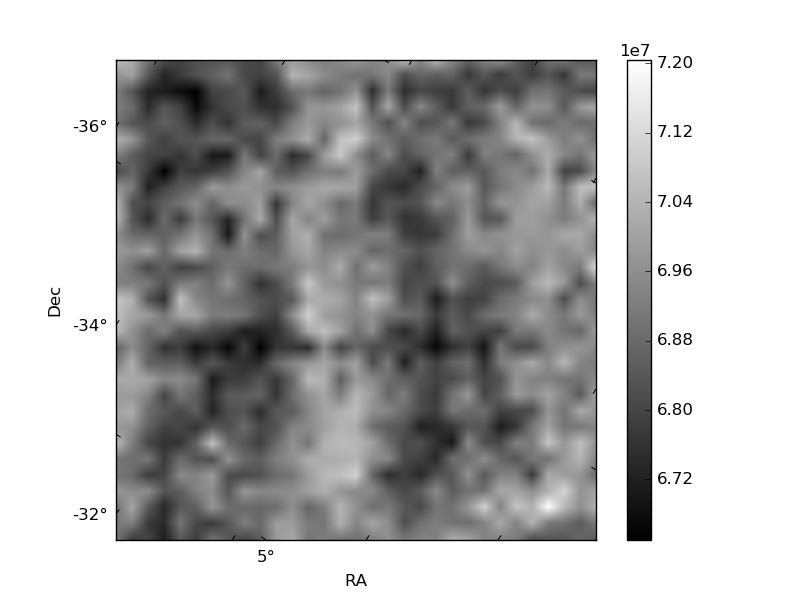
Histogram calculated using DETX and DETY for each event in the final _common_clean file
| Quadrant A | 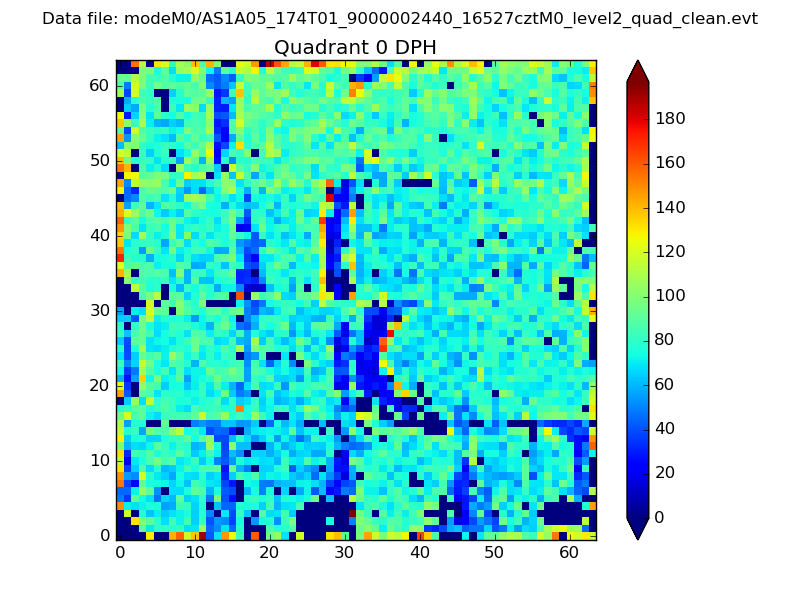 |
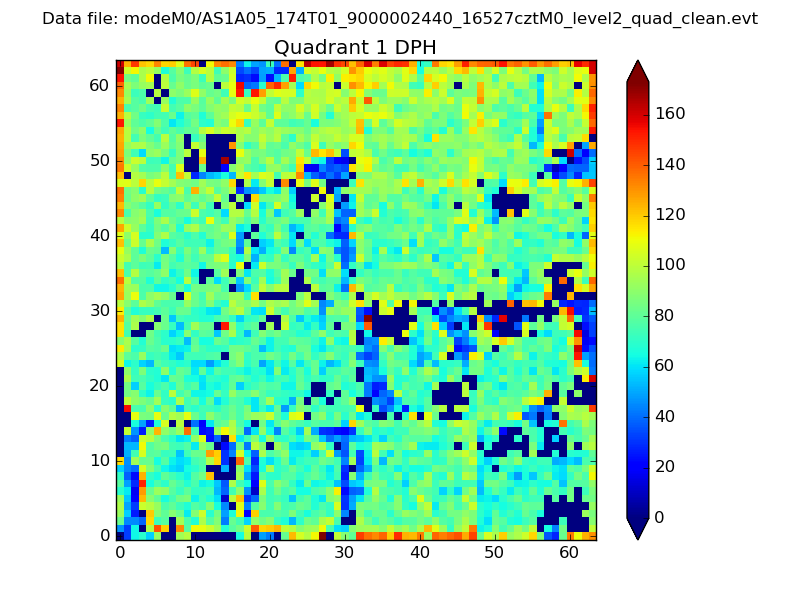 |
Quadrant B |
|---|---|---|---|
| Quadrant D | 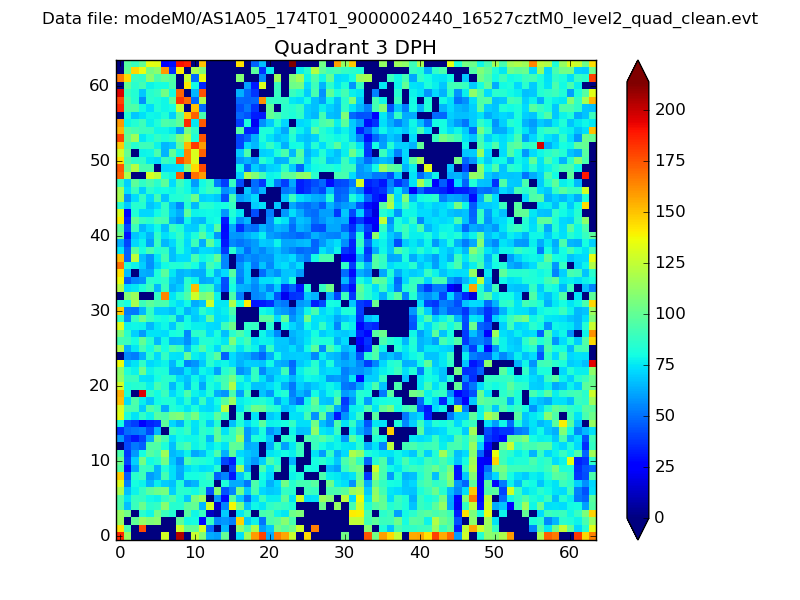 |
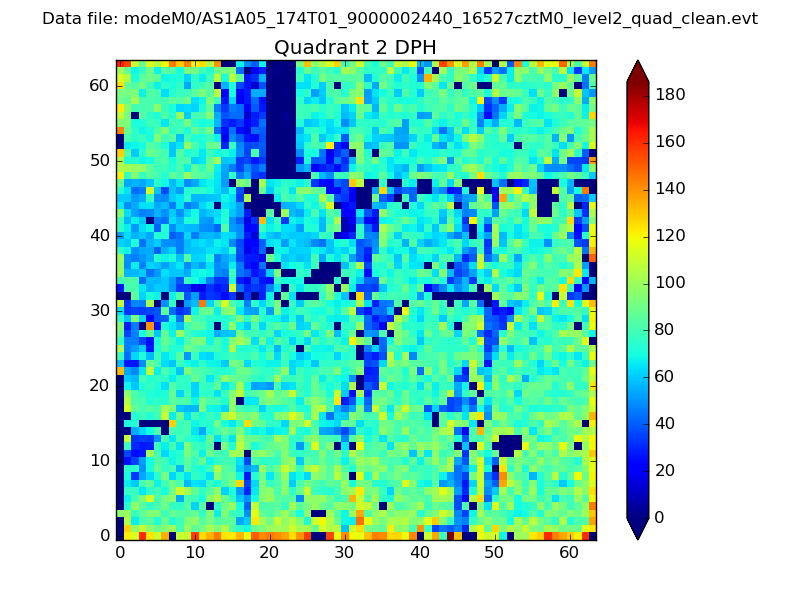 |
Quadrant C |
| Plot type | Count rate plots | Images |
|---|---|---|
| Comparison with Poisson distribution Blue bars denote a histogram of data divided into 1 sec bins. Red curve is a Poisson curve with rate = median count rate of data. |
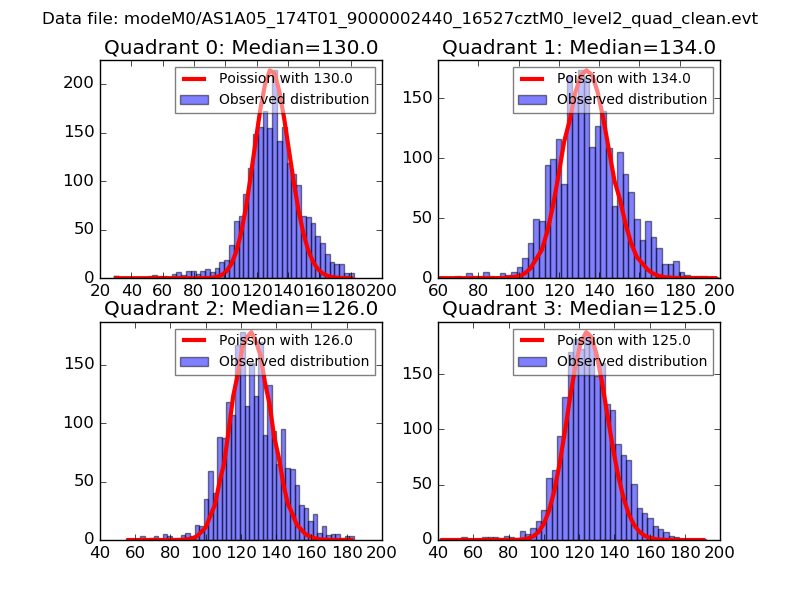 |
 |
| Quadrant-wise count rates Data is divided into 100 sec bins |
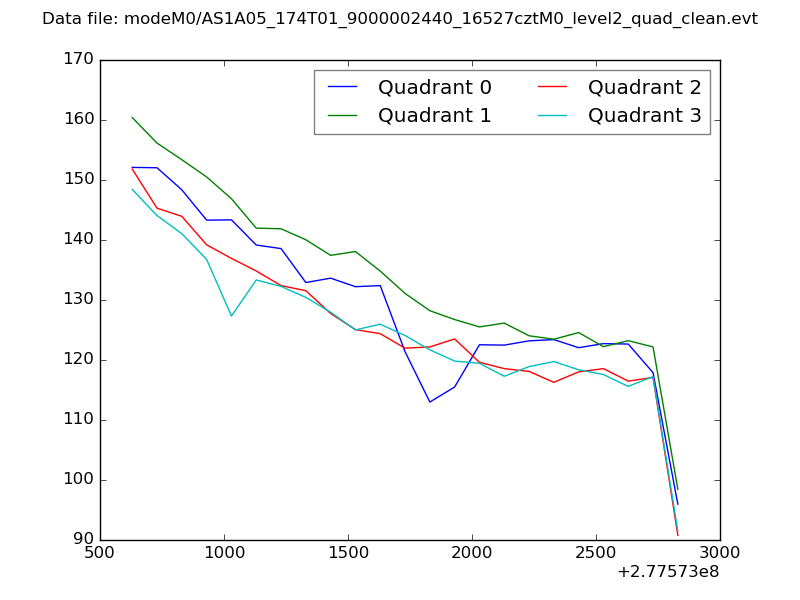 |
|
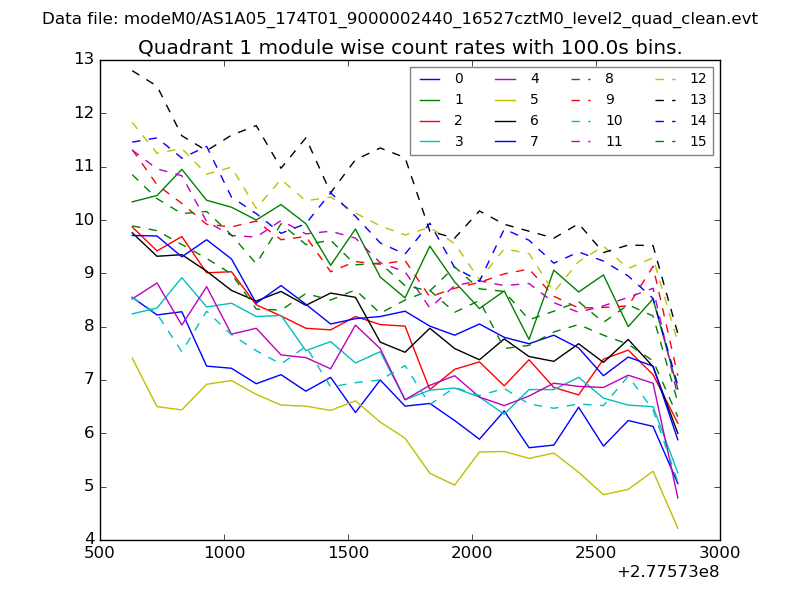
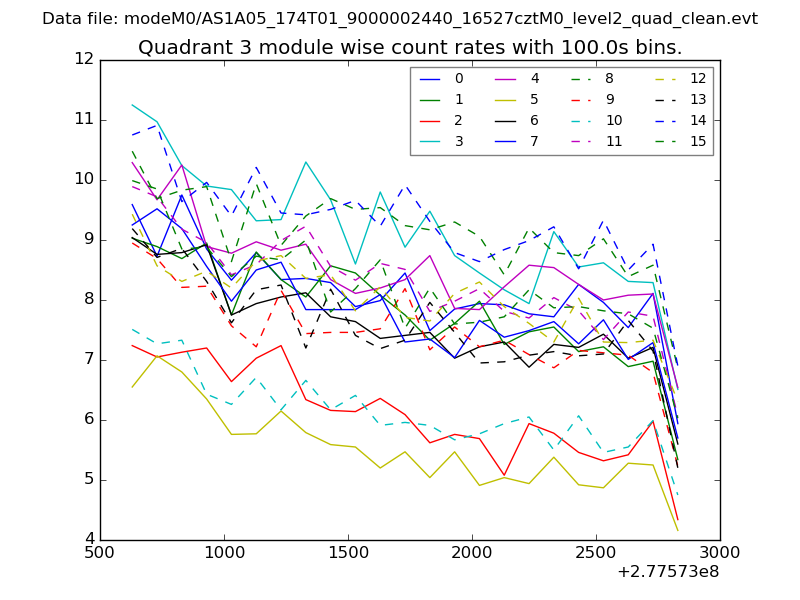
| Module-wise count rates for Quadrant A Data is divided into 100 sec bins |
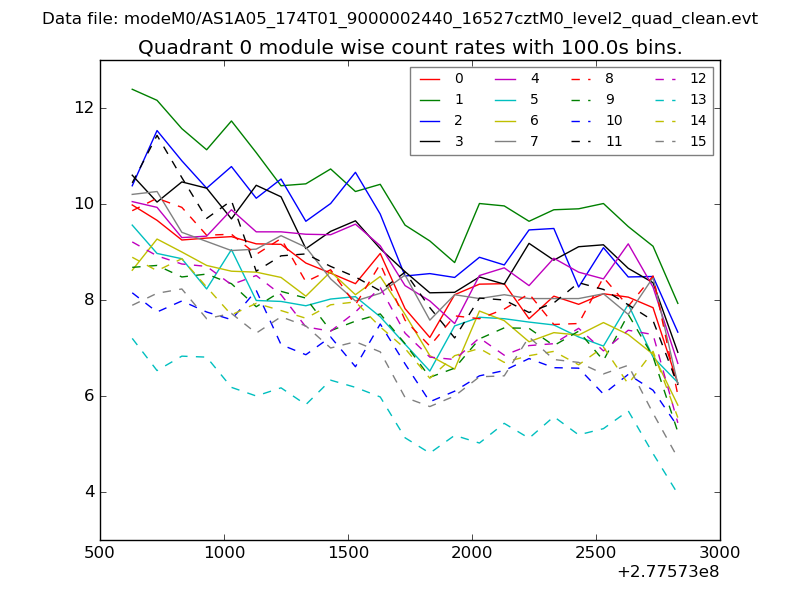 |
 |
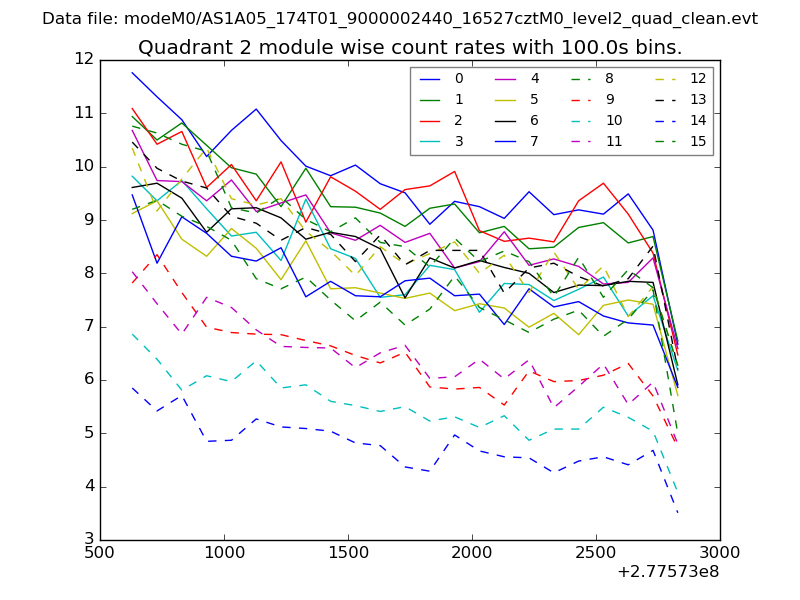
| Module-wise count rates for Quadrant B Data is divided into 100 sec bins |
 |
 |
| Module-wise count rates for Quadrant C Data is divided into 100 sec bins |
 |
 |
| Module-wise count rates for Quadrant D Data is divided into 100 sec bins |
 |
 |
| Parameter | Plot |
|---|---|
| CZT HV Monitor | 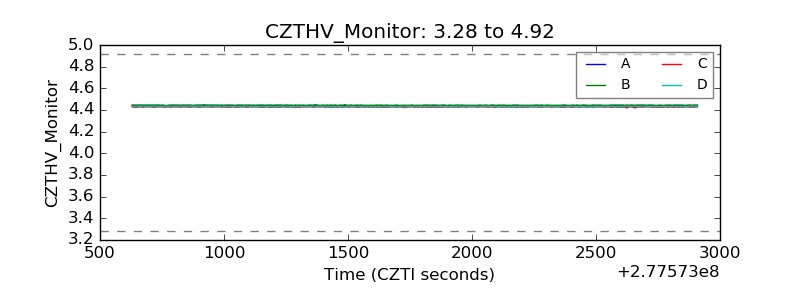 |
| D_VDD |  |
| Temperature 1 | 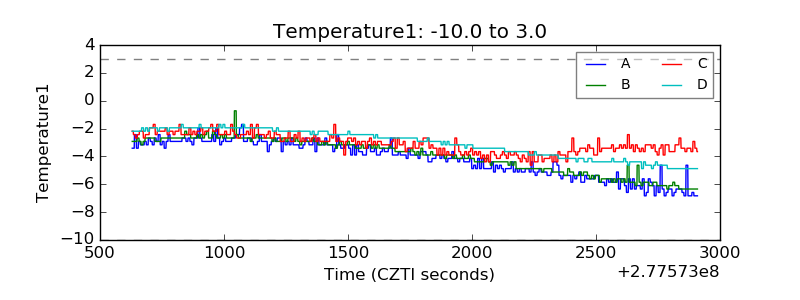 |
| Veto HV Monitor |  |
| Veto LLD | 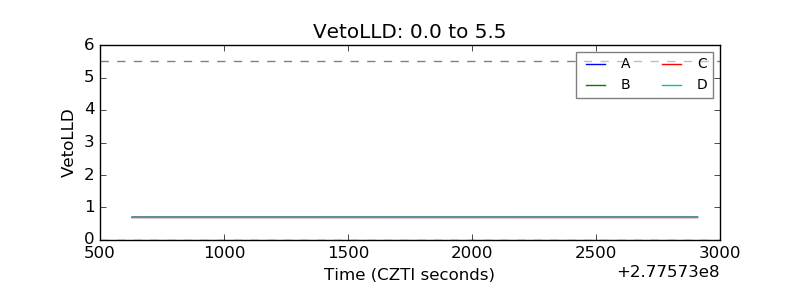 |
| Alpha Counter | 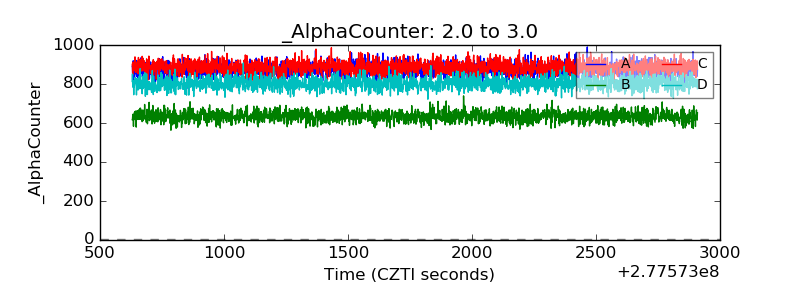 |
| _CPM_Rate | 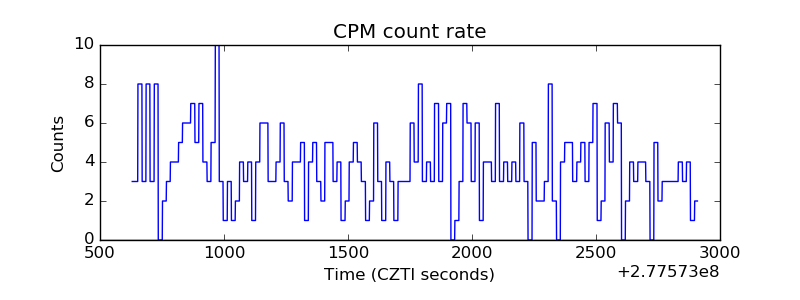 |
| CZT Counter | 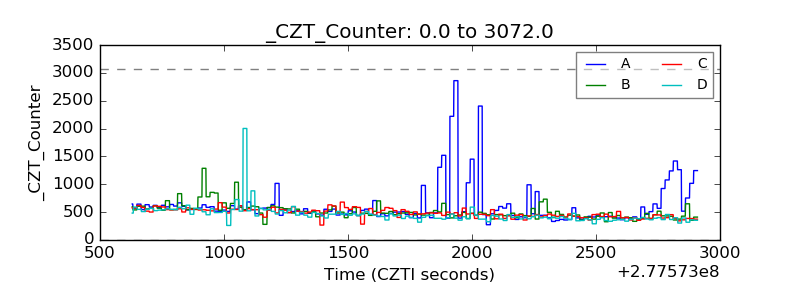 |
| +2.5 Volts monitor |  |
| +5 Volts monitor |  |
| _ROLL_ROT | 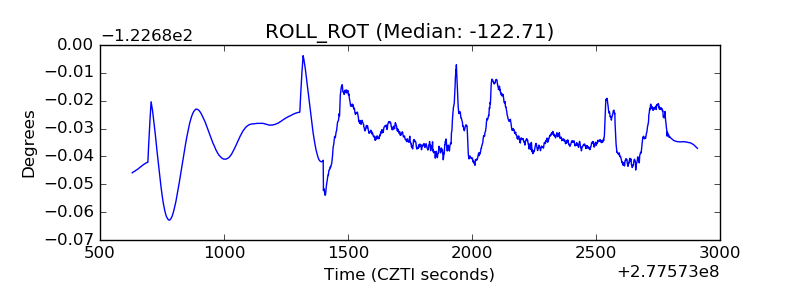 |
| _Roll_DEC | 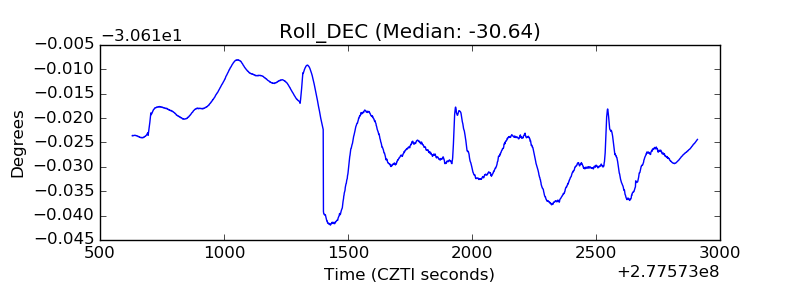 |
| _Roll_RA | 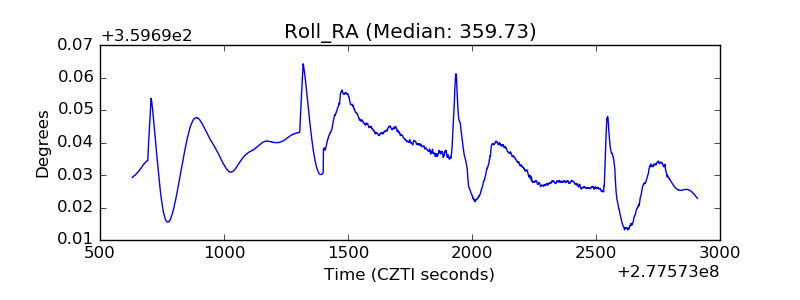 |
| Veto Counter | 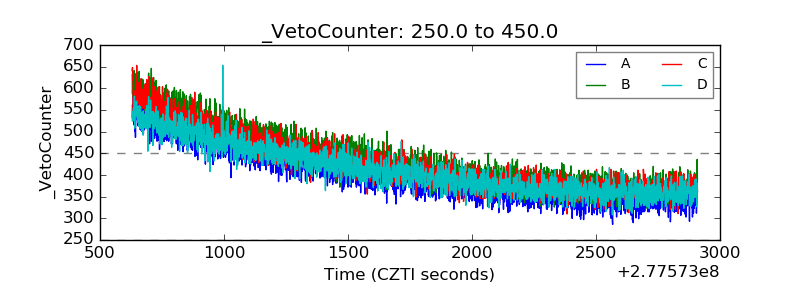 |