| Param | Original file | Final file |
|---|---|---|
| Filename | modeM0/AS1T03_018T01_9000002442cztM0_level2.fits | modeM0/AS1T03_018T01_9000002442cztM0_level2_quad_clean.evt |
| Size (bytes) | 2,136,490,560 | 1,818,380,160 |
| Size | 2.0 GB | 1.7 GB |
| Events in quadrant A | 13,058,422 | 10,288,800 |
| Events in quadrant B | 12,593,096 | 10,467,635 |
| Events in quadrant C | 12,699,764 | 9,903,212 |
| Events in quadrant D | 10,962,738 | 9,027,547 |
| Mode M0 | |||
|---|---|---|---|
| Quadrant | BADHDUFLAG | Total packets | Discarded packets |
| A | 0 | 499563 | 0 |
| B | 0 | 515623 | 0 |
| C | 0 | 575712 | 0 |
| D | 0 | 541544 | 0 |
| Mode M9 | |||
|---|---|---|---|
| Quadrant | BADHDUFLAG | Total packets | Discarded packets |
| A | 0 | 366 | 0 |
| B | 0 | 366 | 0 |
| C | 0 | 366 | 0 |
| D | 0 | 366 | 0 |
| Mode SS | |||
|---|---|---|---|
| Quadrant | BADHDUFLAG | Total packets | Discarded packets |
| A | 0 | 4582 | 0 |
| B | 0 | 4582 | 0 |
| C | 0 | 4582 | 0 |
| D | 0 | 4582 | 0 |
| Quadrant | Total seconds | Saturated seconds | Saturation percentage |
|---|---|---|---|
| A | 224524 | 5641 | 2.512426% |
| B | 224524 | 4834 | 2.152999% |
| C | 224524 | 10274 | 4.575903% |
| D | 224524 | 11777 | 5.245319% |
Noise dominated data is calculated using 1-second bins in cleaned event files. If a bin has >2000 counts, and if more than 50% of those come from <1% of pixels, then it is considered to be noise-dominated and hence unusable.
| Quadrant | # 1 sec bins | Bins with >0 counts | Bins with >2000 counts | High rate bins dominated by noise | Noise dominated (total time) | Noise dominated (detector-on time) | Marked lightcurve |
|---|---|---|---|---|---|---|---|
| A | 261369 | 224467 | 0 | 0 | 0.00% | 0.00% | 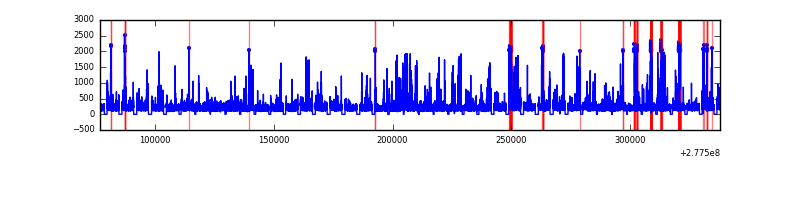 |
| B | 261369 | 224479 | 0 | 0 | 0.00% | 0.00% |  |
| C | 261369 | 224499 | 0 | 0 | 0.00% | 0.00% |  |
| D | 261368 | 222953 | 0 | 0 | 0.00% | 0.00% |  |
Top three noisy pixels from each quadrant. If the there are fewer than three noisy pixels in the level2.evt file, extra rows are filled as -1
| Pixel properties | Quadrant properties | ||||||
|---|---|---|---|---|---|---|---|
| Quadrant | DetID | PixID | Counts | Sigma | Mean | Median | Sigma |
| A | 0 | 29 | 12357 | 10.96 | 3395 | 3174 | 837.5 |
| A | 7 | 110 | 10643 | 8.92 | 3395 | 3174 | 837.5 |
| A | 0 | 30 | 9982 | 8.13 | 3395 | 3174 | 837.5 |
| B | 2 | 9 | 10349 | 11.11 | 3337 | 3181 | 645.2 |
| B | 2 | 8 | 8765 | 8.65 | 3337 | 3181 | 645.2 |
| B | 5 | 128 | 8356 | 8.02 | 3337 | 3181 | 645.2 |
| C | 12 | 241 | 8975 | 6.77 | 3355 | 3116 | 865.0 |
| C | 2 | 191 | 8674 | 6.43 | 3355 | 3116 | 865.0 |
| C | 9 | 233 | 8429 | 6.14 | 3355 | 3116 | 865.0 |
| D | 6 | 231 | 8112 | 6.28 | 3124 | 2834 | 840.7 |
| D | 3 | 14 | 8025 | 6.17 | 3124 | 2834 | 840.7 |
| D | 10 | 189 | 7731 | 5.83 | 3124 | 2834 | 840.7 |
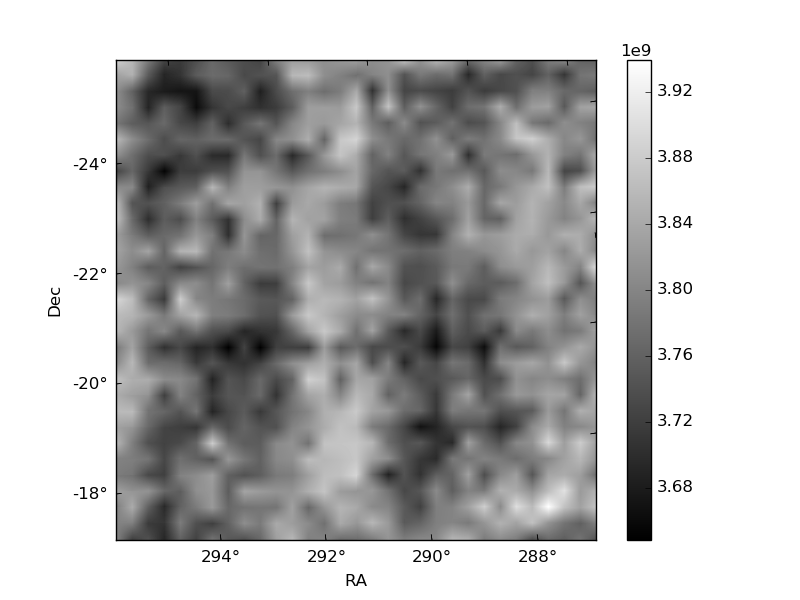
Histogram calculated using DETX and DETY for each event in the final _common_clean file
| Quadrant A | 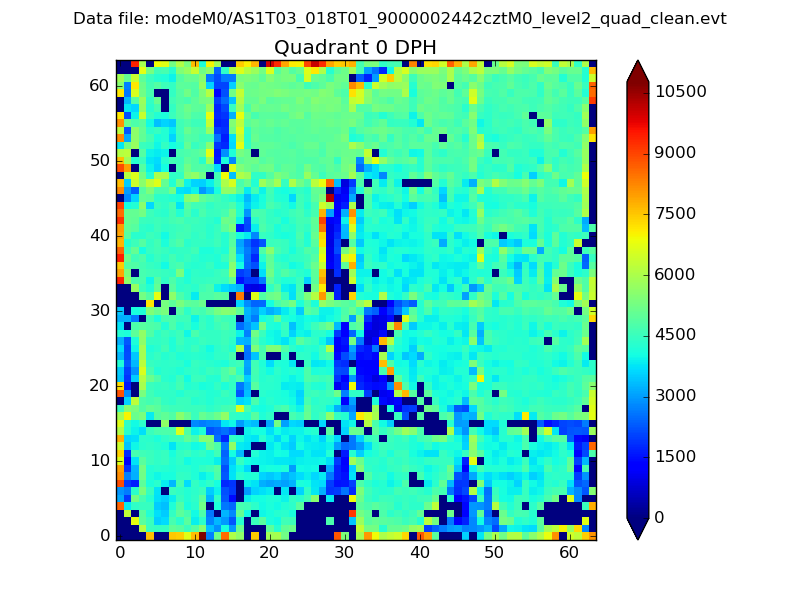 |
 |
Quadrant B |
|---|---|---|---|
| Quadrant D |  |
 |
Quadrant C |
| Plot type | Count rate plots | Images |
|---|---|---|
| Comparison with Poisson distribution Blue bars denote a histogram of data divided into 1 sec bins. Red curve is a Poisson curve with rate = median count rate of data. |
 |
 |
| Quadrant-wise count rates Data is divided into 100 sec bins |
 |
|
| Module-wise count rates for Quadrant A Data is divided into 100 sec bins |
 |
 |
| Module-wise count rates for Quadrant B Data is divided into 100 sec bins |
 |
 |
| Module-wise count rates for Quadrant C Data is divided into 100 sec bins |
 |
 |
| Module-wise count rates for Quadrant D Data is divided into 100 sec bins |
 |
 |
| Parameter | Plot |
|---|---|
| CZT HV Monitor |  |
| D_VDD |  |
| Temperature 1 |  |
| Veto HV Monitor |  |
| Veto LLD |  |
| Alpha Counter |  |
| _CPM_Rate | 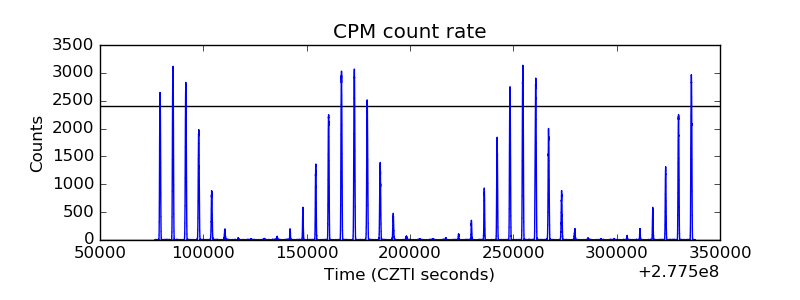 |
| CZT Counter | 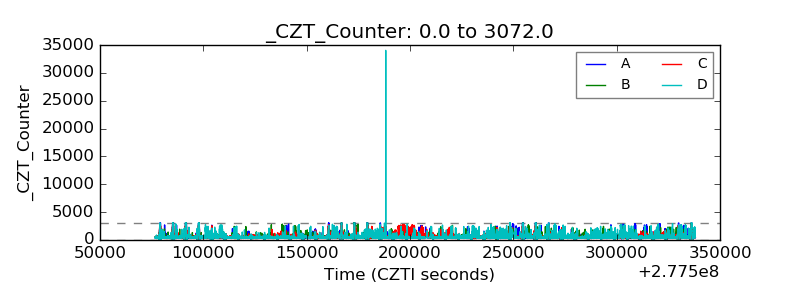 |
| +2.5 Volts monitor |  |
| +5 Volts monitor |  |
| _ROLL_ROT | 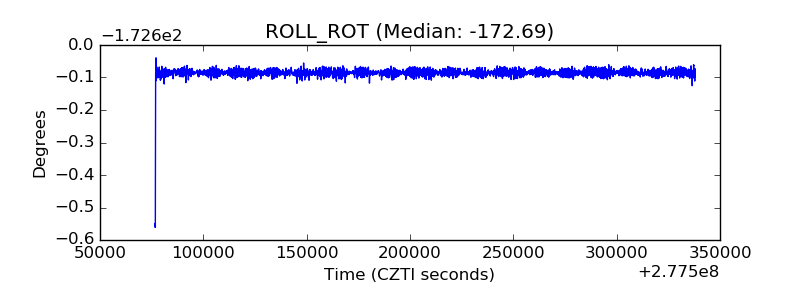 |
| _Roll_DEC |  |
| _Roll_RA | 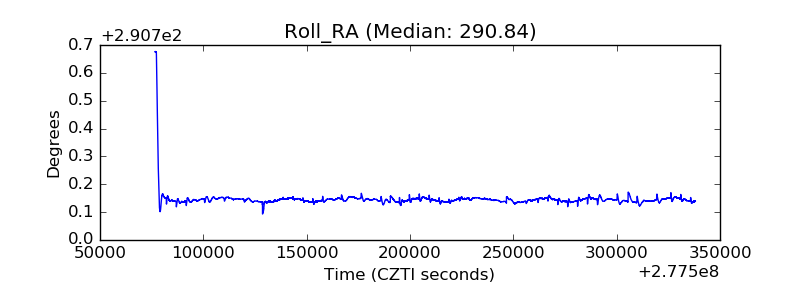 |
| Veto Counter |  |