| Param | Original file | Final file |
|---|---|---|
| Filename | modeM0/AS1T03_018T01_9000002442_16527cztM0_level2.evt | modeM0/AS1T03_018T01_9000002442_16527cztM0_level2_quad_clean.evt |
| Size (bytes) | 235,825,920 | 41,702,400 |
| Size | 224.9 MB | 39.8 MB |
| Events in quadrant A | 1,658,159 | 261,111 |
| Events in quadrant B | 1,882,698 | 268,955 |
| Events in quadrant C | 1,726,902 | 258,864 |
| Events in quadrant D | 1,655,825 | 246,667 |
| Mode M0 | |||
|---|---|---|---|
| Quadrant | BADHDUFLAG | Total packets | Discarded packets |
| A | 0 | 6829 | 2 |
| B | 0 | 7537 | 1 |
| C | 0 | 6985 | 1 |
| D | 0 | 6945 | 1 |
| Mode M9 | |||
|---|---|---|---|
| Quadrant | BADHDUFLAG | Total packets | Discarded packets |
| A | 0 | 11 | 0 |
| B | 0 | 11 | 0 |
| C | 0 | 11 | 0 |
| D | 0 | 11 | 0 |
| Mode SS | |||
|---|---|---|---|
| Quadrant | BADHDUFLAG | Total packets | Discarded packets |
| A | 0 | 68 | 0 |
| B | 0 | 68 | 0 |
| C | 0 | 68 | 0 |
| D | 0 | 68 | 0 |
| Quadrant | Total seconds | Saturated seconds | Saturation percentage |
|---|---|---|---|
| A | 3183 | 44 | 1.382344% |
| B | 3183 | 65 | 2.042099% |
| C | 3183 | 63 | 1.979265% |
| D | 3183 | 31 | 0.973924% |
Noise dominated data is calculated using 1-second bins in cleaned event files. If a bin has >2000 counts, and if more than 50% of those come from <1% of pixels, then it is considered to be noise-dominated and hence unusable.
| Quadrant | # 1 sec bins | Bins with >0 counts | Bins with >2000 counts | High rate bins dominated by noise | Noise dominated (total time) | Noise dominated (detector-on time) | Marked lightcurve |
|---|---|---|---|---|---|---|---|
| A | 4334 | 3184 | 0 | 0 | 0.00% | 0.00% | 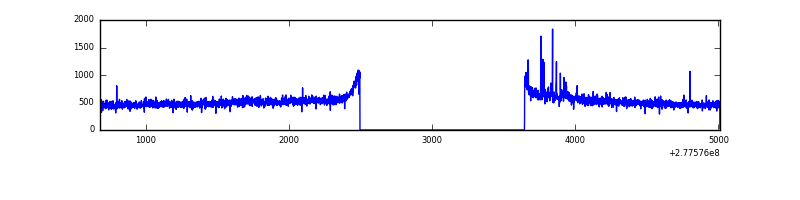 |
| B | 4334 | 3184 | 1 | 1 | 0.02% | 0.03% | 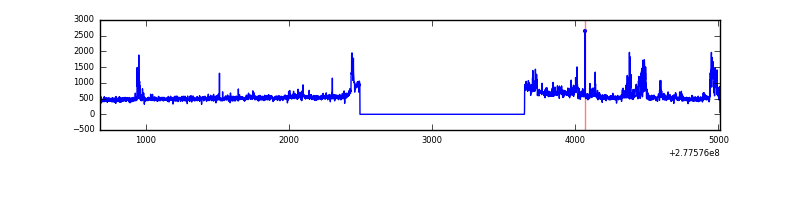 |
| C | 4334 | 3184 | 0 | 0 | 0.00% | 0.00% | 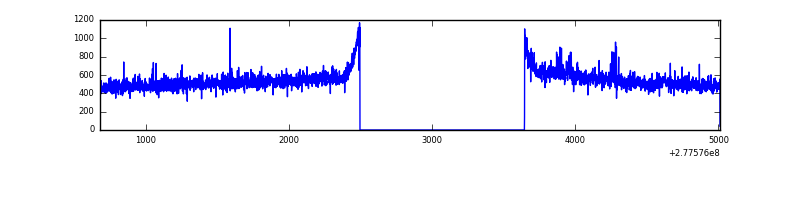 |
| D | 4334 | 3185 | 16 | 16 | 0.37% | 0.50% |  |
Top three noisy pixels from each quadrant. If the there are fewer than three noisy pixels in the level2.evt file, extra rows are filled as -1
| Pixel properties | Quadrant properties | ||||||
|---|---|---|---|---|---|---|---|
| Quadrant | DetID | PixID | Counts | Sigma | Mean | Median | Sigma |
| A | 15 | 174 | 26722 | 303.55 | 421 | 412 | 86.7 |
| A | 15 | 223 | 7400 | 80.62 | 421 | 412 | 86.7 |
| A | 0 | 226 | 3747 | 38.48 | 421 | 412 | 86.7 |
| B | 15 | 35 | 111950 | 1346.92 | 425 | 415 | 82.8 |
| B | 4 | 216 | 24054 | 285.47 | 425 | 415 | 82.8 |
| B | 10 | 16 | 21407 | 253.5 | 425 | 415 | 82.8 |
| C | 14 | 238 | 63655 | 662.9 | 404 | 408 | 95.4 |
| C | 3 | 233 | 59006 | 614.17 | 404 | 408 | 95.4 |
| C | 7 | 247 | 25274 | 260.62 | 404 | 408 | 95.4 |
| D | 7 | 38 | 64583 | 639.27 | 405 | 393 | 100.4 |
| D | 1 | 52 | 25641 | 251.45 | 405 | 393 | 100.4 |
| D | 2 | 234 | 12689 | 122.46 | 405 | 393 | 100.4 |
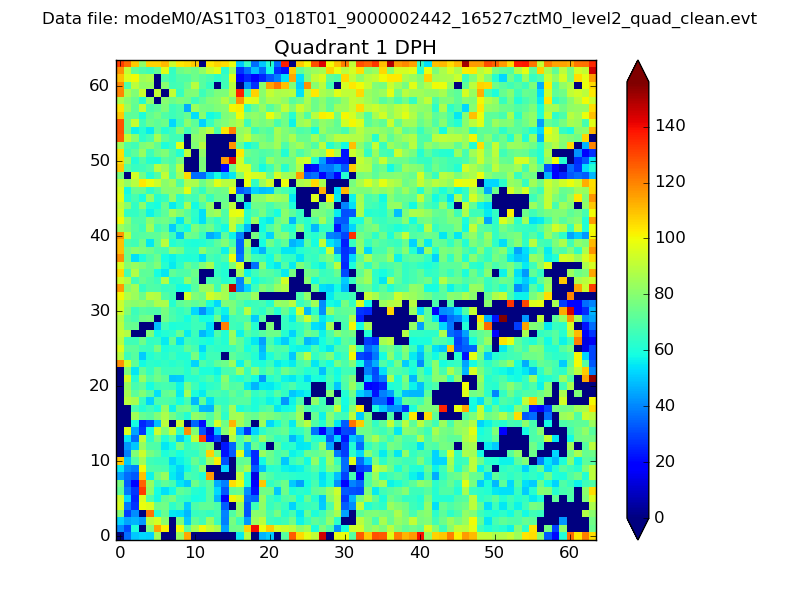
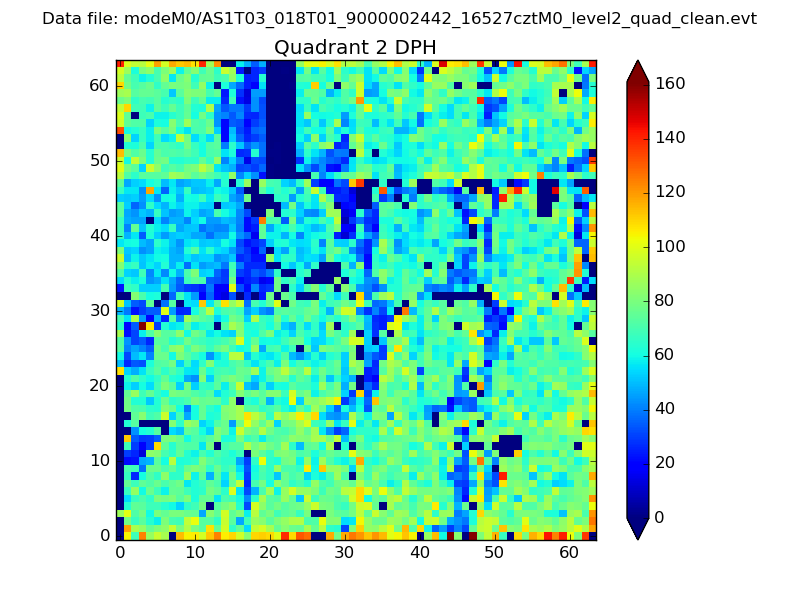
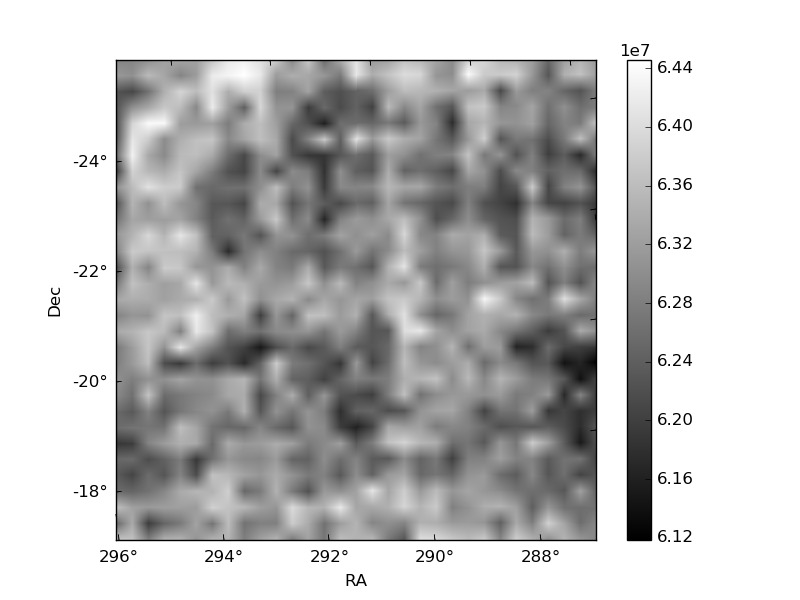
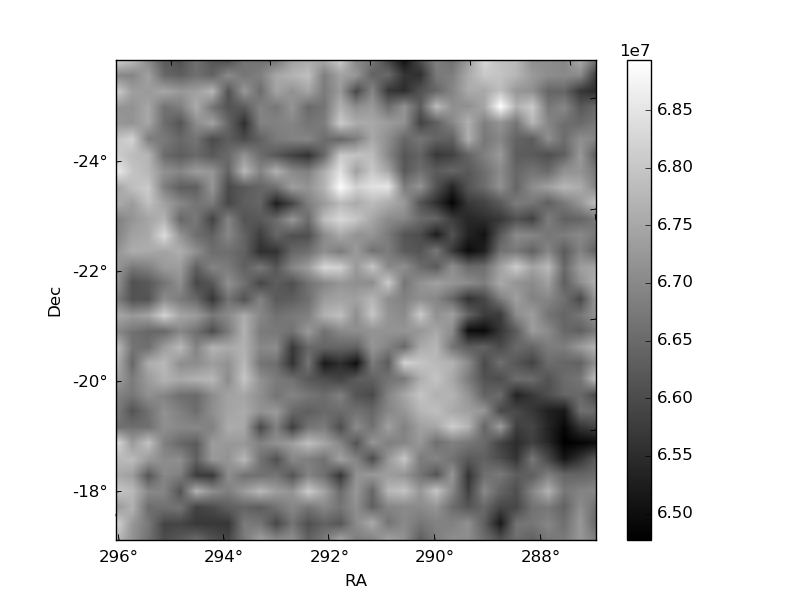
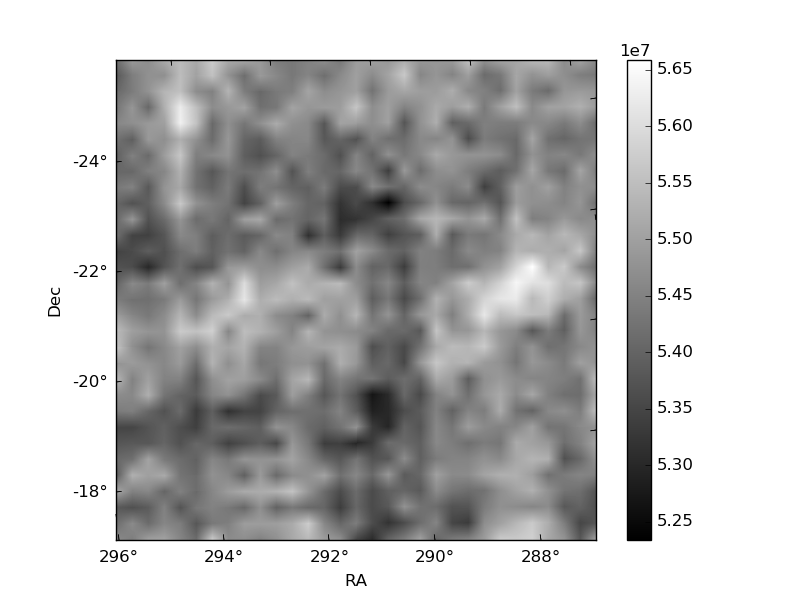
Histogram calculated using DETX and DETY for each event in the final _common_clean file
| Quadrant A | 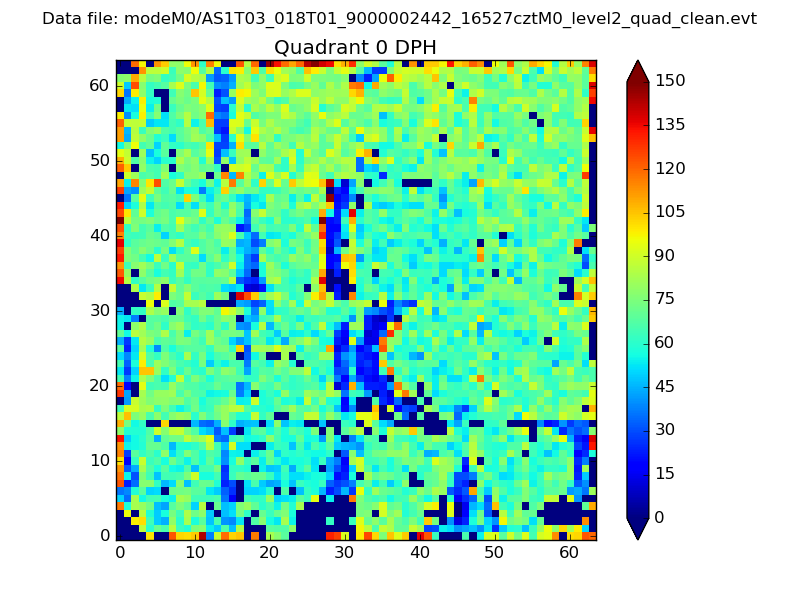 |
 |
Quadrant B |
|---|---|---|---|
| Quadrant D | 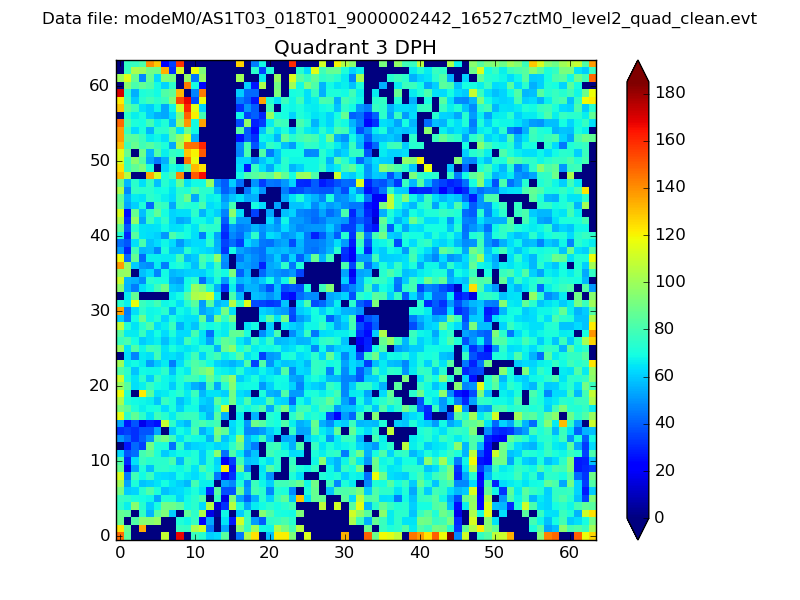 |
 |
Quadrant C |
| Plot type | Count rate plots | Images |
|---|---|---|
| Comparison with Poisson distribution Blue bars denote a histogram of data divided into 1 sec bins. Red curve is a Poisson curve with rate = median count rate of data. |
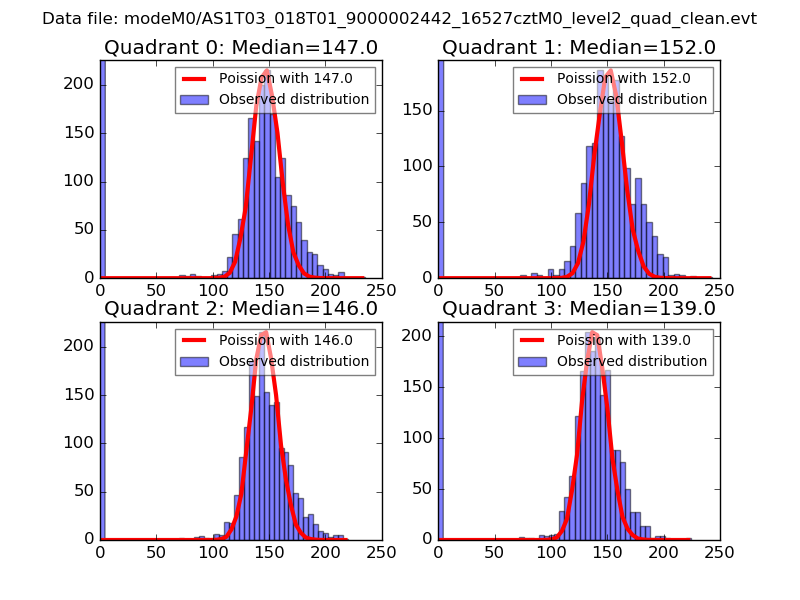 |
 |
| Quadrant-wise count rates Data is divided into 100 sec bins |
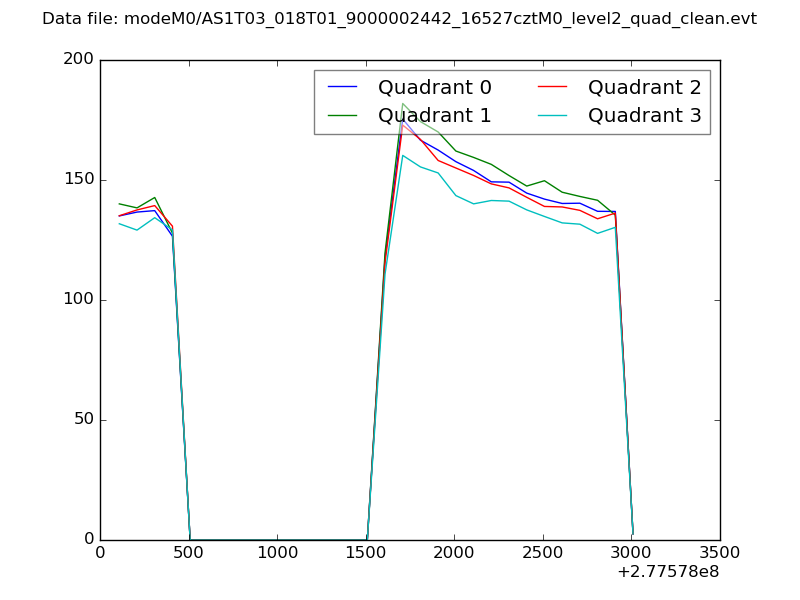 |
|
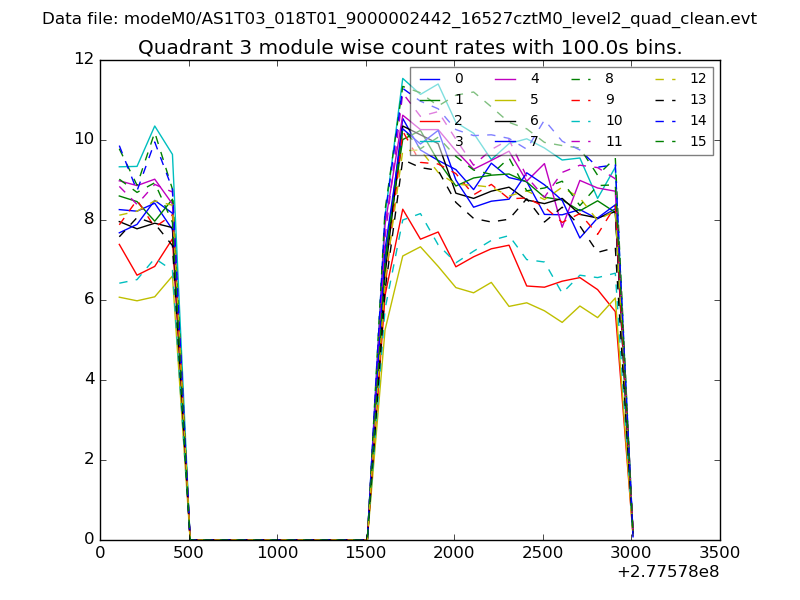
| Module-wise count rates for Quadrant A Data is divided into 100 sec bins |
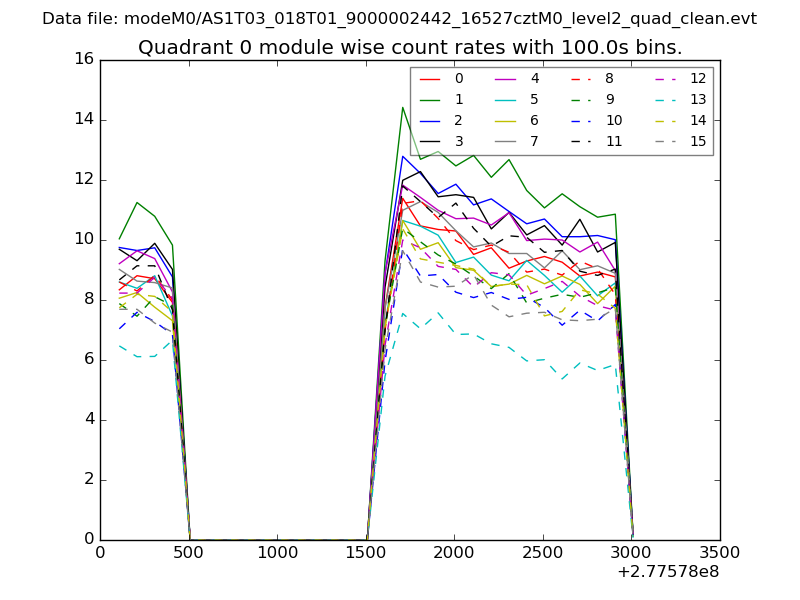 |
 |
| Module-wise count rates for Quadrant B Data is divided into 100 sec bins |
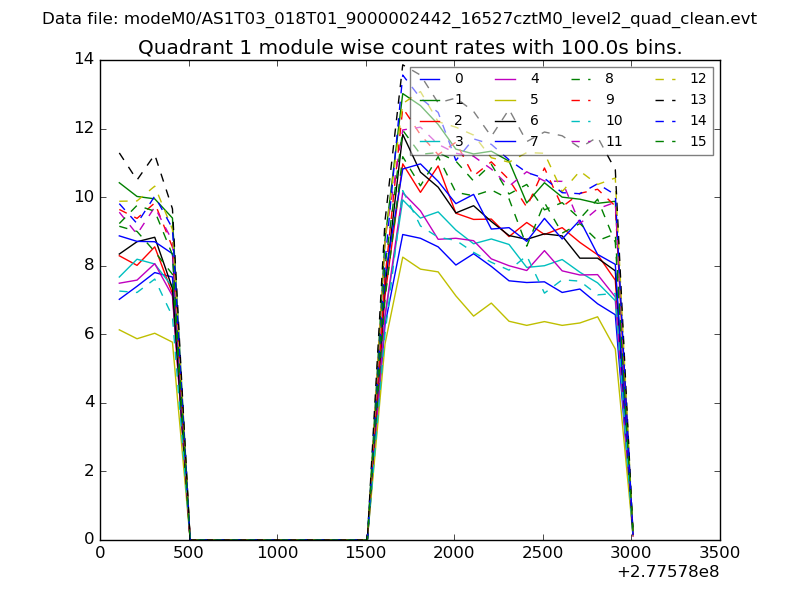 |
 |
| Module-wise count rates for Quadrant C Data is divided into 100 sec bins |
 |
 |
| Module-wise count rates for Quadrant D Data is divided into 100 sec bins |
 |
 |
| Parameter | Plot |
|---|---|
| CZT HV Monitor | 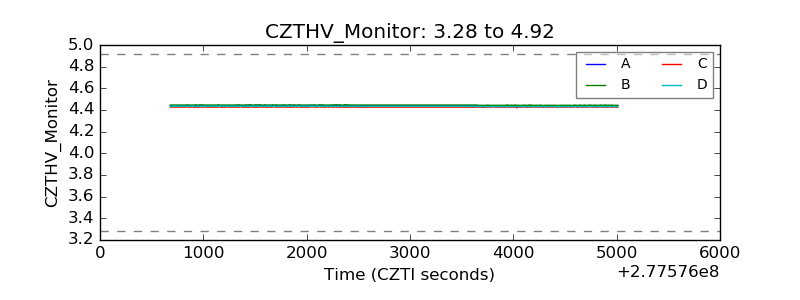 |
| D_VDD |  |
| Temperature 1 | 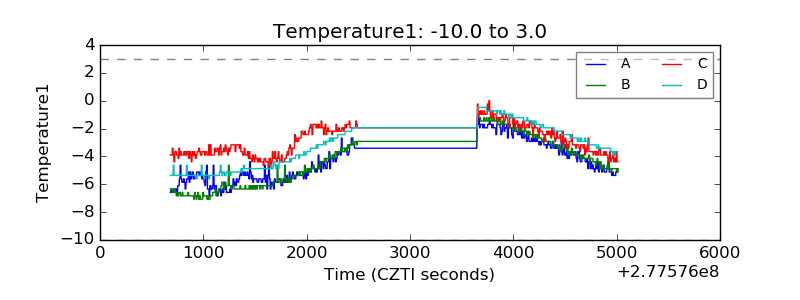 |
| Veto HV Monitor | 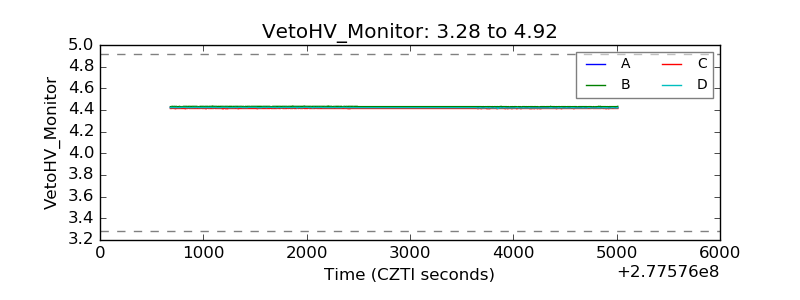 |
| Veto LLD | 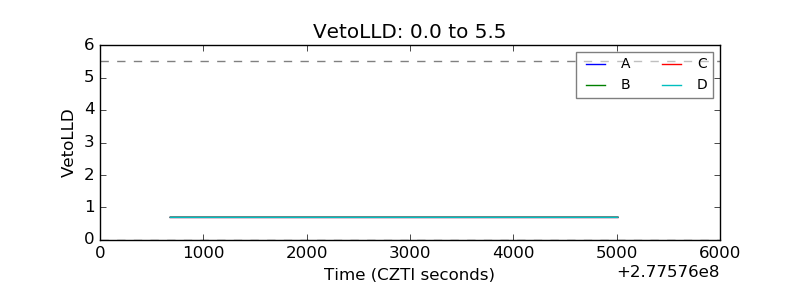 |
| Alpha Counter | 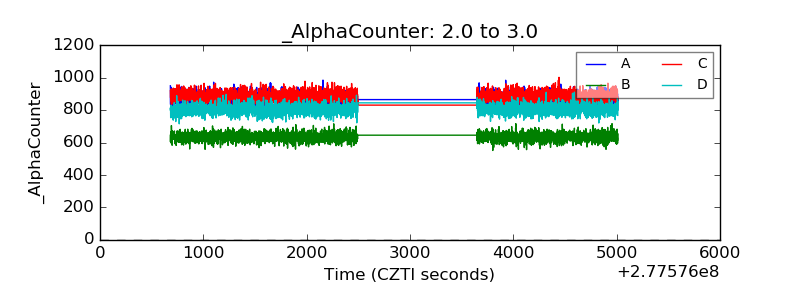 |
| _CPM_Rate | 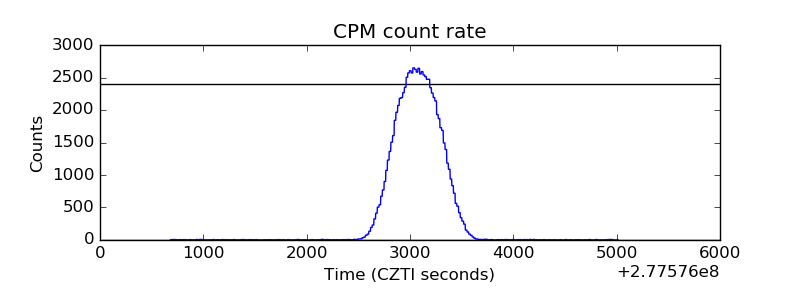 |
| CZT Counter | 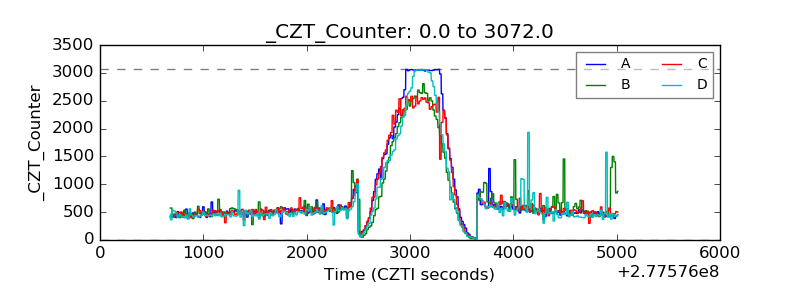 |
| +2.5 Volts monitor |  |
| +5 Volts monitor |  |
| _ROLL_ROT | 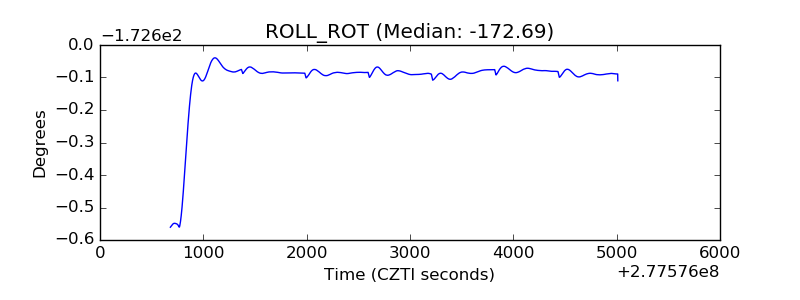 |
| _Roll_DEC | 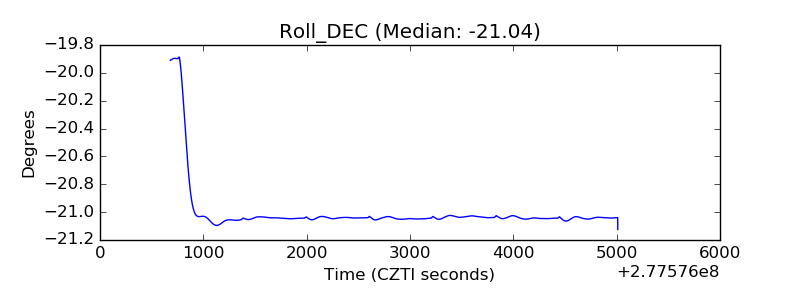 |
| _Roll_RA |  |
| Veto Counter | 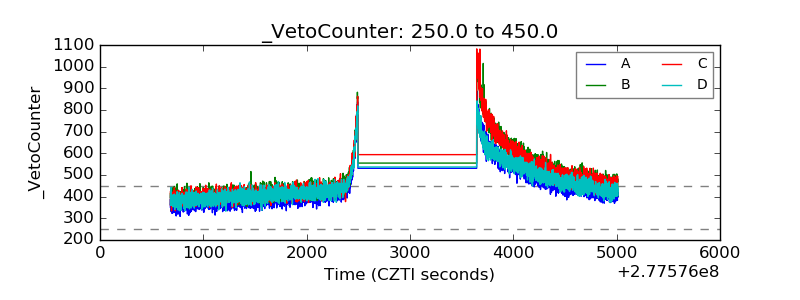 |