| Param | Original file | Final file |
|---|---|---|
| Filename | modeM0/AS1T03_018T01_9000002442_16528cztM0_level2.evt | modeM0/AS1T03_018T01_9000002442_16528cztM0_level2_quad_clean.evt |
| Size (bytes) | 465,206,400 | 89,075,520 |
| Size | 443.7 MB | 84.9 MB |
| Events in quadrant A | 3,410,199 | 571,564 |
| Events in quadrant B | 3,600,092 | 594,272 |
| Events in quadrant C | 3,335,303 | 569,335 |
| Events in quadrant D | 3,324,019 | 531,359 |
| Mode M0 | |||
|---|---|---|---|
| Quadrant | BADHDUFLAG | Total packets | Discarded packets |
| A | 0 | 13977 | 3 |
| B | 0 | 14557 | 2 |
| C | 0 | 13761 | 2 |
| D | 0 | 14035 | 2 |
| Mode M9 | |||
|---|---|---|---|
| Quadrant | BADHDUFLAG | Total packets | Discarded packets |
| A | 0 | 23 | 0 |
| B | 0 | 23 | 0 |
| C | 0 | 23 | 0 |
| D | 0 | 23 | 0 |
| Mode SS | |||
|---|---|---|---|
| Quadrant | BADHDUFLAG | Total packets | Discarded packets |
| A | 0 | 126 | 0 |
| B | 0 | 126 | 0 |
| C | 0 | 126 | 0 |
| D | 0 | 126 | 0 |
| Quadrant | Total seconds | Saturated seconds | Saturation percentage |
|---|---|---|---|
| A | 6170 | 85 | 1.377634% |
| B | 6170 | 58 | 0.940032% |
| C | 6170 | 62 | 1.004862% |
| D | 6170 | 152 | 2.463533% |
Noise dominated data is calculated using 1-second bins in cleaned event files. If a bin has >2000 counts, and if more than 50% of those come from <1% of pixels, then it is considered to be noise-dominated and hence unusable.
| Quadrant | # 1 sec bins | Bins with >0 counts | Bins with >2000 counts | High rate bins dominated by noise | Noise dominated (total time) | Noise dominated (detector-on time) | Marked lightcurve |
|---|---|---|---|---|---|---|---|
| A | 7451 | 6172 | 51 | 51 | 0.68% | 0.83% | 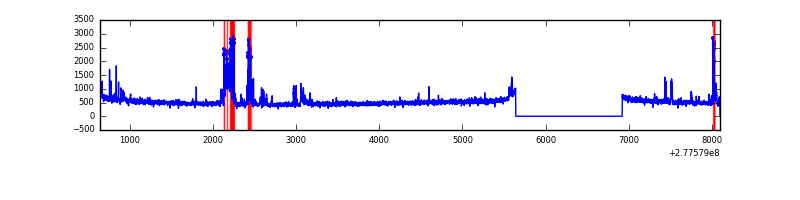 |
| B | 7451 | 6171 | 7 | 7 | 0.09% | 0.11% | 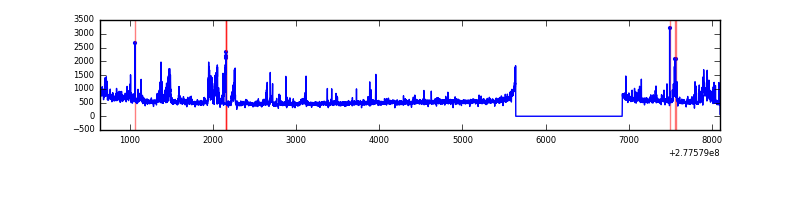 |
| C | 7451 | 6172 | 6 | 6 | 0.08% | 0.10% | 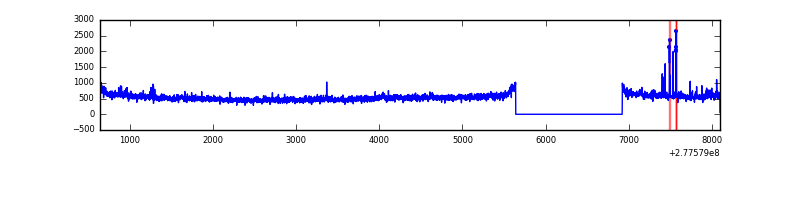 |
| D | 7451 | 6172 | 147 | 147 | 1.97% | 2.38% | 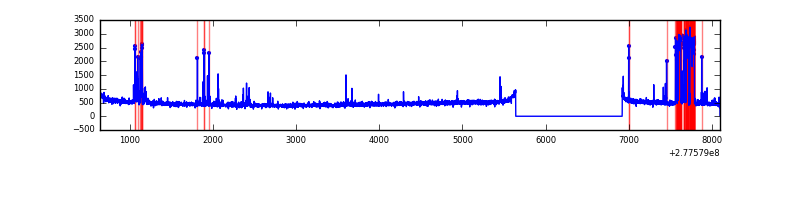 |
Top three noisy pixels from each quadrant. If the there are fewer than three noisy pixels in the level2.evt file, extra rows are filled as -1
| Pixel properties | Quadrant properties | ||||||
|---|---|---|---|---|---|---|---|
| Quadrant | DetID | PixID | Counts | Sigma | Mean | Median | Sigma |
| A | 15 | 174 | 383768 | 2446.34 | 780 | 765 | 156.6 |
| A | 15 | 223 | 17811 | 108.88 | 780 | 765 | 156.6 |
| A | 15 | 239 | 8964 | 52.37 | 780 | 765 | 156.6 |
| B | 15 | 35 | 233557 | 1560.35 | 792 | 776 | 149.2 |
| B | 0 | 168 | 41815 | 275.09 | 792 | 776 | 149.2 |
| B | 4 | 216 | 41203 | 270.98 | 792 | 776 | 149.2 |
| C | 3 | 233 | 249997 | 1423.72 | 752 | 758 | 175.1 |
| C | 14 | 238 | 117838 | 668.79 | 752 | 758 | 175.1 |
| C | 7 | 247 | 34926 | 195.18 | 752 | 758 | 175.1 |
| D | 1 | 52 | 372571 | 2035.14 | 744 | 723 | 182.7 |
| D | 7 | 38 | 65191 | 352.84 | 744 | 723 | 182.7 |
| D | 10 | 70 | 30537 | 163.17 | 744 | 723 | 182.7 |
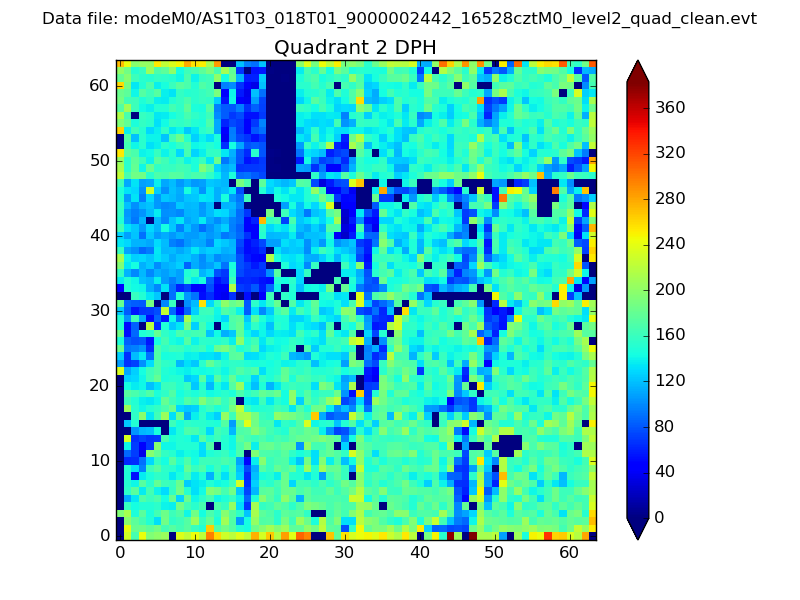
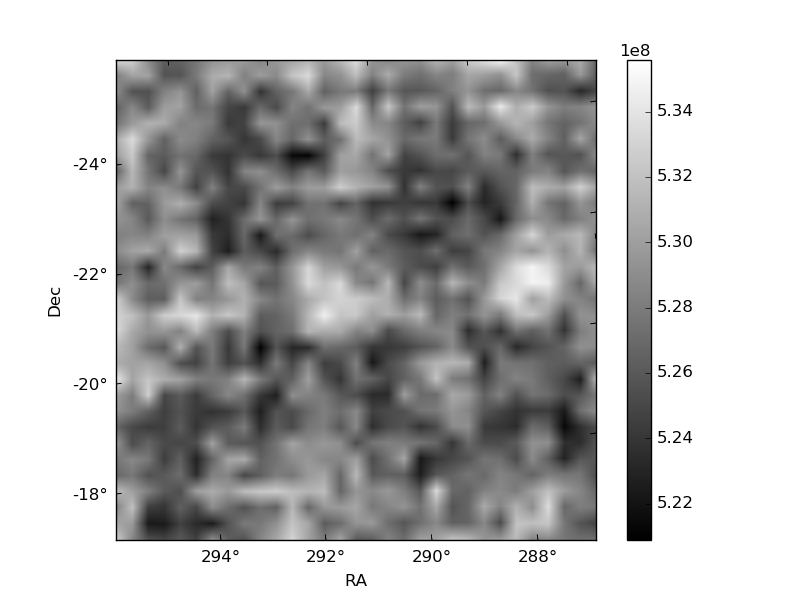
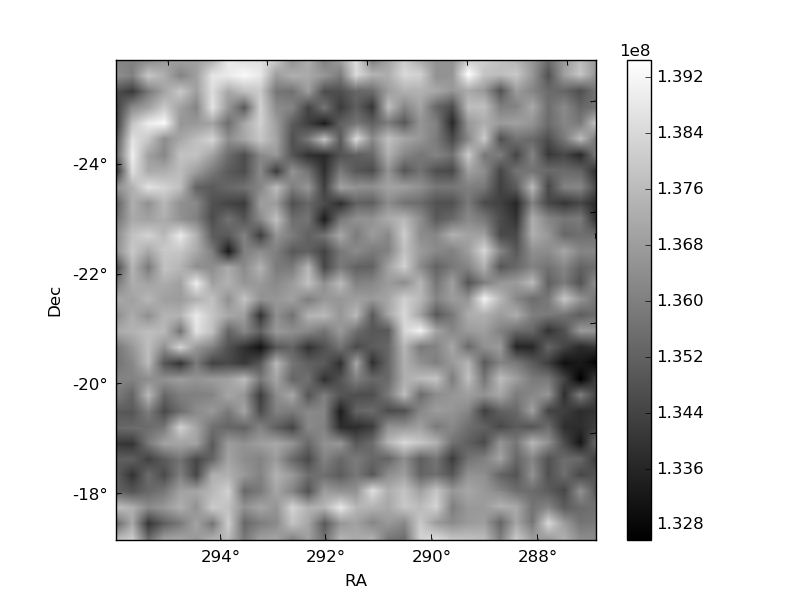
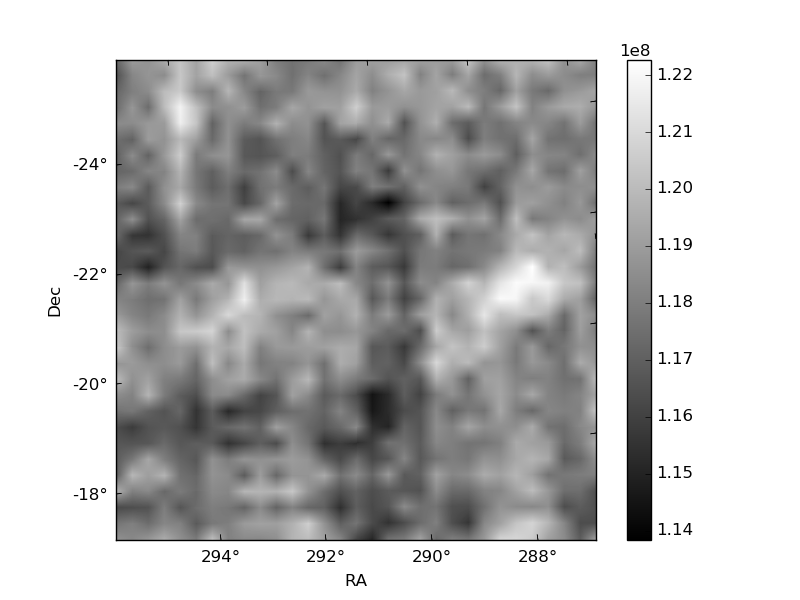
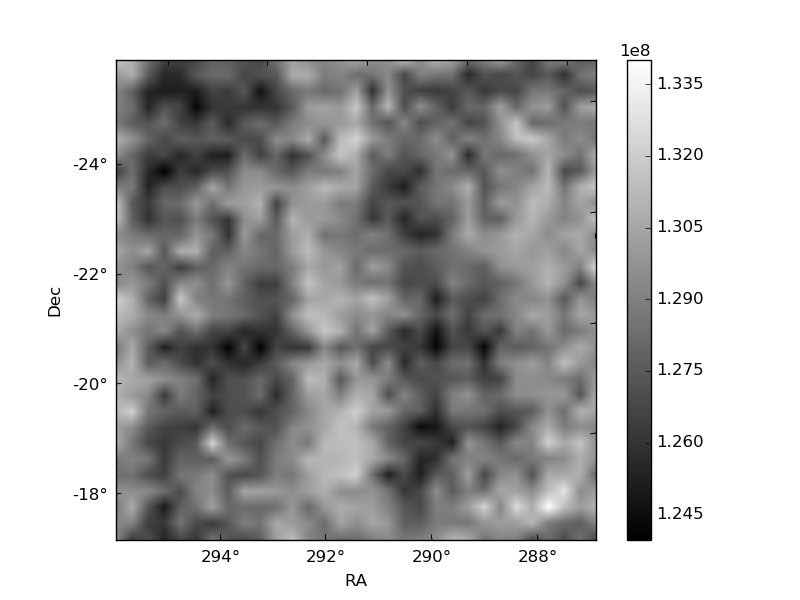
Histogram calculated using DETX and DETY for each event in the final _common_clean file
| Quadrant A | 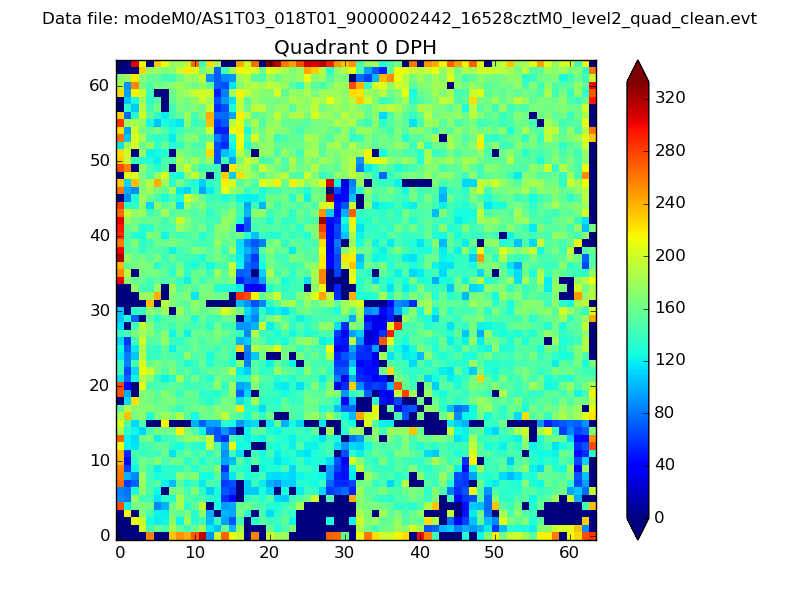 |
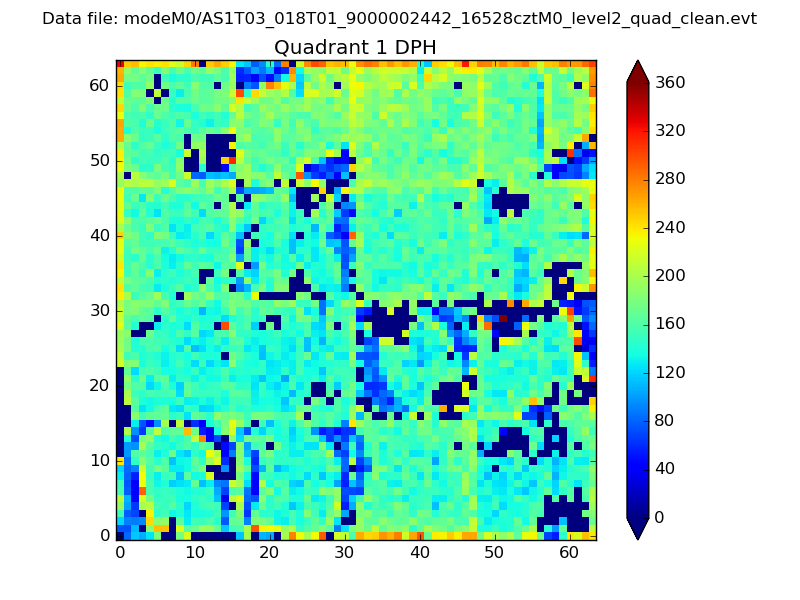 |
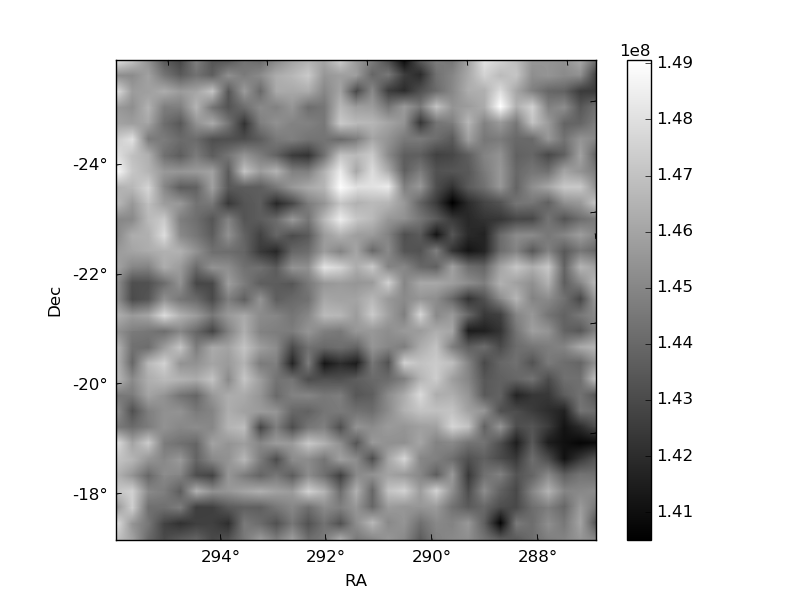
Quadrant B |
|---|---|---|---|
| Quadrant D | 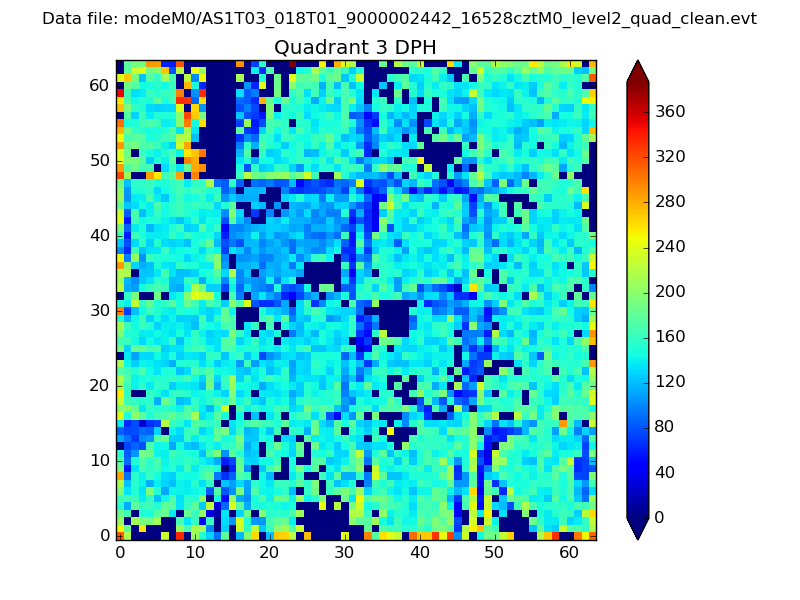 |
 |
Quadrant C |
| Plot type | Count rate plots | Images |
|---|---|---|
| Comparison with Poisson distribution Blue bars denote a histogram of data divided into 1 sec bins. Red curve is a Poisson curve with rate = median count rate of data. |
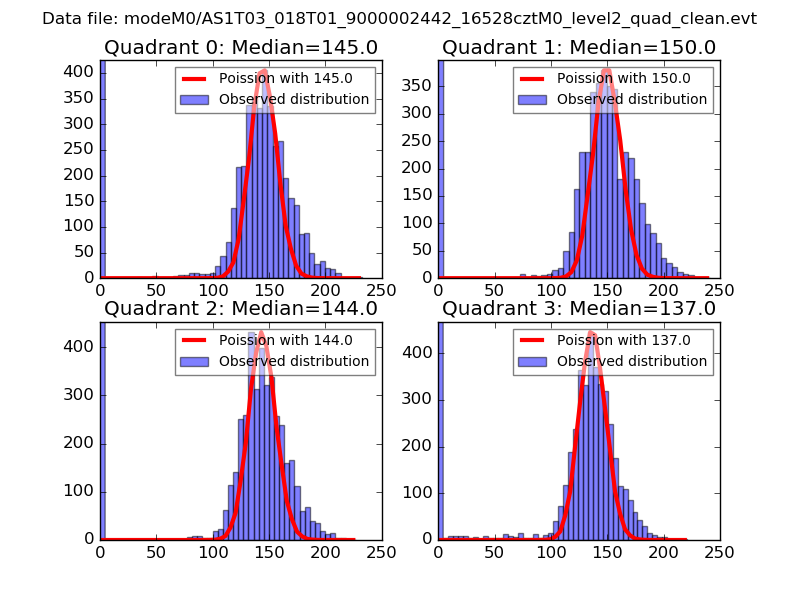 |
 |
| Quadrant-wise count rates Data is divided into 100 sec bins |
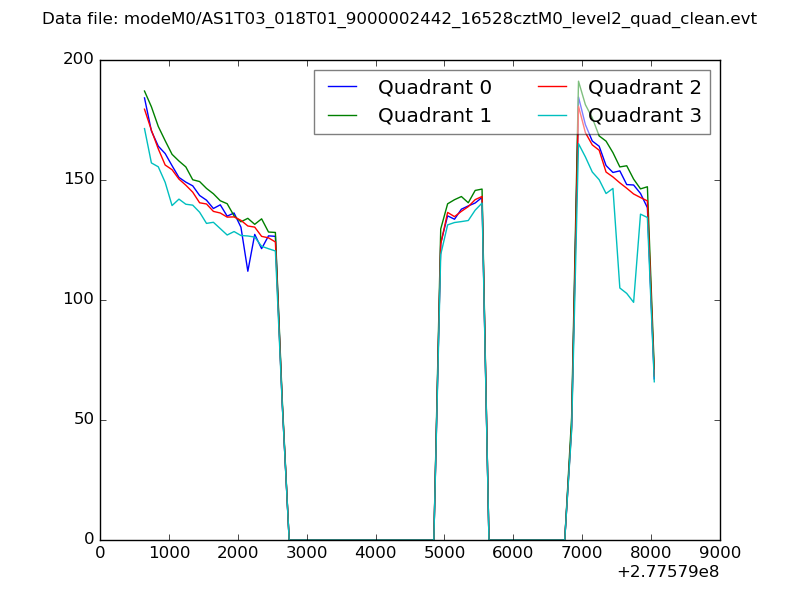 |
|
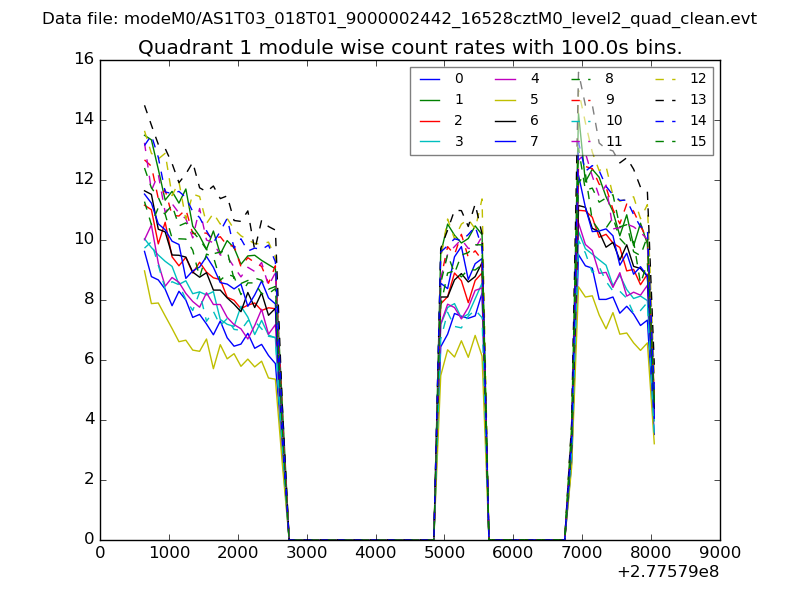
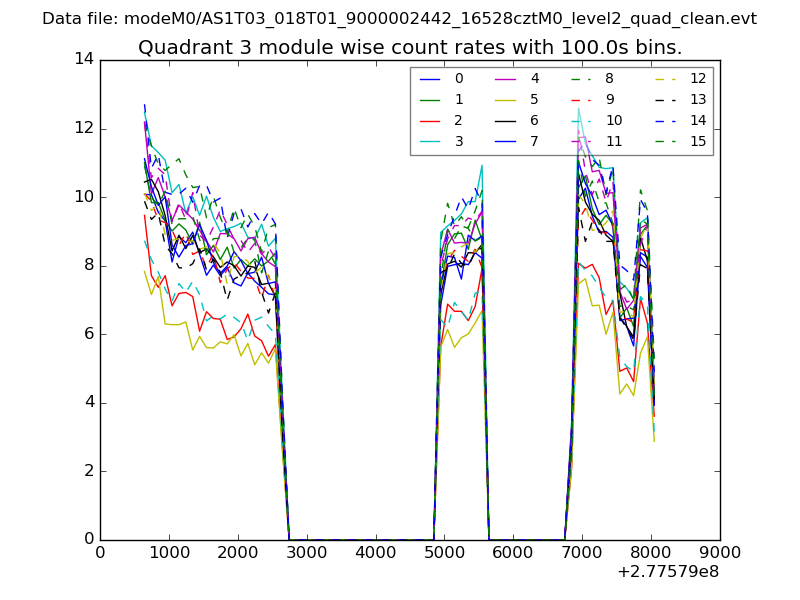
| Module-wise count rates for Quadrant A Data is divided into 100 sec bins |
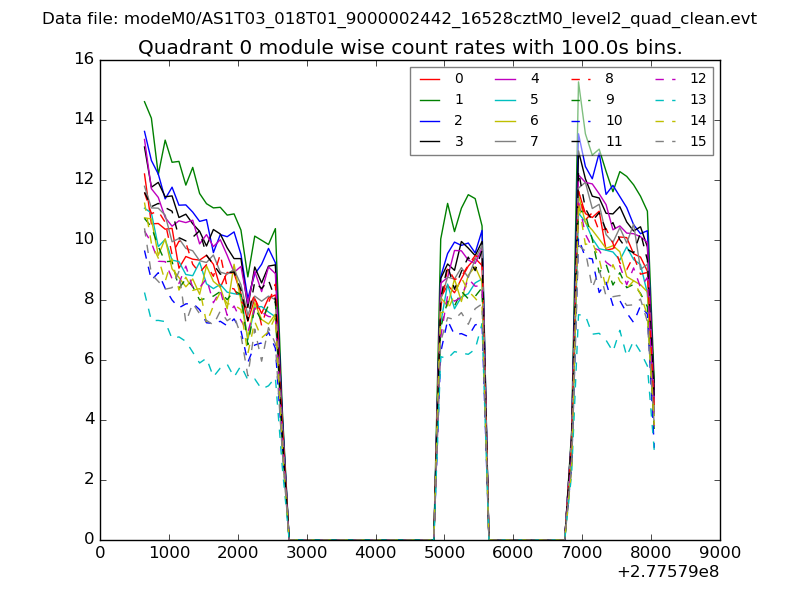 |
 |
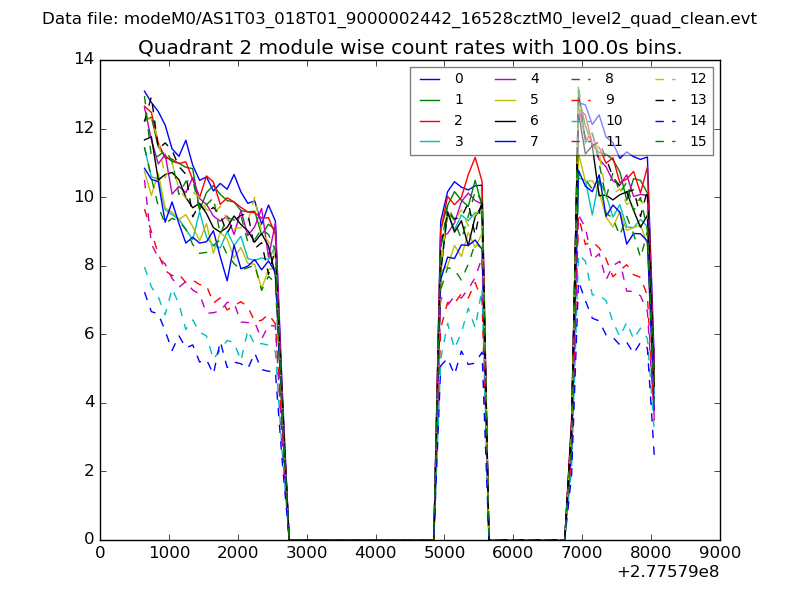
| Module-wise count rates for Quadrant B Data is divided into 100 sec bins |
 |
 |
| Module-wise count rates for Quadrant C Data is divided into 100 sec bins |
 |
 |
| Module-wise count rates for Quadrant D Data is divided into 100 sec bins |
 |
 |
| Parameter | Plot |
|---|---|
| CZT HV Monitor | 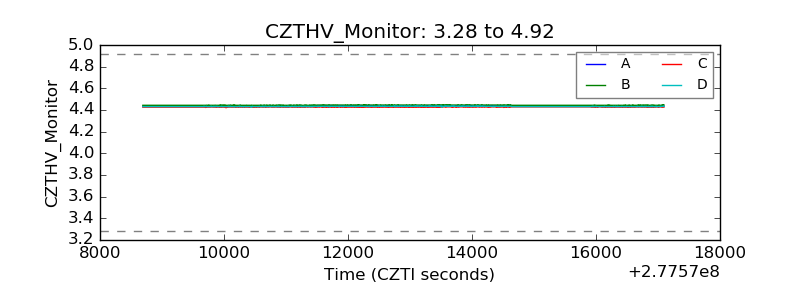 |
| D_VDD | 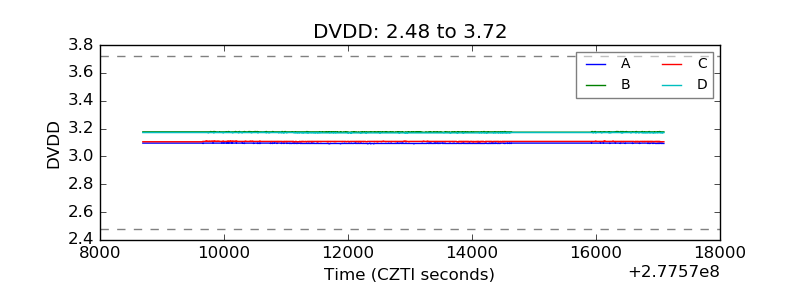 |
| Temperature 1 | 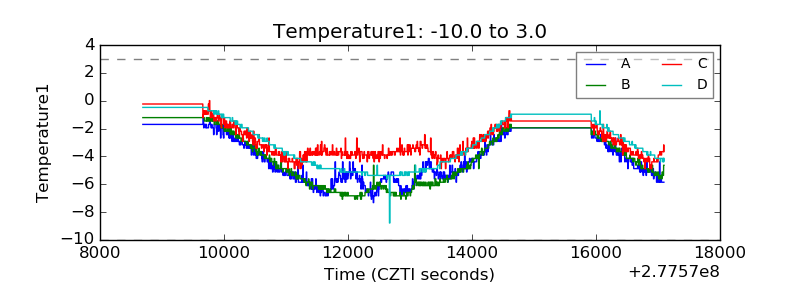 |
| Veto HV Monitor |  |
| Veto LLD | 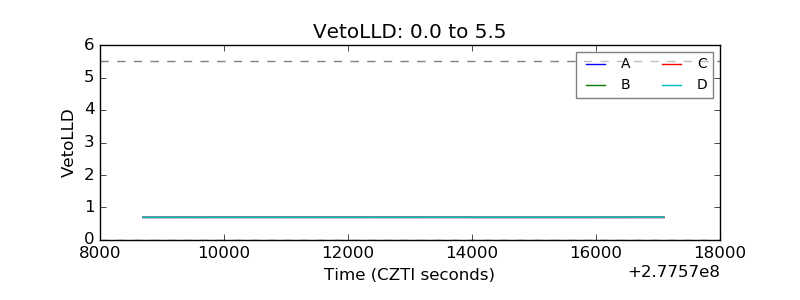 |
| Alpha Counter | 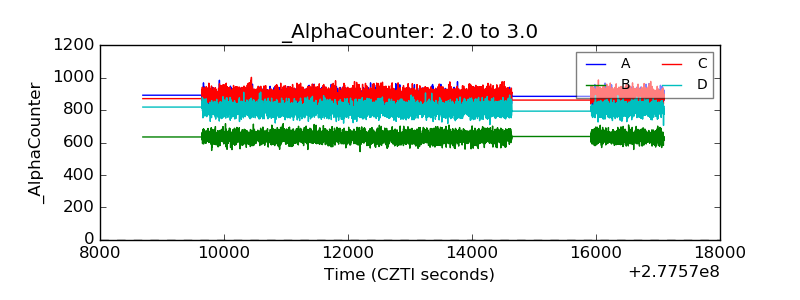 |
| _CPM_Rate | 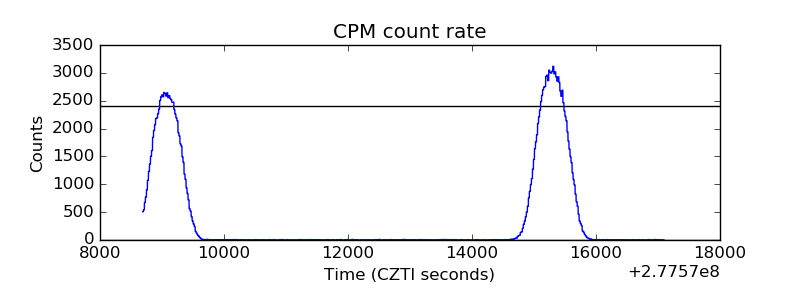 |
| CZT Counter | 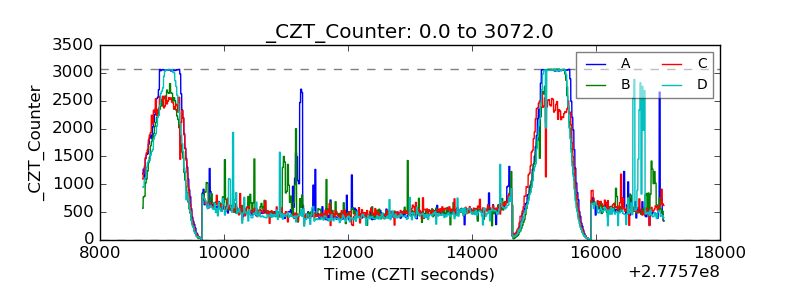 |
| +2.5 Volts monitor |  |
| +5 Volts monitor | 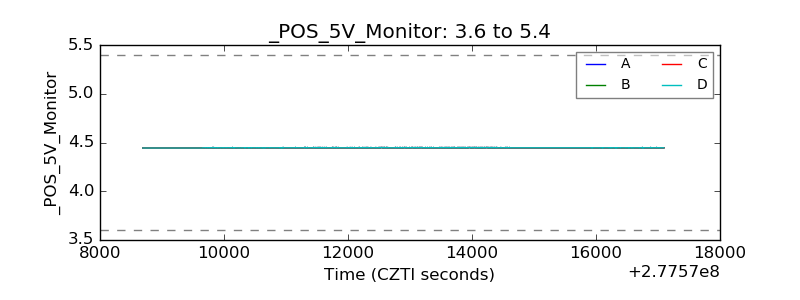 |
| _ROLL_ROT | 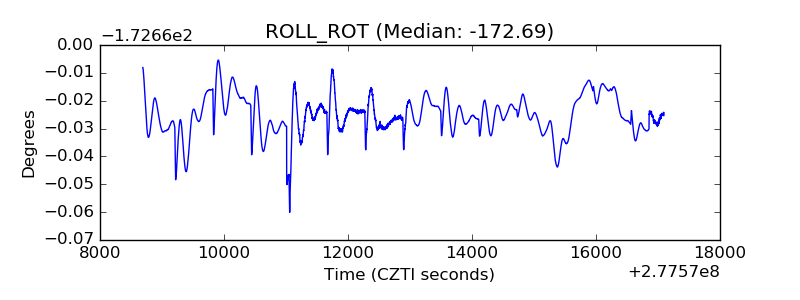 |
| _Roll_DEC | 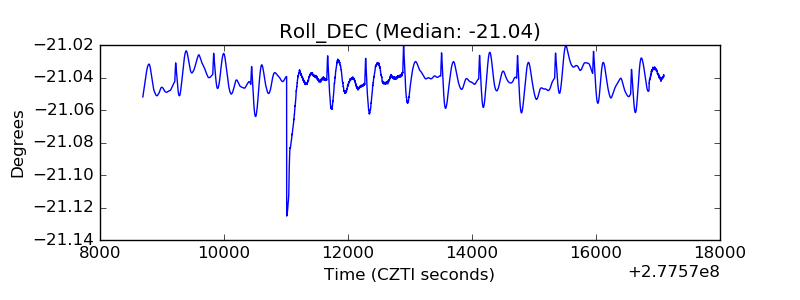 |
| _Roll_RA | 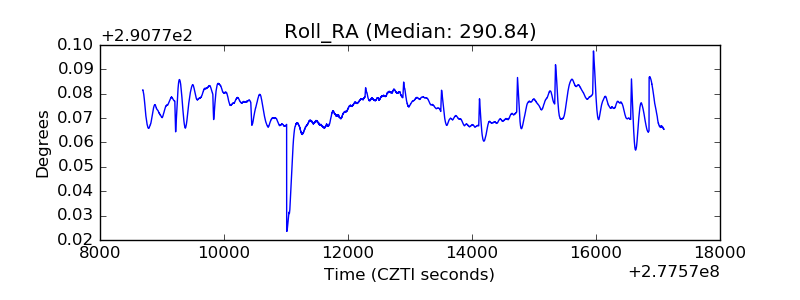 |
| Veto Counter | 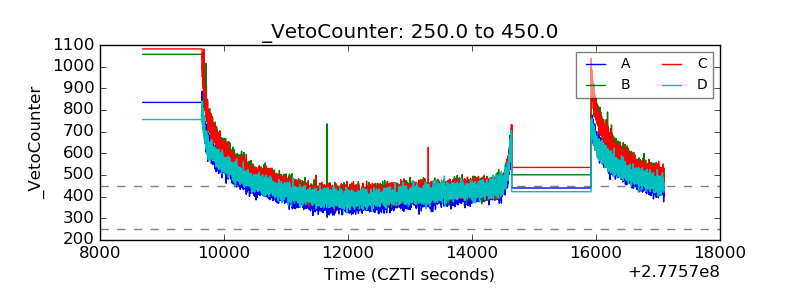 |