| Param | Original file | Final file |
|---|---|---|
| Filename | modeM0/AS1T03_018T01_9000002442_16529cztM0_level2.evt | modeM0/AS1T03_018T01_9000002442_16529cztM0_level2_quad_clean.evt |
| Size (bytes) | 480,306,240 | 89,582,400 |
| Size | 458.1 MB | 85.4 MB |
| Events in quadrant A | 3,225,014 | 576,599 |
| Events in quadrant B | 3,549,112 | 600,663 |
| Events in quadrant C | 3,736,259 | 570,753 |
| Events in quadrant D | 3,617,194 | 534,280 |
| Mode M0 | |||
|---|---|---|---|
| Quadrant | BADHDUFLAG | Total packets | Discarded packets |
| A | 0 | 13357 | 3 |
| B | 0 | 14362 | 2 |
| C | 0 | 15131 | 2 |
| D | 0 | 14844 | 2 |
| Mode M9 | |||
|---|---|---|---|
| Quadrant | BADHDUFLAG | Total packets | Discarded packets |
| A | 0 | 25 | 0 |
| B | 0 | 25 | 0 |
| C | 0 | 25 | 0 |
| D | 0 | 25 | 0 |
| Mode SS | |||
|---|---|---|---|
| Quadrant | BADHDUFLAG | Total packets | Discarded packets |
| A | 0 | 126 | 0 |
| B | 0 | 126 | 0 |
| C | 0 | 126 | 0 |
| D | 0 | 126 | 0 |
| Quadrant | Total seconds | Saturated seconds | Saturation percentage |
|---|---|---|---|
| A | 6166 | 28 | 0.454103% |
| B | 6166 | 35 | 0.567629% |
| C | 6166 | 61 | 0.989296% |
| D | 6166 | 190 | 3.081414% |
Noise dominated data is calculated using 1-second bins in cleaned event files. If a bin has >2000 counts, and if more than 50% of those come from <1% of pixels, then it is considered to be noise-dominated and hence unusable.
| Quadrant | # 1 sec bins | Bins with >0 counts | Bins with >2000 counts | High rate bins dominated by noise | Noise dominated (total time) | Noise dominated (detector-on time) | Marked lightcurve |
|---|---|---|---|---|---|---|---|
| A | 7512 | 6168 | 11 | 11 | 0.15% | 0.18% | 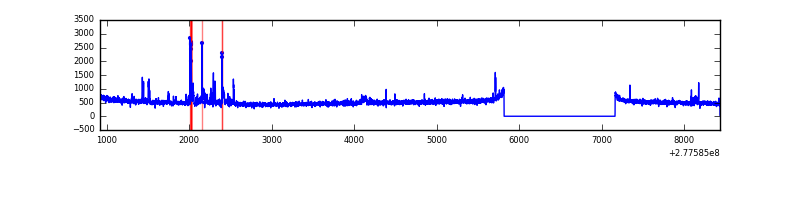 |
| B | 7511 | 6167 | 14 | 14 | 0.19% | 0.23% | 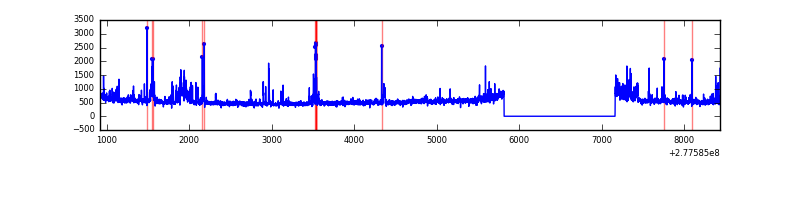 |
| C | 7512 | 6168 | 7 | 7 | 0.09% | 0.11% | 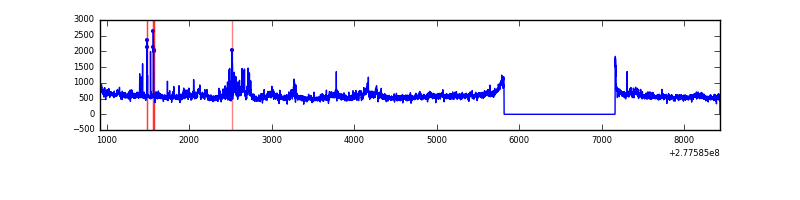 |
| D | 7512 | 6168 | 175 | 175 | 2.33% | 2.84% | 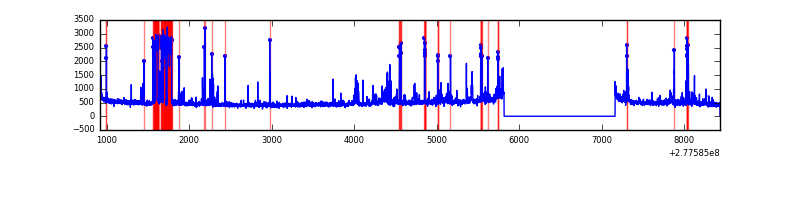 |
Top three noisy pixels from each quadrant. If the there are fewer than three noisy pixels in the level2.evt file, extra rows are filled as -1
| Pixel properties | Quadrant properties | ||||||
|---|---|---|---|---|---|---|---|
| Quadrant | DetID | PixID | Counts | Sigma | Mean | Median | Sigma |
| A | 15 | 174 | 169136 | 1064.66 | 789 | 776 | 158.1 |
| A | 15 | 223 | 19703 | 119.69 | 789 | 776 | 158.1 |
| A | 15 | 239 | 8307 | 47.62 | 789 | 776 | 158.1 |
| B | 10 | 16 | 73130 | 481.91 | 799 | 781 | 150.1 |
| B | 15 | 35 | 68563 | 451.49 | 799 | 781 | 150.1 |
| B | 0 | 168 | 66691 | 439.02 | 799 | 781 | 150.1 |
| C | 3 | 233 | 654741 | 3695.59 | 759 | 767 | 177.0 |
| C | 14 | 238 | 117281 | 658.42 | 759 | 767 | 177.0 |
| C | 13 | 61 | 5375 | 26.04 | 759 | 767 | 177.0 |
| D | 1 | 52 | 654926 | 3272.71 | 739 | 725 | 199.9 |
| D | 7 | 38 | 49639 | 244.7 | 739 | 725 | 199.9 |
| D | 10 | 70 | 35397 | 173.45 | 739 | 725 | 199.9 |
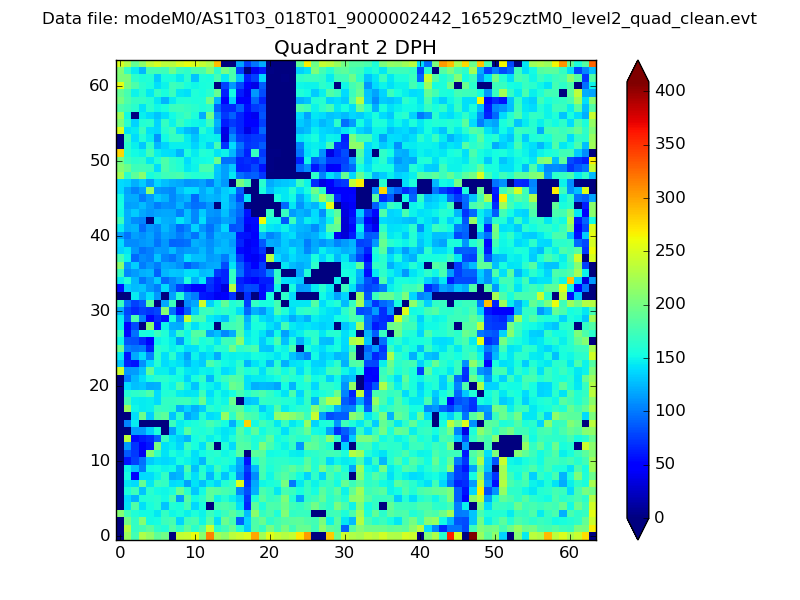
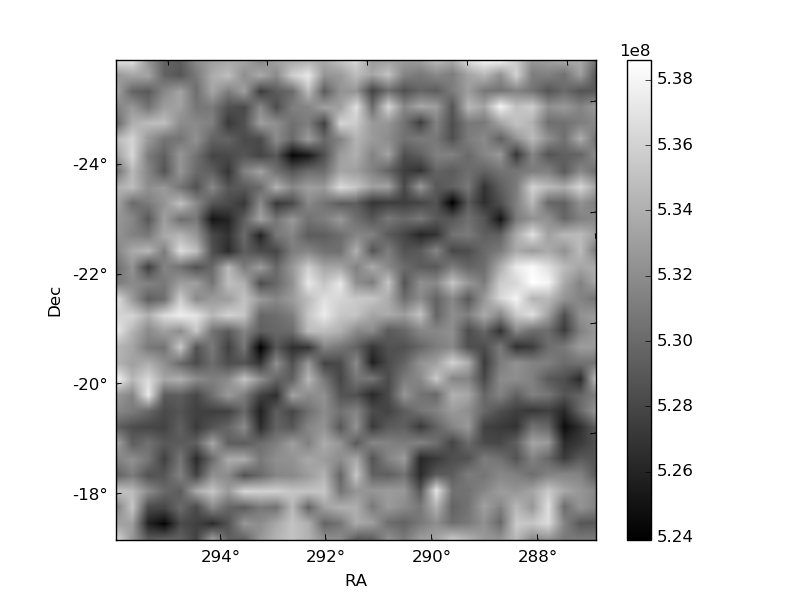
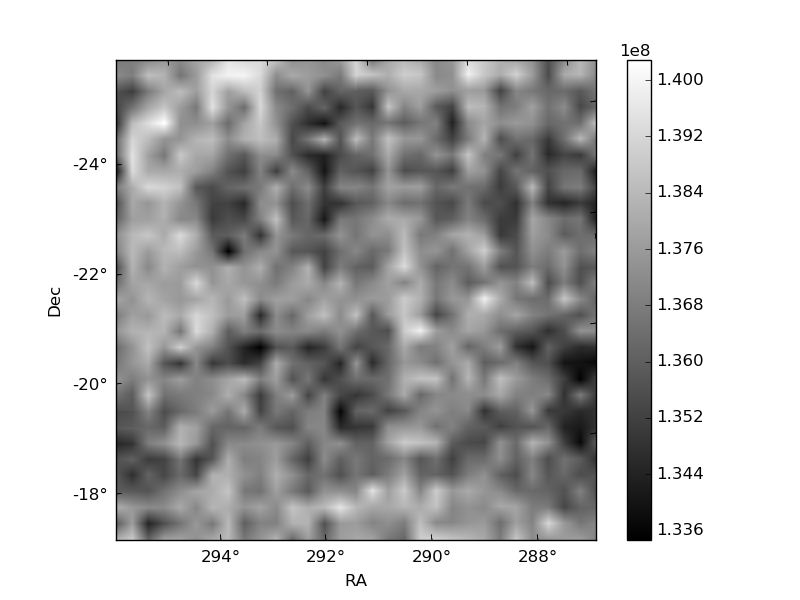
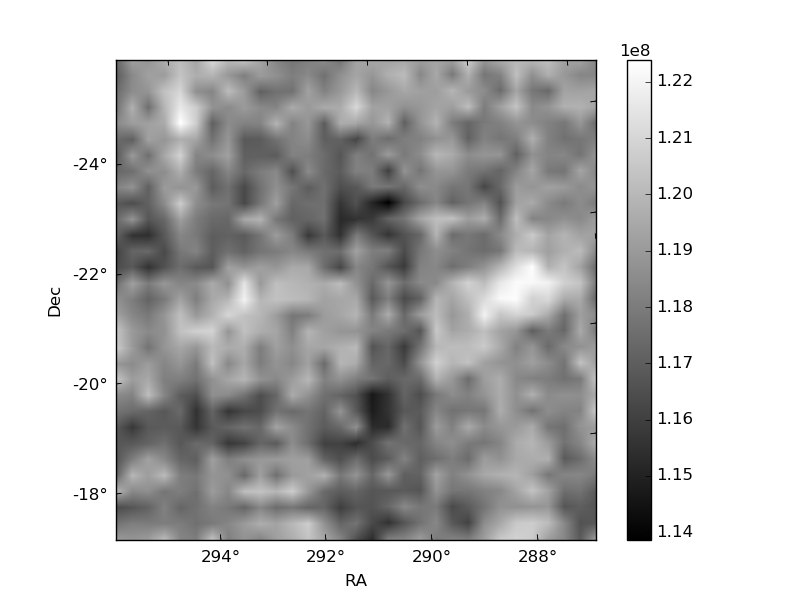
Histogram calculated using DETX and DETY for each event in the final _common_clean file
| Quadrant A | 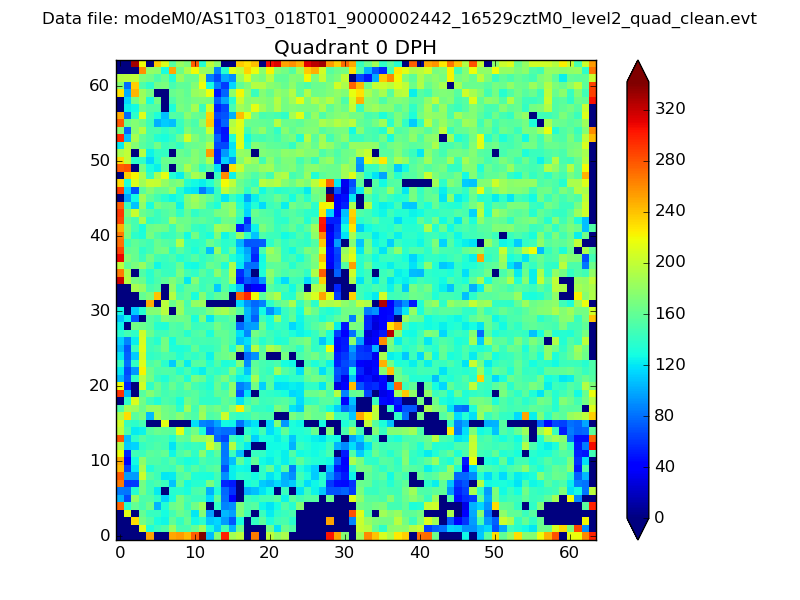 |
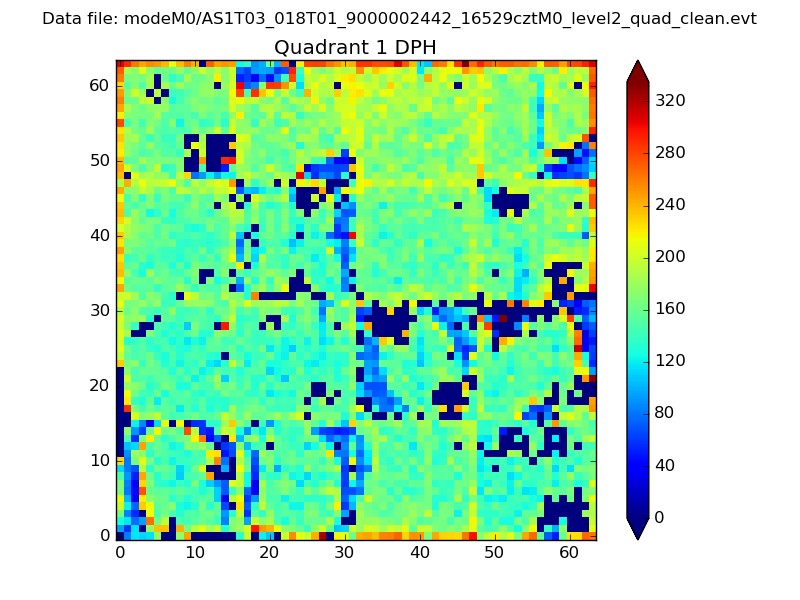 |
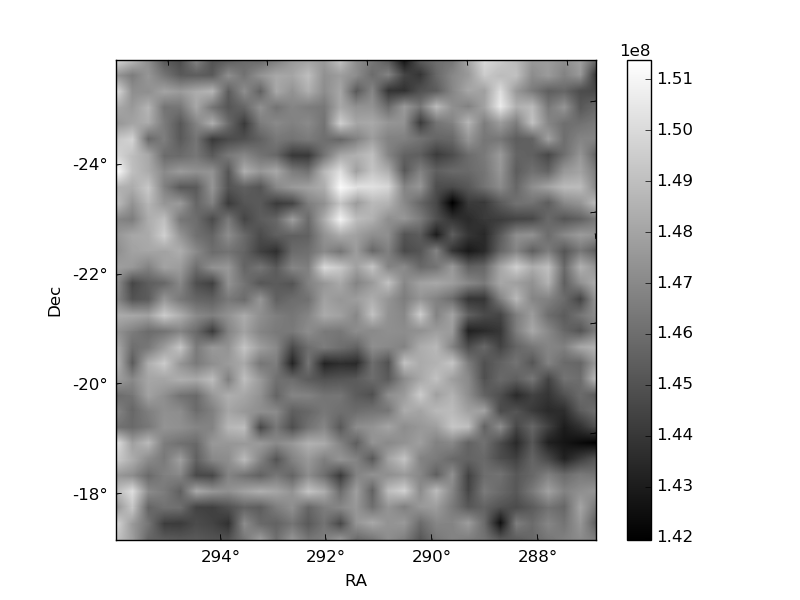
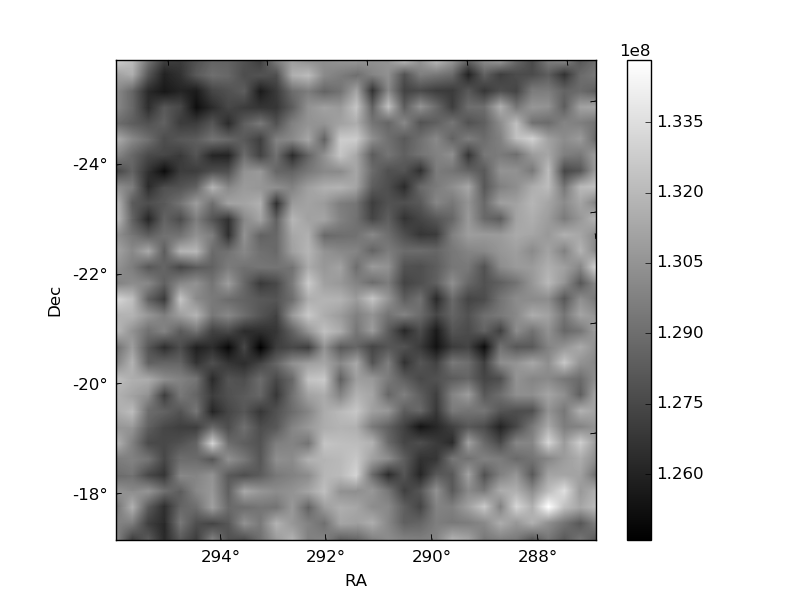
Quadrant B |
|---|---|---|---|
| Quadrant D | 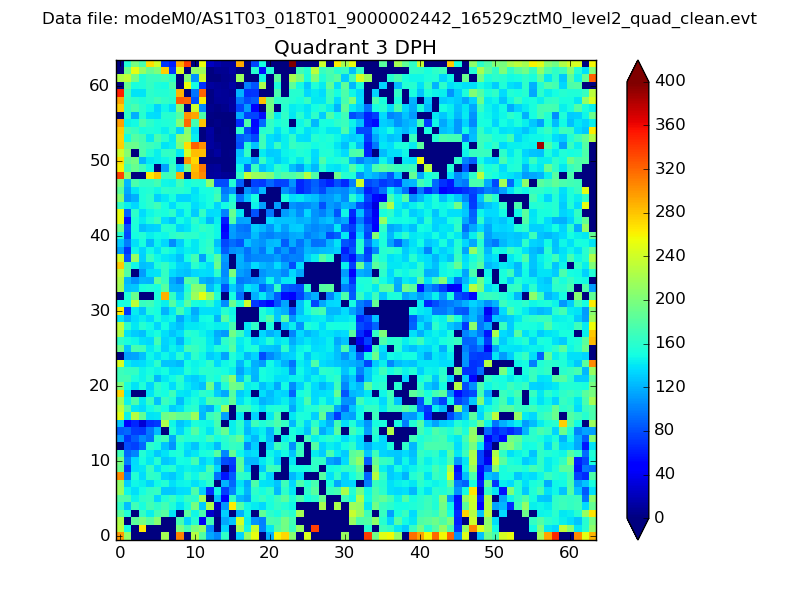 |
 |
Quadrant C |
| Plot type | Count rate plots | Images |
|---|---|---|
| Comparison with Poisson distribution Blue bars denote a histogram of data divided into 1 sec bins. Red curve is a Poisson curve with rate = median count rate of data. |
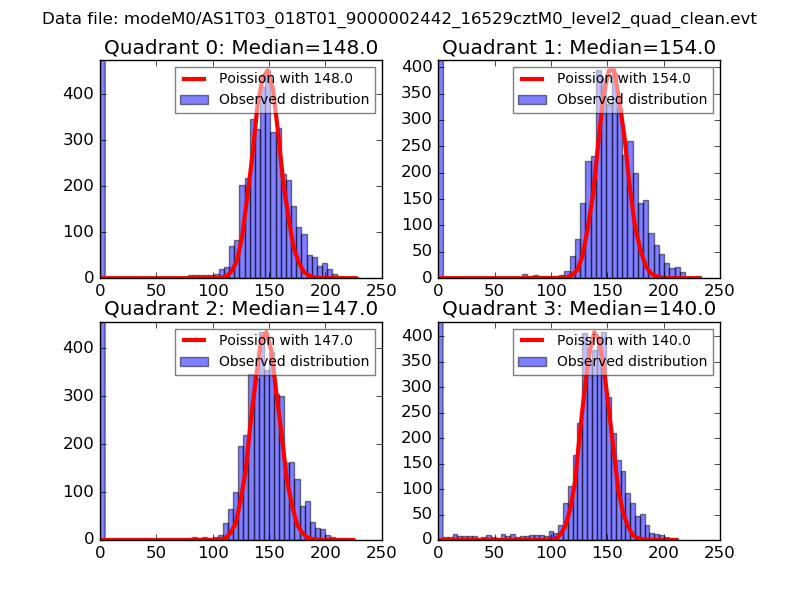 |
 |
| Quadrant-wise count rates Data is divided into 100 sec bins |
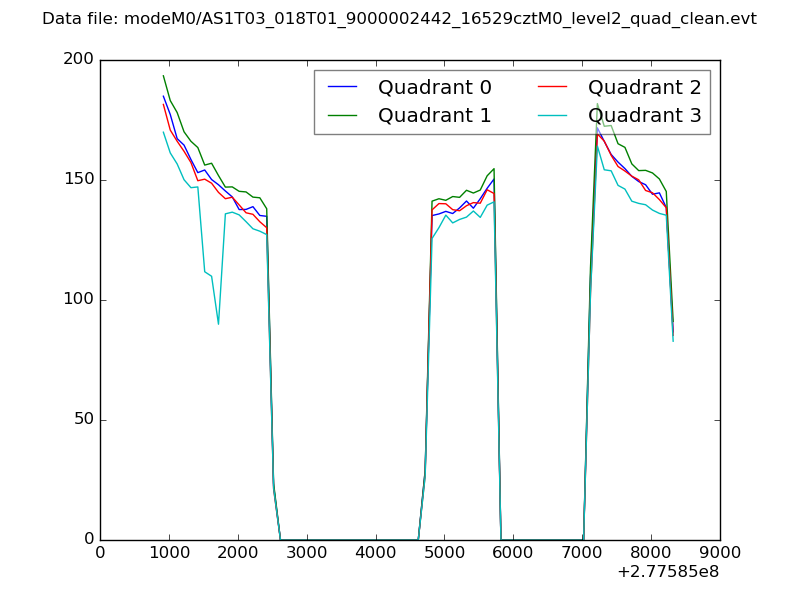 |
|
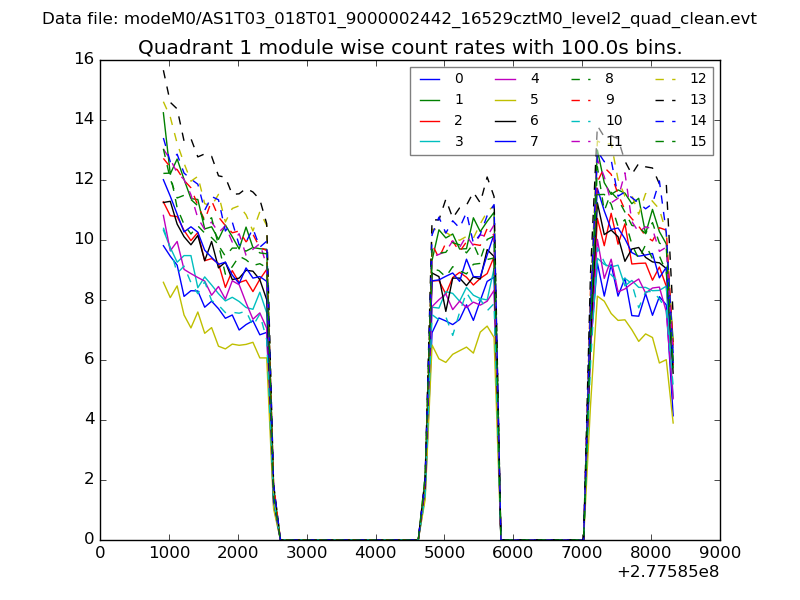
| Module-wise count rates for Quadrant A Data is divided into 100 sec bins |
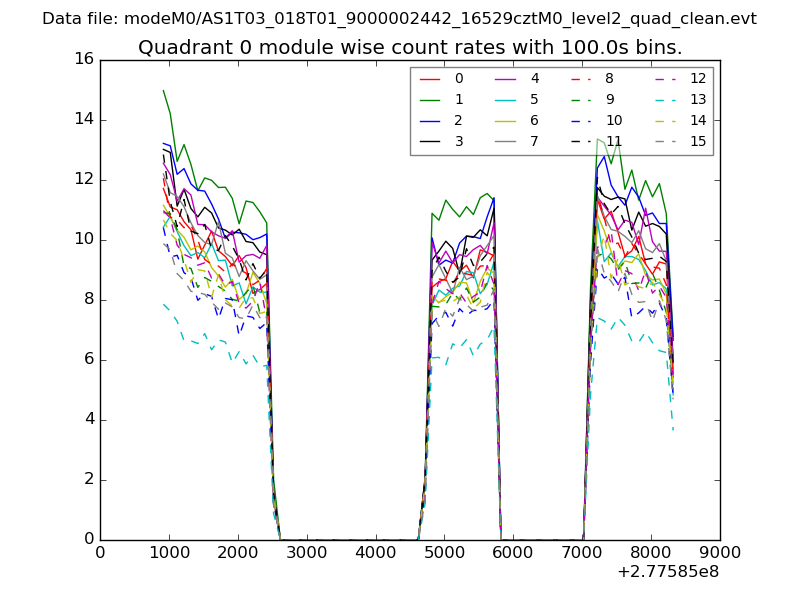 |
 |
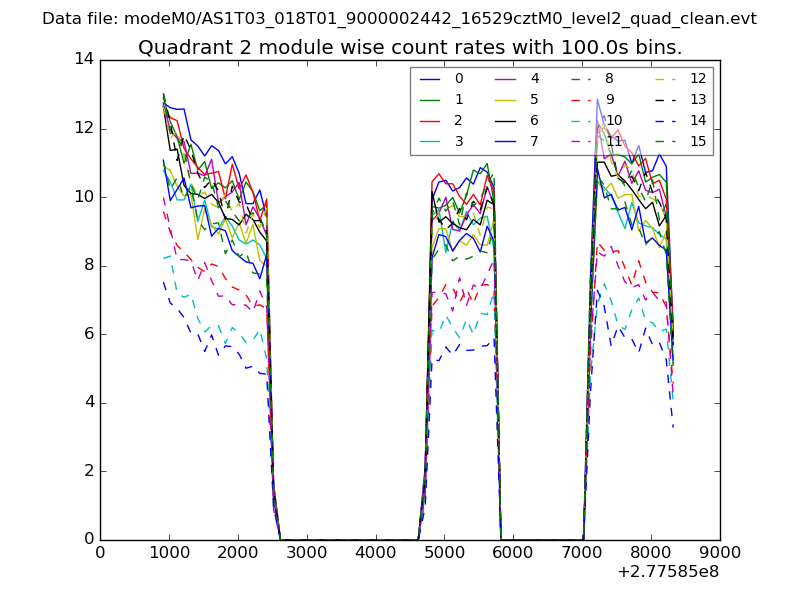
| Module-wise count rates for Quadrant B Data is divided into 100 sec bins |
 |
 |
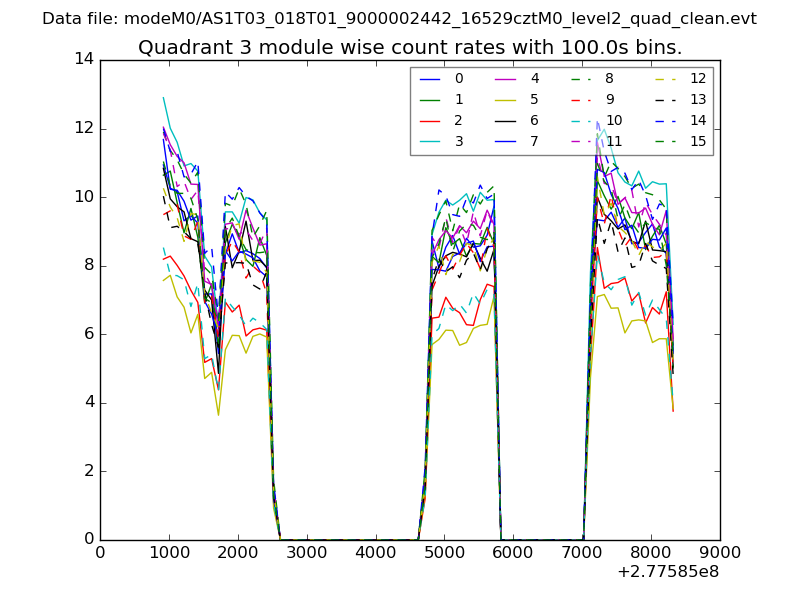
| Module-wise count rates for Quadrant C Data is divided into 100 sec bins |
 |
 |
| Module-wise count rates for Quadrant D Data is divided into 100 sec bins |
 |
 |
| Parameter | Plot |
|---|---|
| CZT HV Monitor | 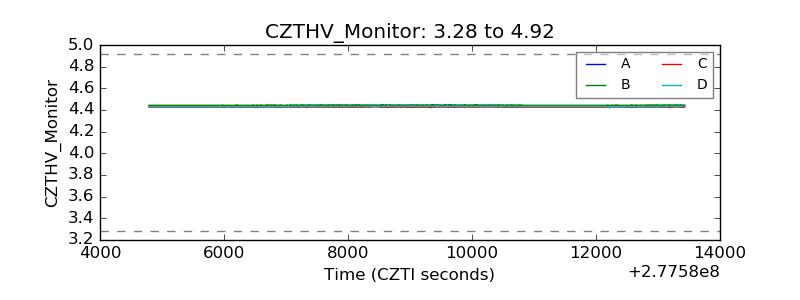 |
| D_VDD | 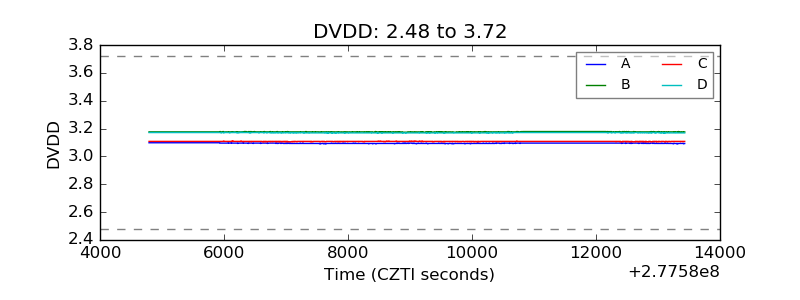 |
| Temperature 1 | 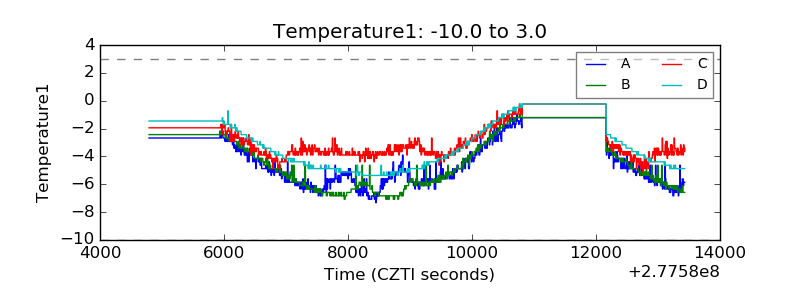 |
| Veto HV Monitor | 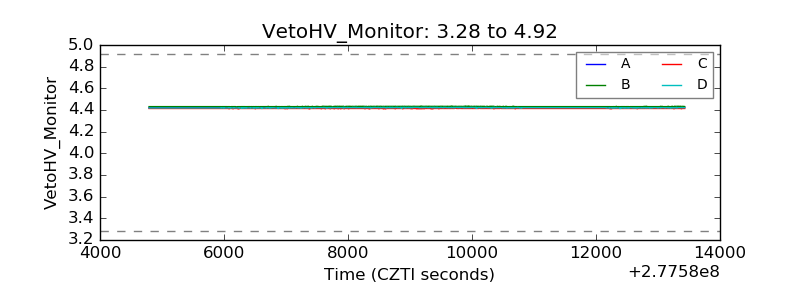 |
| Veto LLD | 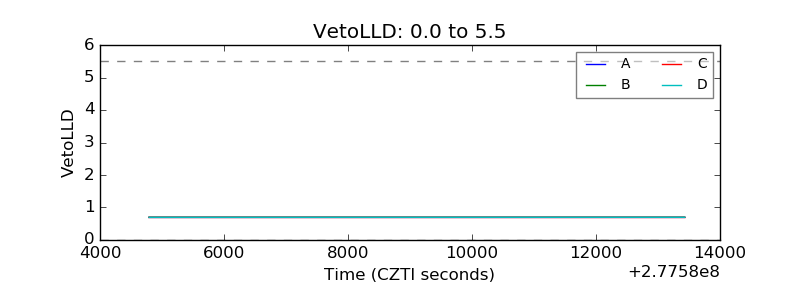 |
| Alpha Counter | 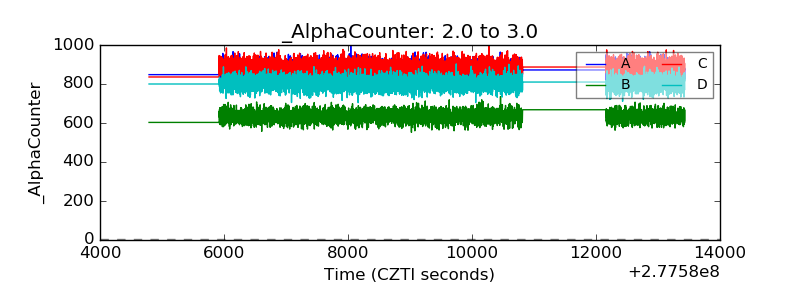 |
| _CPM_Rate | 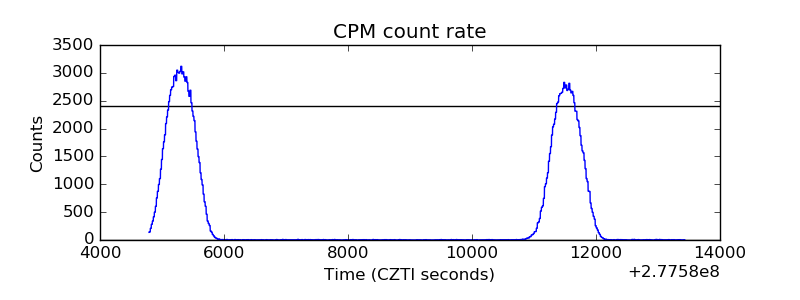 |
| CZT Counter | 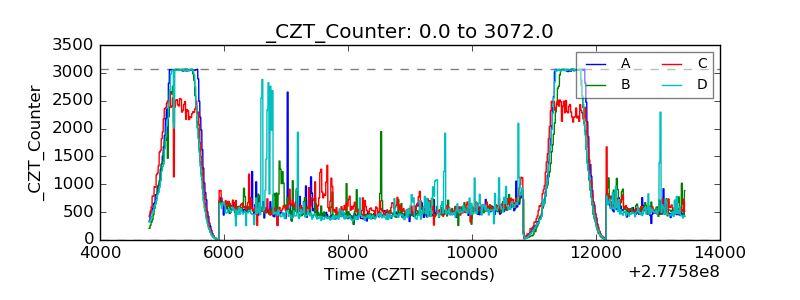 |
| +2.5 Volts monitor | 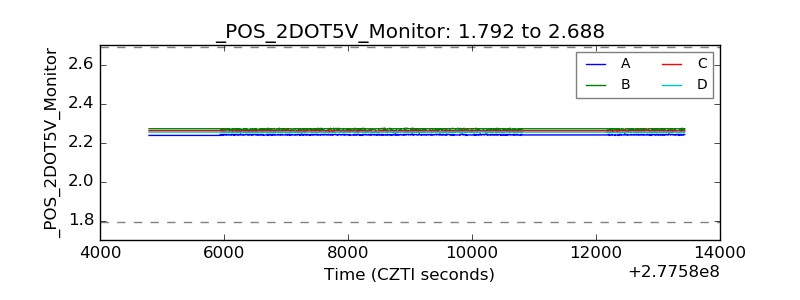 |
| +5 Volts monitor | 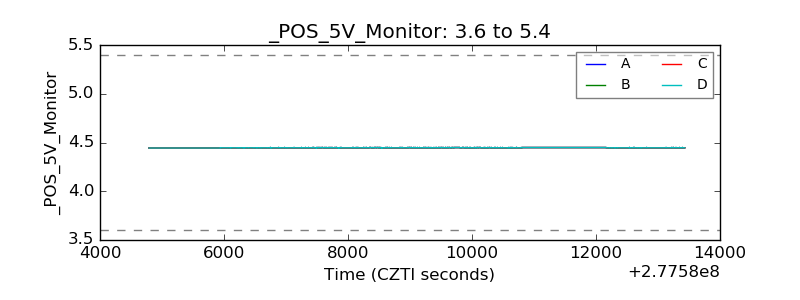 |
| _ROLL_ROT | 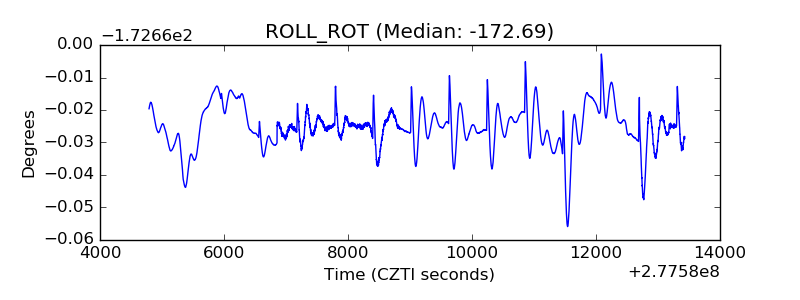 |
| _Roll_DEC | 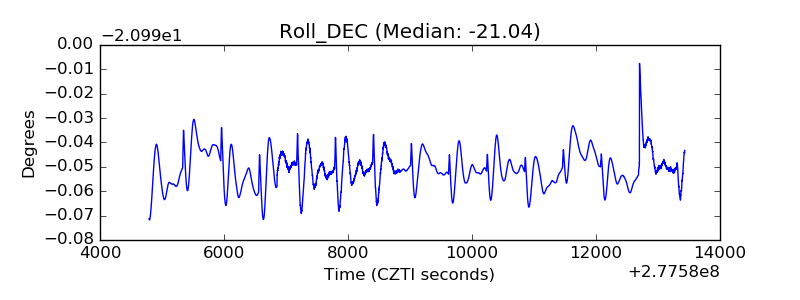 |
| _Roll_RA | 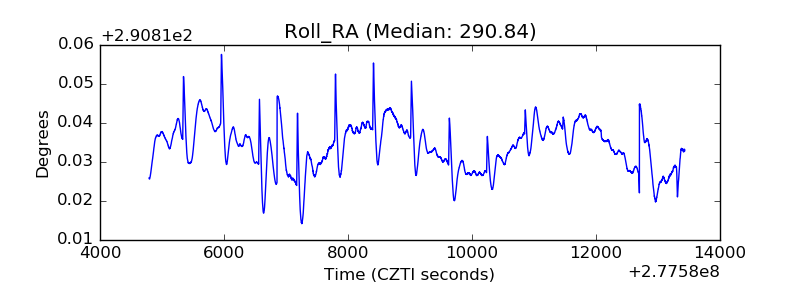 |
| Veto Counter | 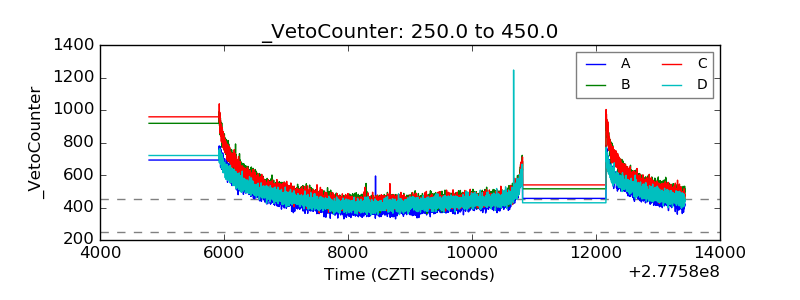 |