| Param | Original file | Final file |
|---|---|---|
| Filename | modeM0/AS1T03_018T01_9000002442_16531cztM0_level2.evt | modeM0/AS1T03_018T01_9000002442_16531cztM0_level2_quad_clean.evt |
| Size (bytes) | 487,419,840 | 74,292,480 |
| Size | 464.8 MB | 70.9 MB |
| Events in quadrant A | 3,354,800 | 445,837 |
| Events in quadrant B | 3,572,150 | 460,964 |
| Events in quadrant C | 3,349,881 | 447,542 |
| Events in quadrant D | 4,033,338 | 431,478 |
| Mode M0 | |||
|---|---|---|---|
| Quadrant | BADHDUFLAG | Total packets | Discarded packets |
| A | 0 | 14218 | 3 |
| B | 0 | 14622 | 2 |
| C | 0 | 13809 | 2 |
| D | 0 | 16280 | 2 |
| Mode M9 | |||
|---|---|---|---|
| Quadrant | BADHDUFLAG | Total packets | Discarded packets |
| A | 0 | 20 | 0 |
| B | 0 | 20 | 0 |
| C | 0 | 20 | 0 |
| D | 0 | 21 | 0 |
| Mode SS | |||
|---|---|---|---|
| Quadrant | BADHDUFLAG | Total packets | Discarded packets |
| A | 0 | 134 | 0 |
| B | 0 | 134 | 0 |
| C | 0 | 134 | 0 |
| D | 0 | 134 | 0 |
| Quadrant | Total seconds | Saturated seconds | Saturation percentage |
|---|---|---|---|
| A | 6653 | 29 | 0.435894% |
| B | 6653 | 78 | 1.172403% |
| C | 6653 | 77 | 1.157373% |
| D | 6653 | 110 | 1.653389% |
Noise dominated data is calculated using 1-second bins in cleaned event files. If a bin has >2000 counts, and if more than 50% of those come from <1% of pixels, then it is considered to be noise-dominated and hence unusable.
| Quadrant | # 1 sec bins | Bins with >0 counts | Bins with >2000 counts | High rate bins dominated by noise | Noise dominated (total time) | Noise dominated (detector-on time) | Marked lightcurve |
|---|---|---|---|---|---|---|---|
| A | 7859 | 6655 | 8 | 8 | 0.10% | 0.12% | 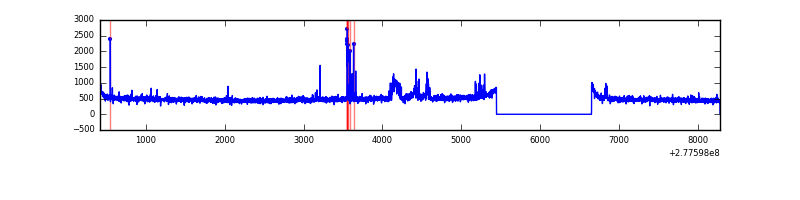 |
| B | 7859 | 6654 | 3 | 3 | 0.04% | 0.05% | 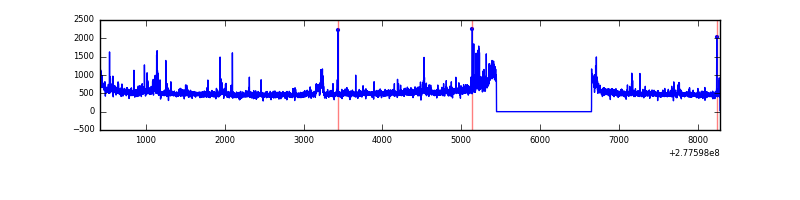 |
| C | 7859 | 6655 | 0 | 0 | 0.00% | 0.00% | 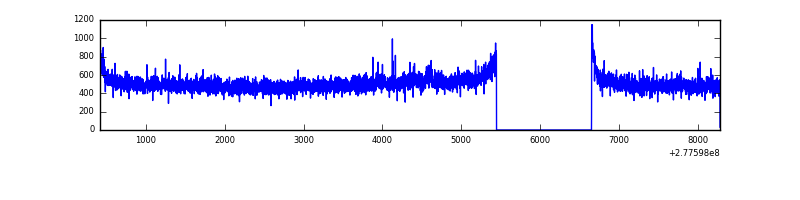 |
| D | 7859 | 6655 | 114 | 114 | 1.45% | 1.71% | 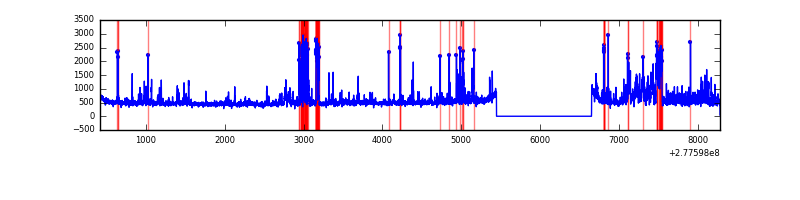 |
Top three noisy pixels from each quadrant. If the there are fewer than three noisy pixels in the level2.evt file, extra rows are filled as -1
| Pixel properties | Quadrant properties | ||||||
|---|---|---|---|---|---|---|---|
| Quadrant | DetID | PixID | Counts | Sigma | Mean | Median | Sigma |
| A | 15 | 174 | 168968 | 1007.16 | 827 | 811 | 167.0 |
| A | 0 | 226 | 7214 | 38.35 | 827 | 811 | 167.0 |
| A | 12 | 194 | 6024 | 31.22 | 827 | 811 | 167.0 |
| B | 15 | 35 | 56876 | 354.09 | 838 | 817 | 158.3 |
| B | 7 | 220 | 40579 | 251.15 | 838 | 817 | 158.3 |
| B | 3 | 209 | 37953 | 234.57 | 838 | 817 | 158.3 |
| C | 14 | 238 | 128345 | 683.93 | 802 | 809 | 186.5 |
| C | 3 | 233 | 87072 | 462.6 | 802 | 809 | 186.5 |
| C | 7 | 247 | 6456 | 30.28 | 802 | 809 | 186.5 |
| D | 1 | 52 | 796528 | 4089.29 | 799 | 777 | 194.6 |
| D | 10 | 70 | 81669 | 415.7 | 799 | 777 | 194.6 |
| D | 2 | 33 | 33873 | 170.08 | 799 | 777 | 194.6 |
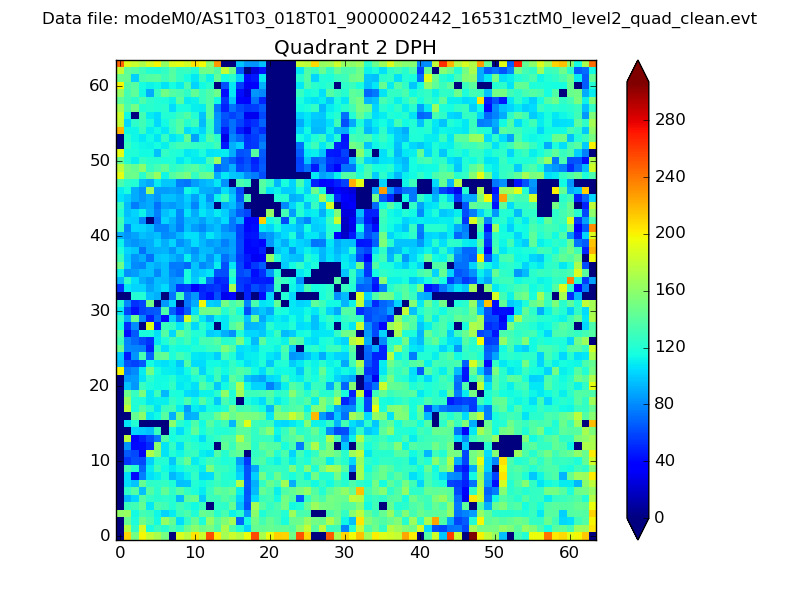
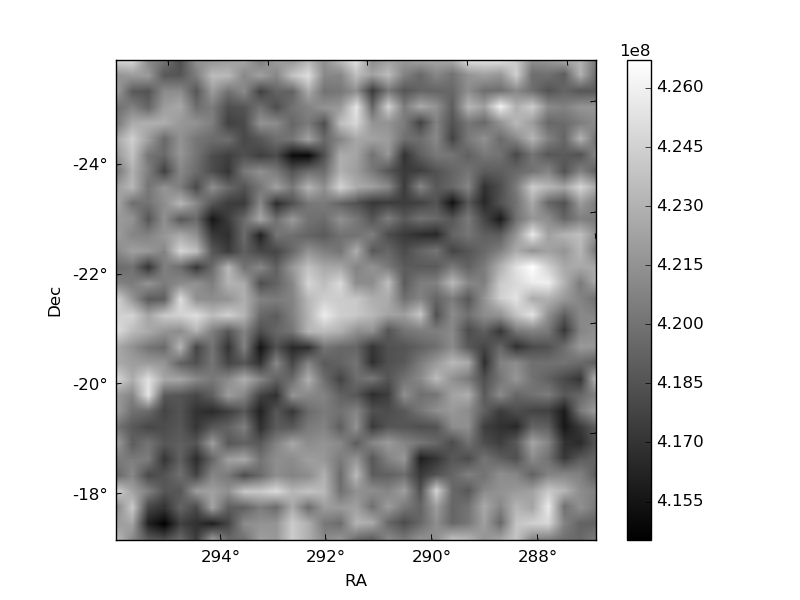
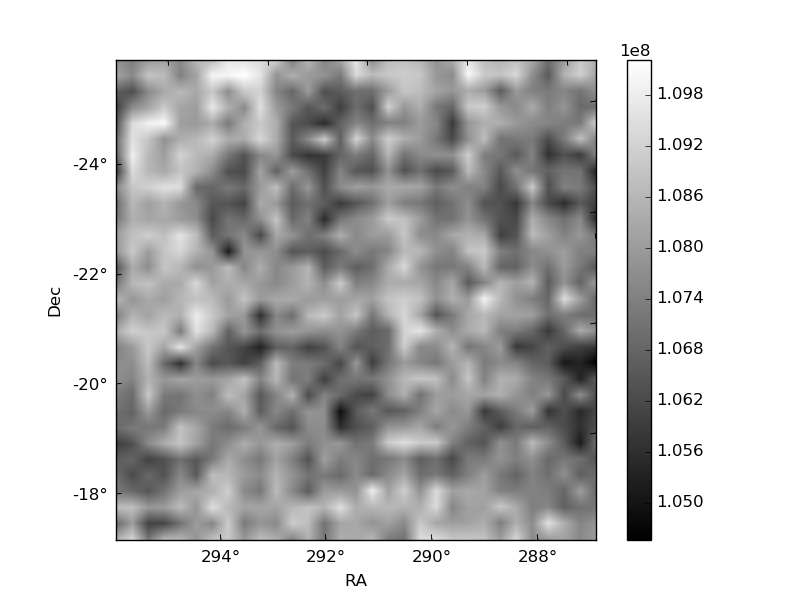
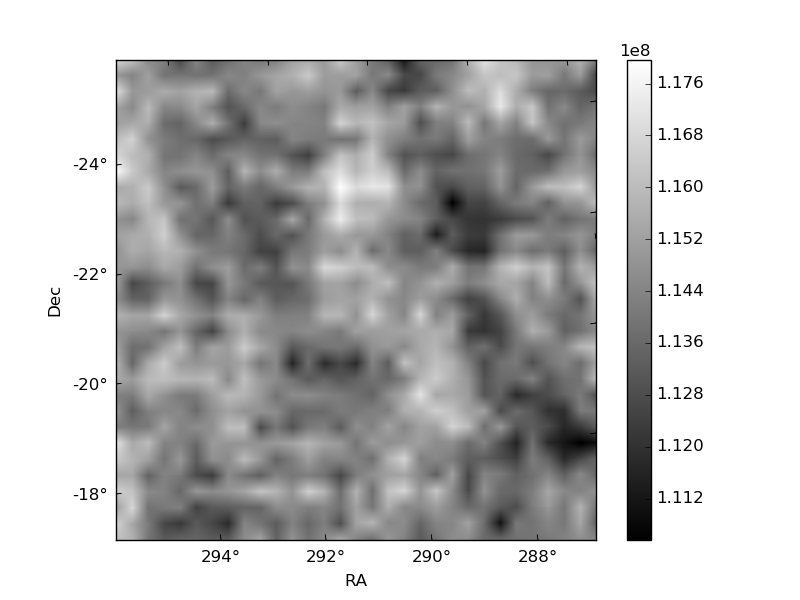
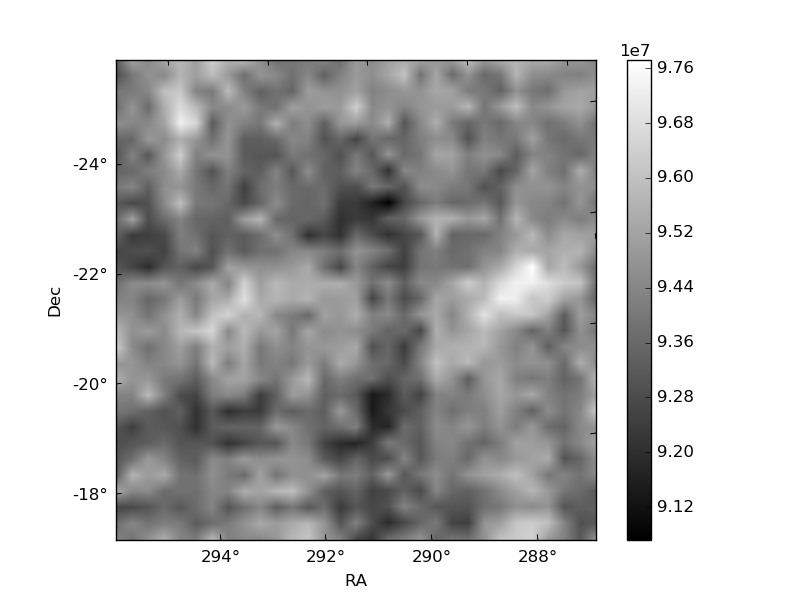
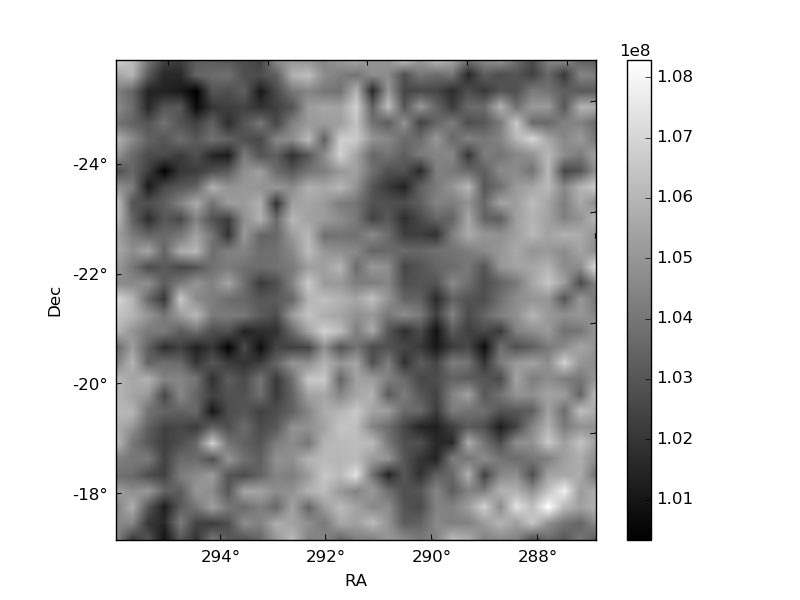
Histogram calculated using DETX and DETY for each event in the final _common_clean file
| Quadrant A | 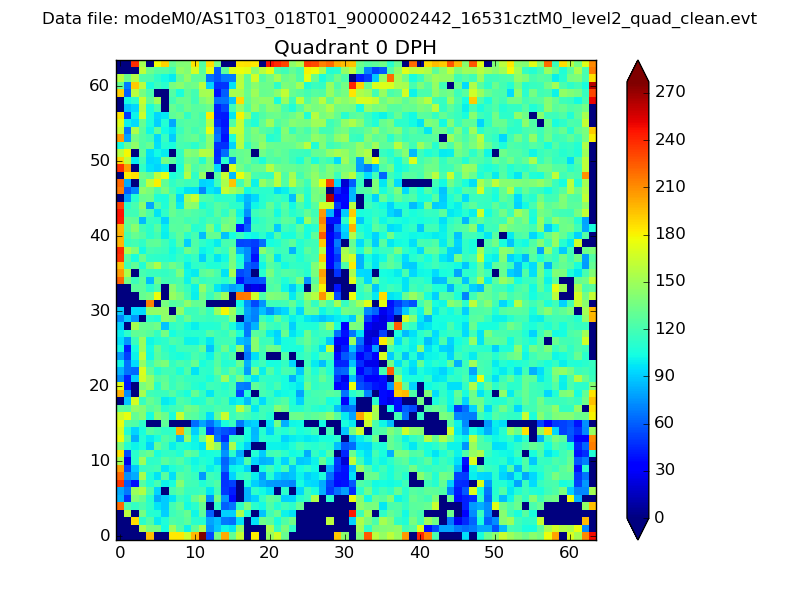 |
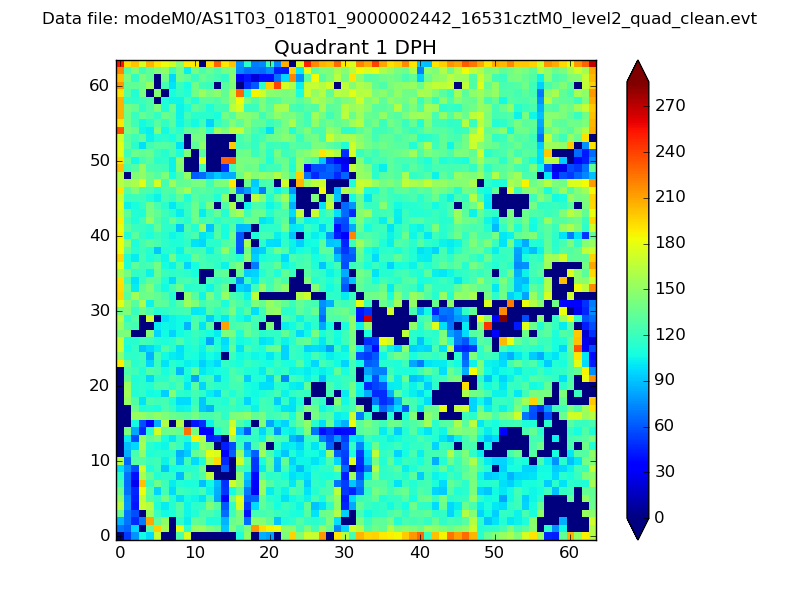 |
Quadrant B |
|---|---|---|---|
| Quadrant D | 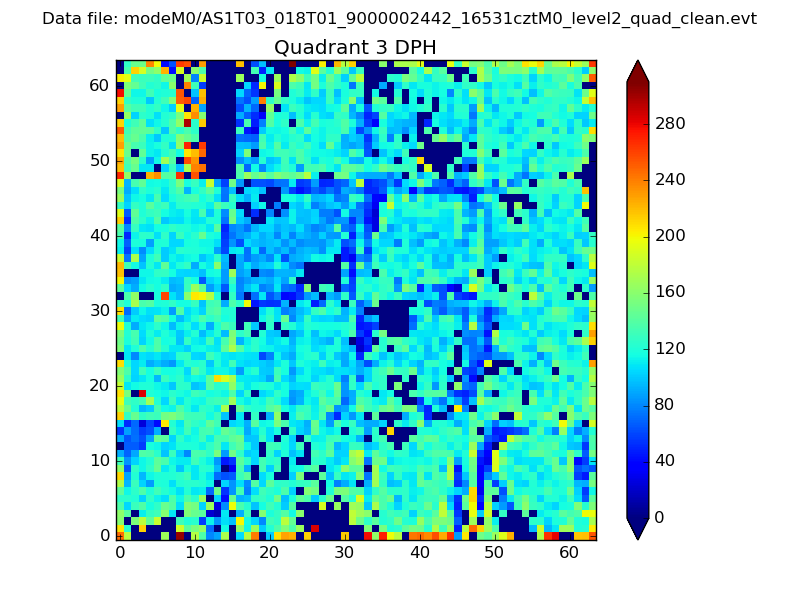 |
 |
Quadrant C |
| Plot type | Count rate plots | Images |
|---|---|---|
| Comparison with Poisson distribution Blue bars denote a histogram of data divided into 1 sec bins. Red curve is a Poisson curve with rate = median count rate of data. |
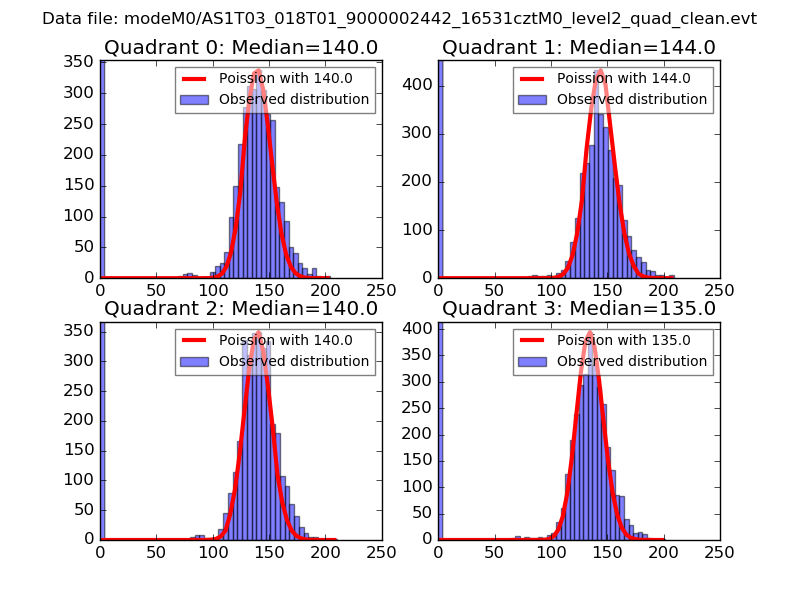 |
 |
| Quadrant-wise count rates Data is divided into 100 sec bins |
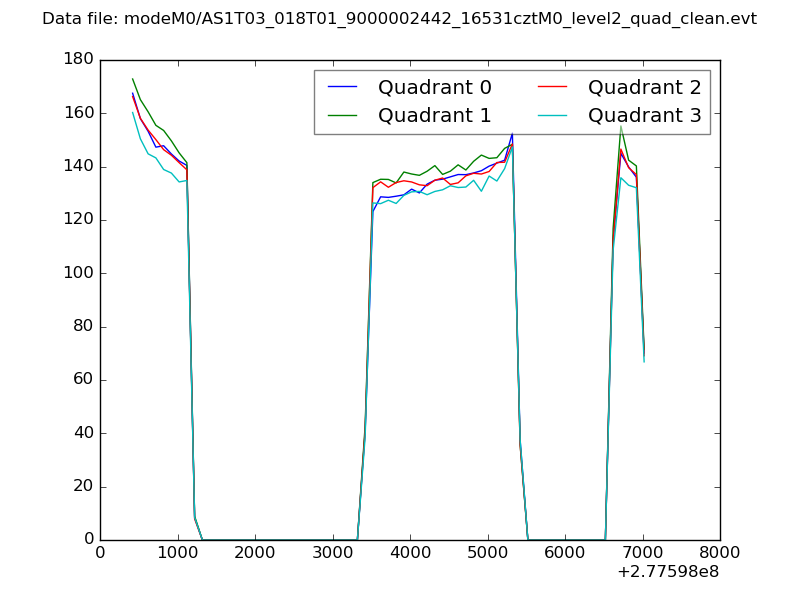 |
|
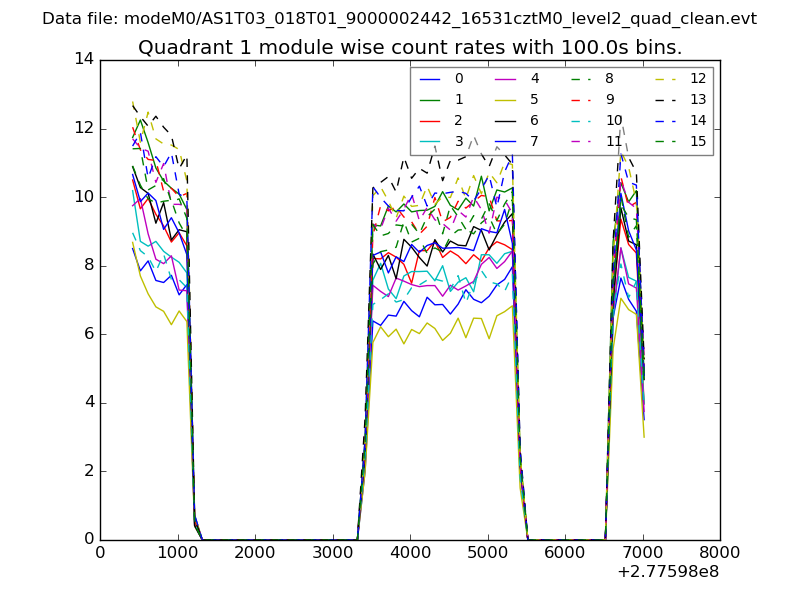
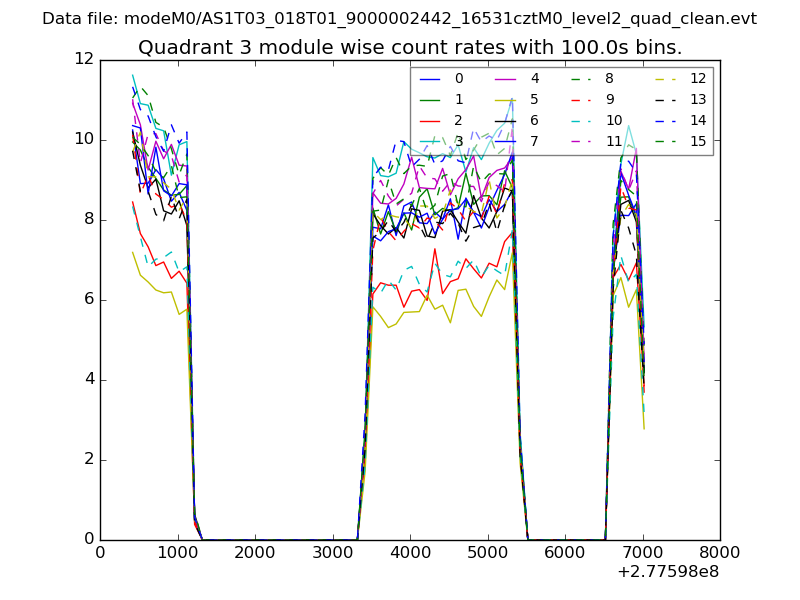
| Module-wise count rates for Quadrant A Data is divided into 100 sec bins |
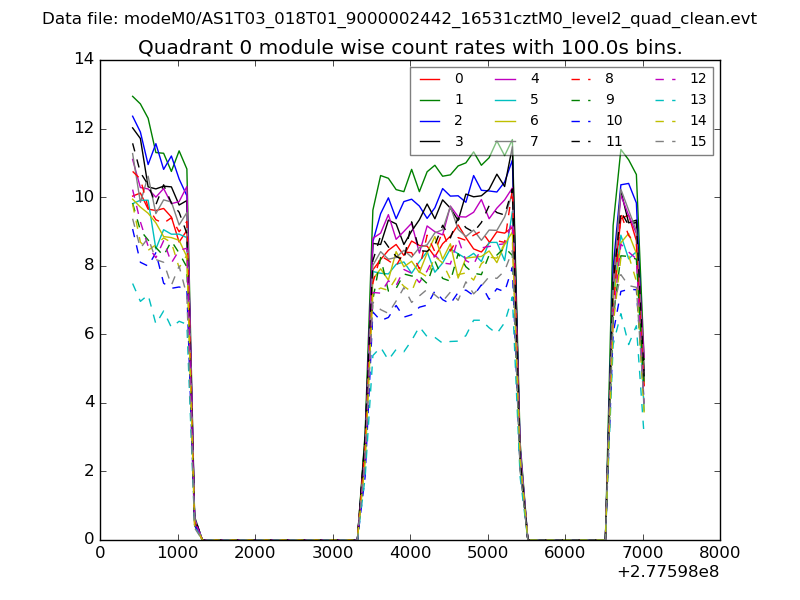 |
 |
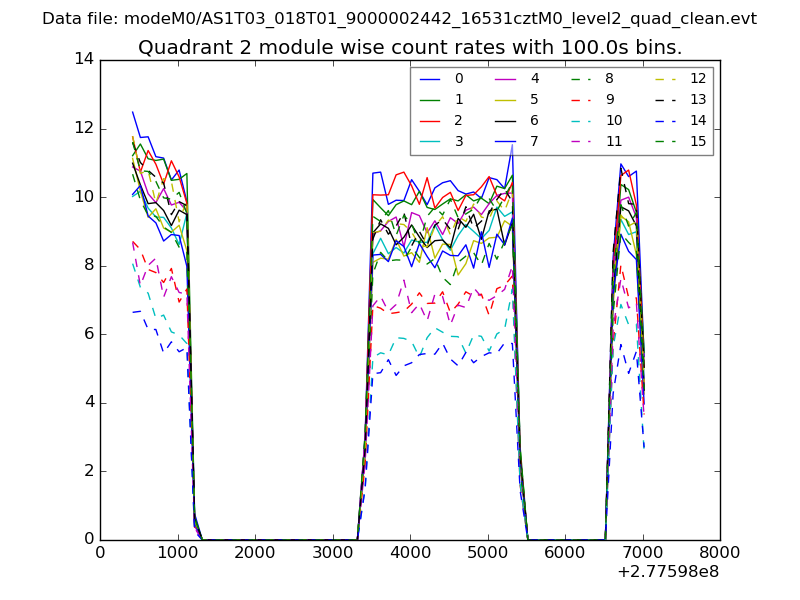
| Module-wise count rates for Quadrant B Data is divided into 100 sec bins |
 |
 |
| Module-wise count rates for Quadrant C Data is divided into 100 sec bins |
 |
 |
| Module-wise count rates for Quadrant D Data is divided into 100 sec bins |
 |
 |
| Parameter | Plot |
|---|---|
| CZT HV Monitor | 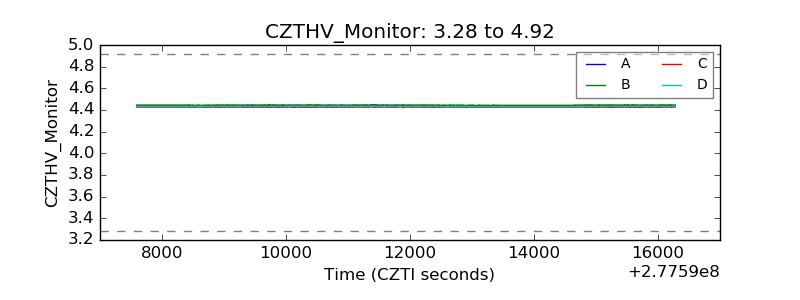 |
| D_VDD | 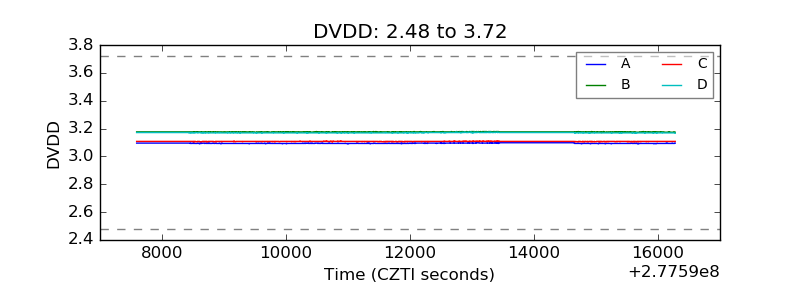 |
| Temperature 1 | 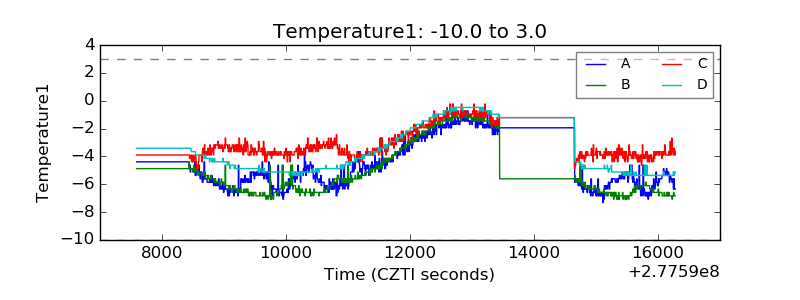 |
| Veto HV Monitor | 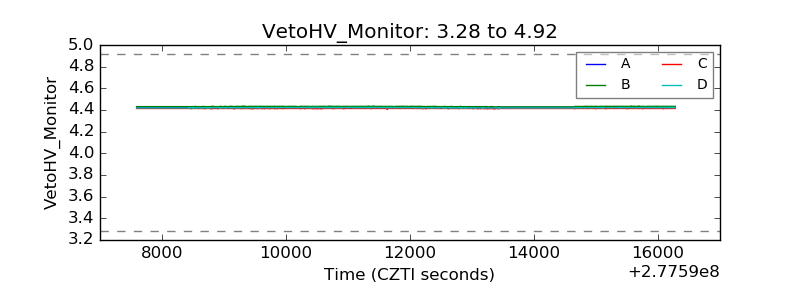 |
| Veto LLD | 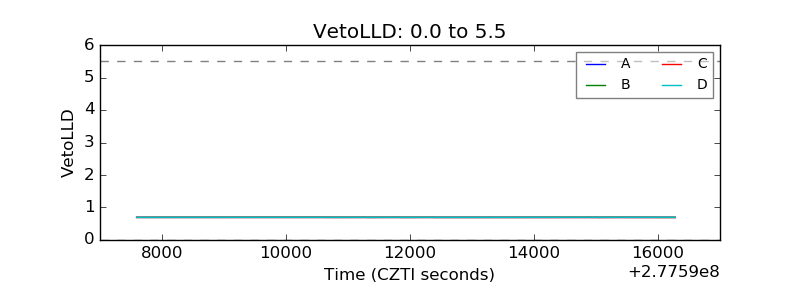 |
| Alpha Counter | 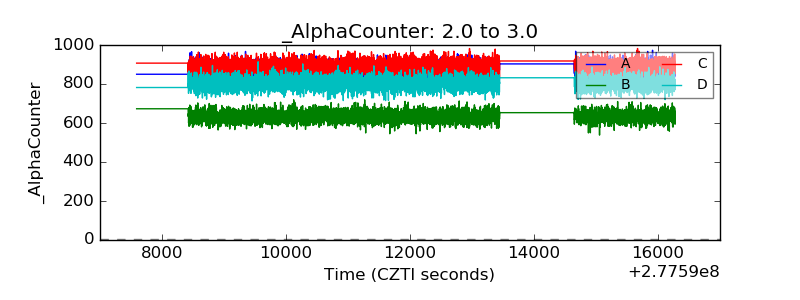 |
| _CPM_Rate | 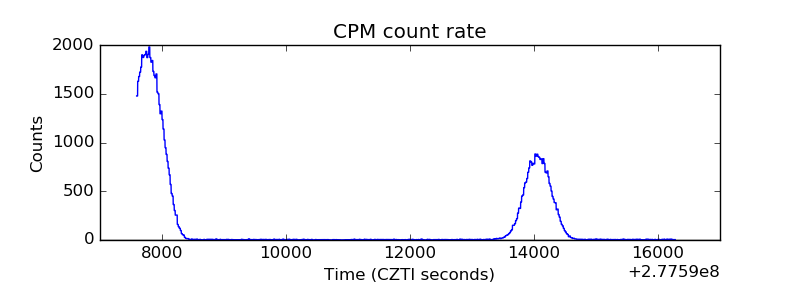 |
| CZT Counter | 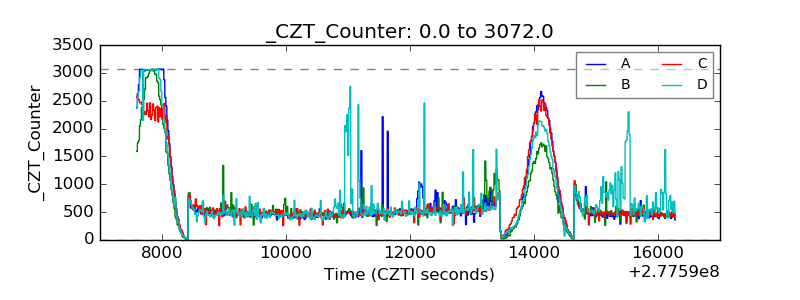 |
| +2.5 Volts monitor |  |
| +5 Volts monitor |  |
| _ROLL_ROT | 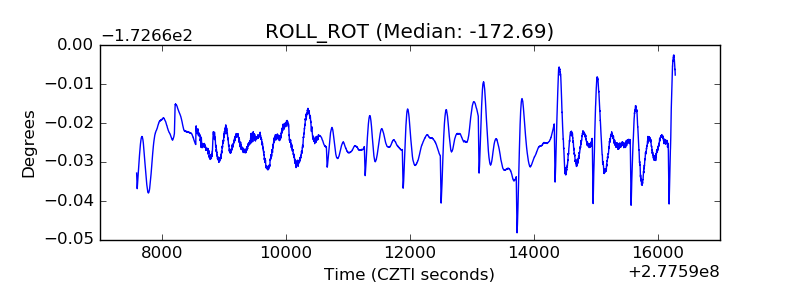 |
| _Roll_DEC | 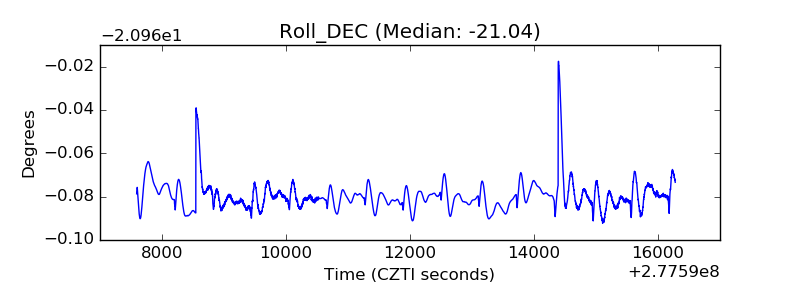 |
| _Roll_RA | 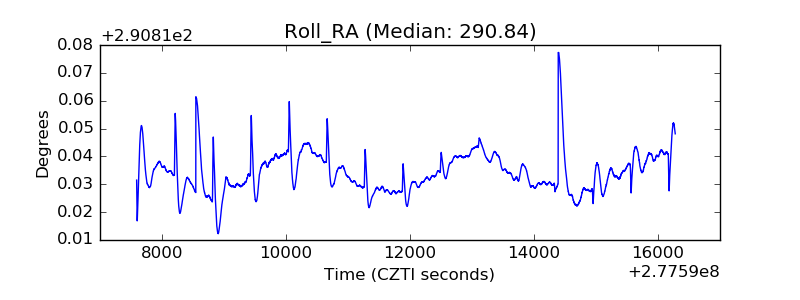 |
| Veto Counter | 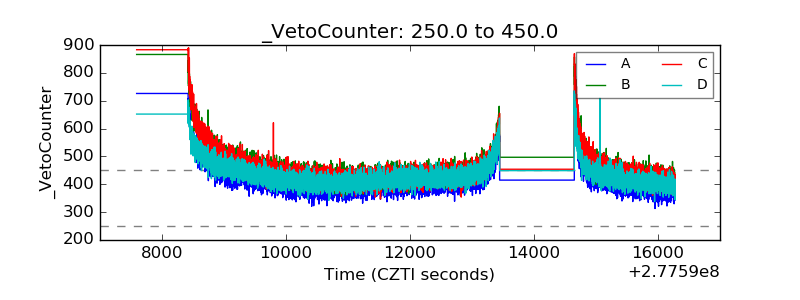 |