| Param | Original file | Final file |
|---|---|---|
| Filename | modeM0/AS1T03_018T01_9000002442_16533cztM0_level2.evt | modeM0/AS1T03_018T01_9000002442_16533cztM0_level2_quad_clean.evt |
| Size (bytes) | 543,430,080 | 83,079,360 |
| Size | 518.3 MB | 79.2 MB |
| Events in quadrant A | 3,837,434 | 498,351 |
| Events in quadrant B | 4,324,287 | 506,364 |
| Events in quadrant C | 3,922,882 | 500,141 |
| Events in quadrant D | 3,859,984 | 484,530 |
| Mode M0 | |||
|---|---|---|---|
| Quadrant | BADHDUFLAG | Total packets | Discarded packets |
| A | 0 | 16256 | 3 |
| B | 0 | 17699 | 2 |
| C | 0 | 16264 | 2 |
| D | 0 | 16805 | 2 |
| Mode M9 | |||
|---|---|---|---|
| Quadrant | BADHDUFLAG | Total packets | Discarded packets |
| A | 0 | 13 | 0 |
| B | 0 | 13 | 0 |
| C | 0 | 13 | 0 |
| D | 0 | 13 | 0 |
| Mode SS | |||
|---|---|---|---|
| Quadrant | BADHDUFLAG | Total packets | Discarded packets |
| A | 0 | 156 | 0 |
| B | 0 | 156 | 0 |
| C | 0 | 156 | 0 |
| D | 0 | 156 | 0 |
| Quadrant | Total seconds | Saturated seconds | Saturation percentage |
|---|---|---|---|
| A | 7559 | 176 | 2.328350% |
| B | 7559 | 258 | 3.413150% |
| C | 7559 | 231 | 3.055960% |
| D | 7559 | 175 | 2.315121% |
Noise dominated data is calculated using 1-second bins in cleaned event files. If a bin has >2000 counts, and if more than 50% of those come from <1% of pixels, then it is considered to be noise-dominated and hence unusable.
| Quadrant | # 1 sec bins | Bins with >0 counts | Bins with >2000 counts | High rate bins dominated by noise | Noise dominated (total time) | Noise dominated (detector-on time) | Marked lightcurve |
|---|---|---|---|---|---|---|---|
| A | 8910 | 7560 | 8 | 8 | 0.09% | 0.11% | 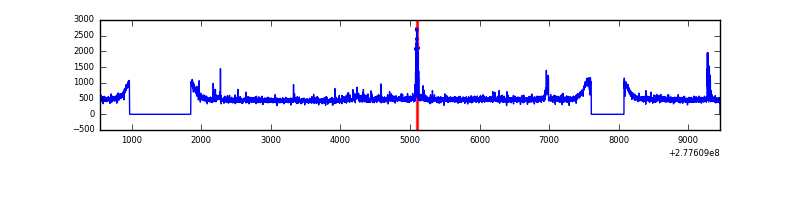 |
| B | 8910 | 7560 | 19 | 19 | 0.21% | 0.25% | 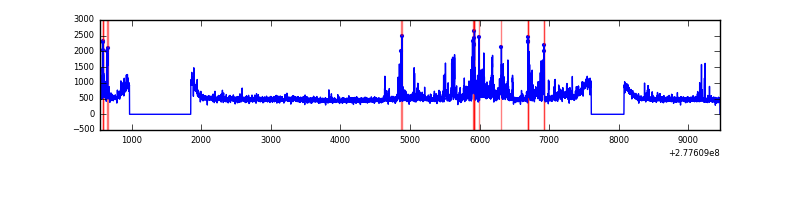 |
| C | 8910 | 7560 | 0 | 0 | 0.00% | 0.00% | 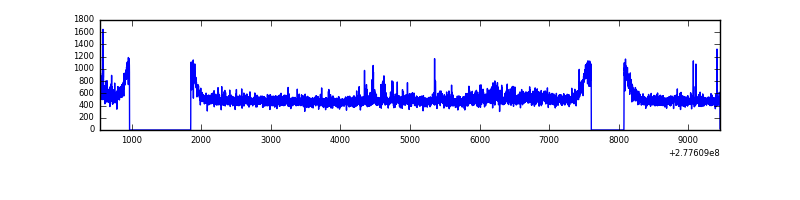 |
| D | 8910 | 7560 | 44 | 44 | 0.49% | 0.58% | 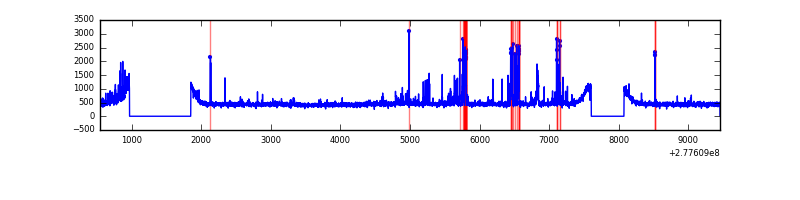 |
Top three noisy pixels from each quadrant. If the there are fewer than three noisy pixels in the level2.evt file, extra rows are filled as -1
| Pixel properties | Quadrant properties | ||||||
|---|---|---|---|---|---|---|---|
| Quadrant | DetID | PixID | Counts | Sigma | Mean | Median | Sigma |
| A | 15 | 174 | 134671 | 696.89 | 942 | 922 | 191.9 |
| A | 3 | 1 | 72844 | 374.74 | 942 | 922 | 191.9 |
| A | 0 | 226 | 8309 | 38.49 | 942 | 922 | 191.9 |
| B | 15 | 35 | 337466 | 1822.0 | 947 | 921 | 184.7 |
| B | 7 | 220 | 45326 | 240.4 | 947 | 921 | 184.7 |
| B | 3 | 209 | 42980 | 227.7 | 947 | 921 | 184.7 |
| C | 7 | 247 | 144046 | 660.5 | 910 | 916 | 216.7 |
| C | 14 | 238 | 137023 | 628.09 | 910 | 916 | 216.7 |
| C | 3 | 233 | 93512 | 427.3 | 910 | 916 | 216.7 |
| D | 1 | 52 | 125657 | 553.47 | 917 | 888 | 225.4 |
| D | 10 | 70 | 122485 | 539.4 | 917 | 888 | 225.4 |
| D | 7 | 38 | 100197 | 440.53 | 917 | 888 | 225.4 |
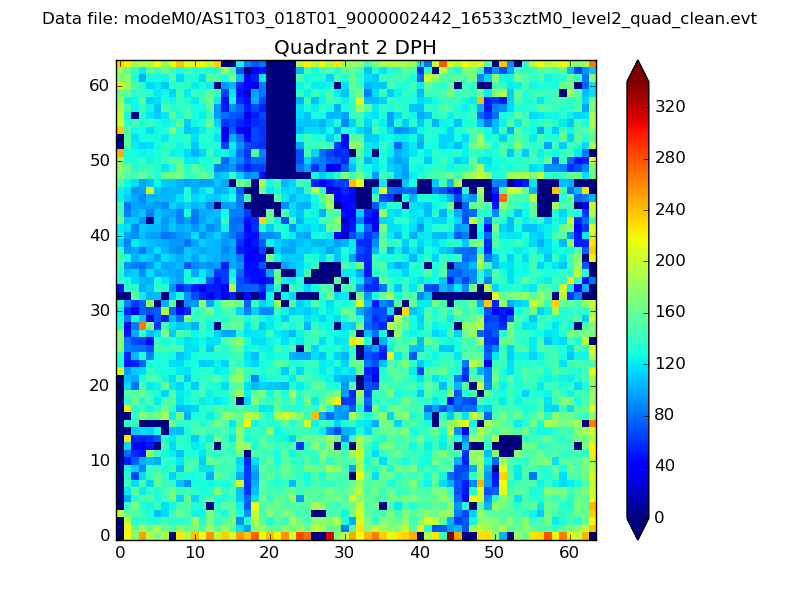
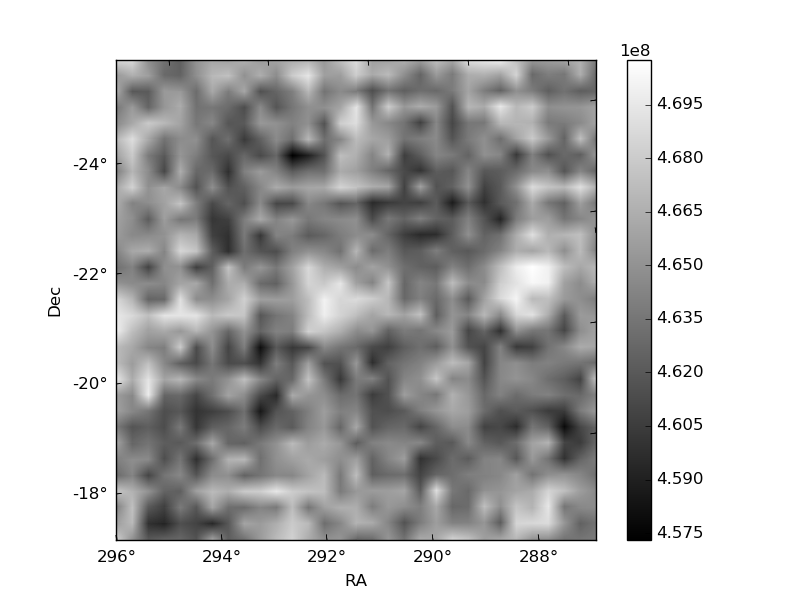
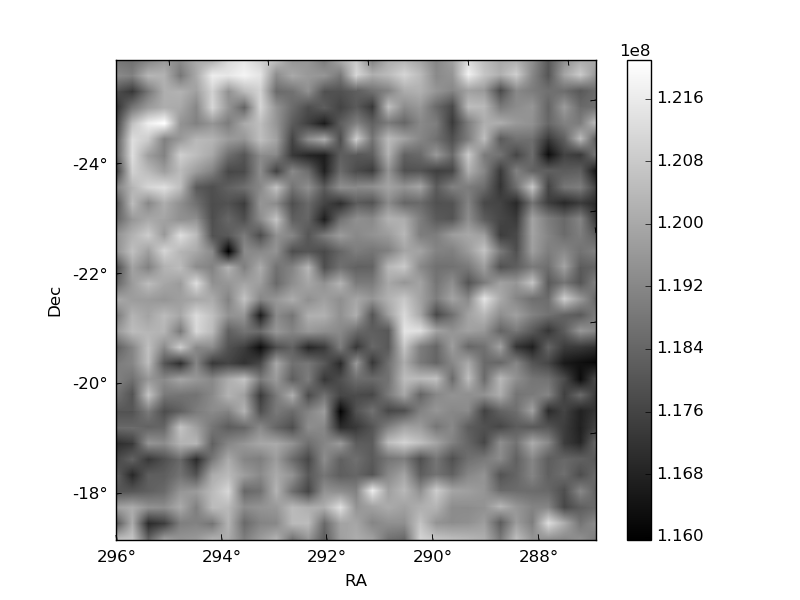
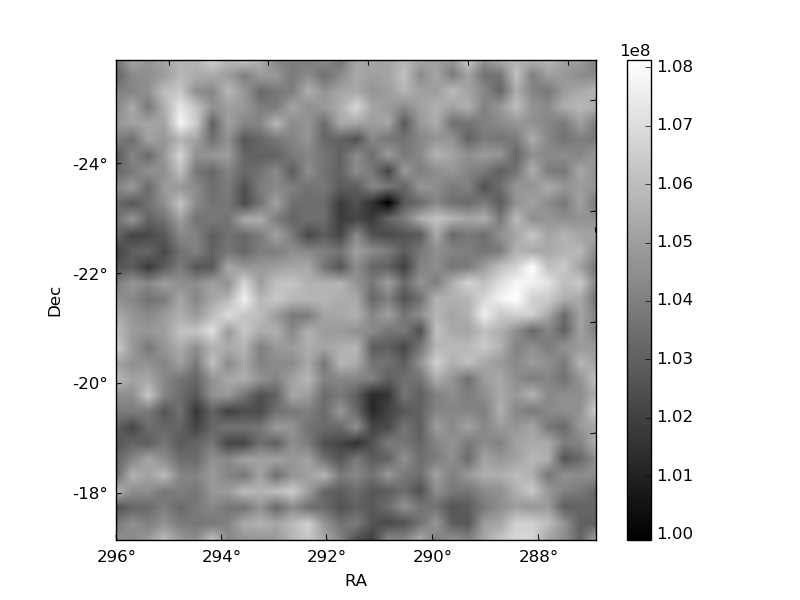
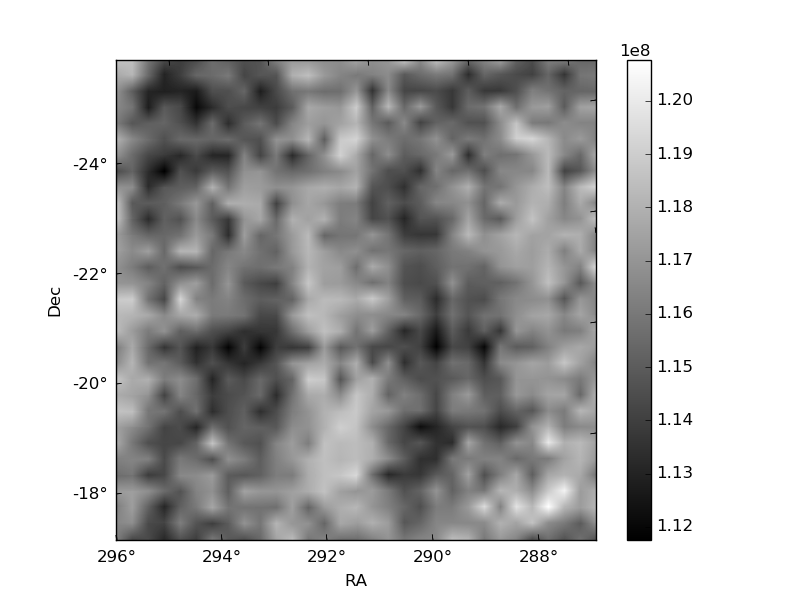
Histogram calculated using DETX and DETY for each event in the final _common_clean file
| Quadrant A | 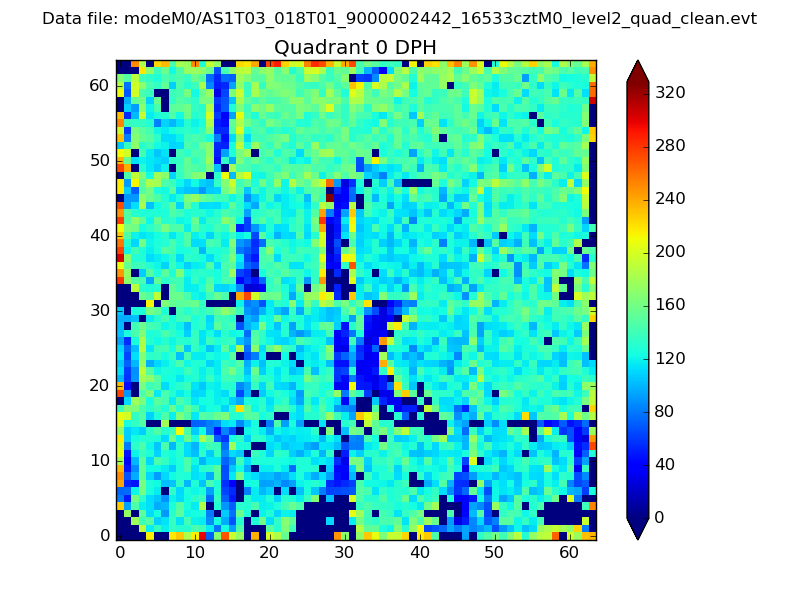 |
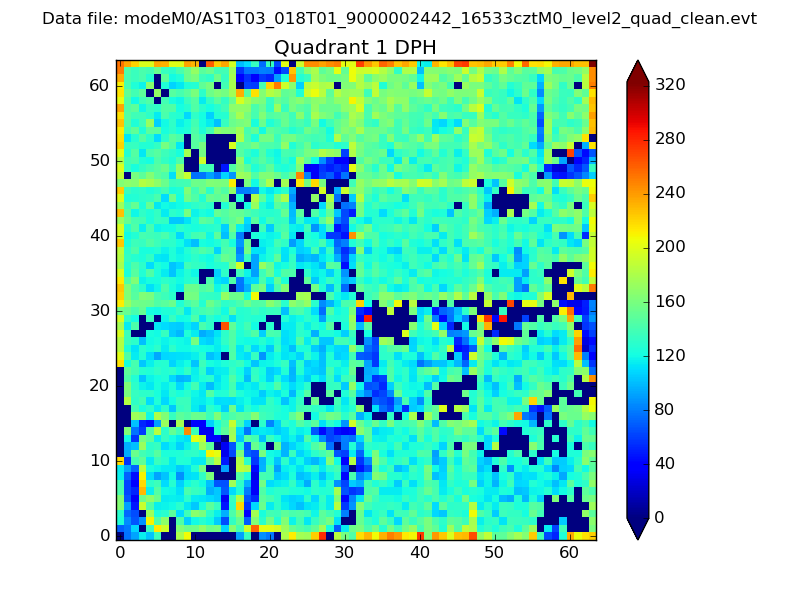 |
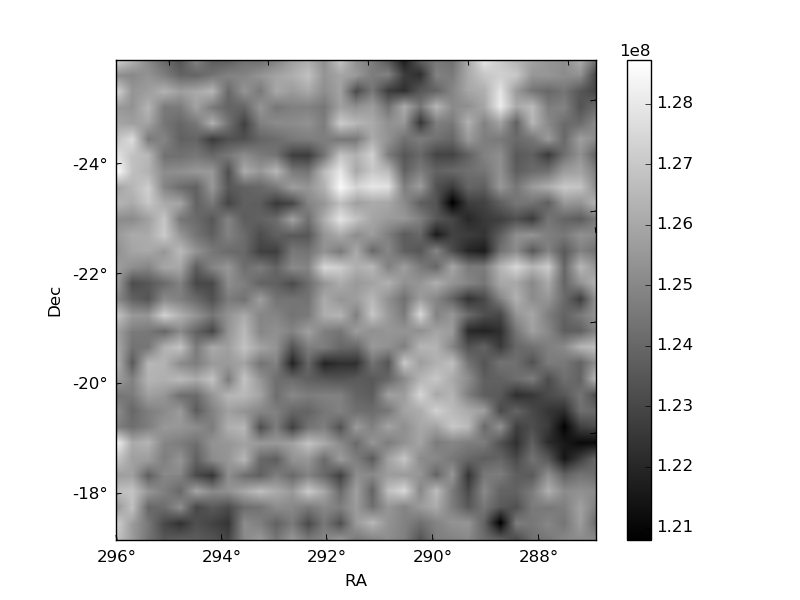
Quadrant B |
|---|---|---|---|
| Quadrant D | 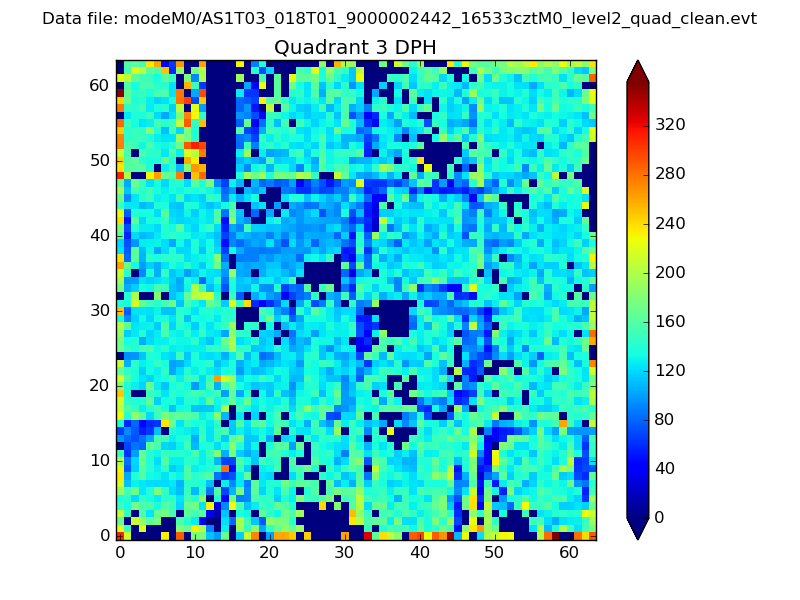 |
 |
Quadrant C |
| Plot type | Count rate plots | Images |
|---|---|---|
| Comparison with Poisson distribution Blue bars denote a histogram of data divided into 1 sec bins. Red curve is a Poisson curve with rate = median count rate of data. |
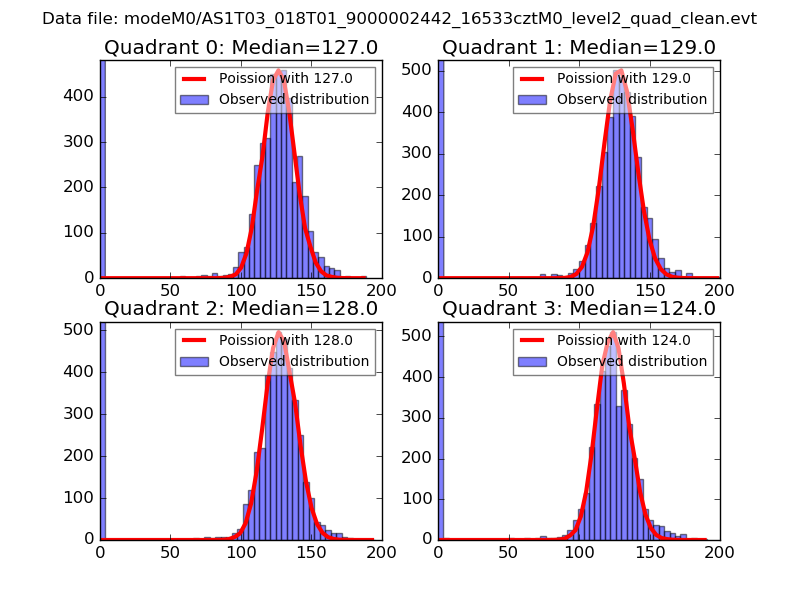 |
 |
| Quadrant-wise count rates Data is divided into 100 sec bins |
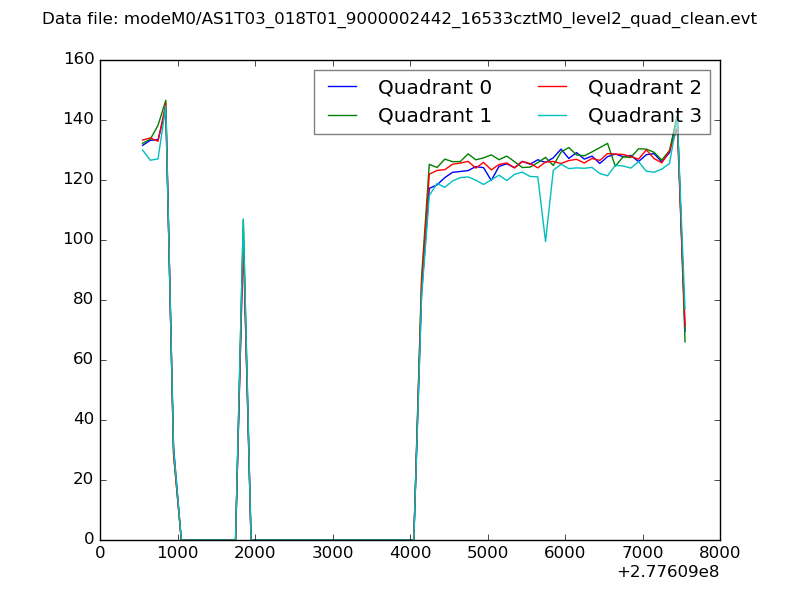 |
|
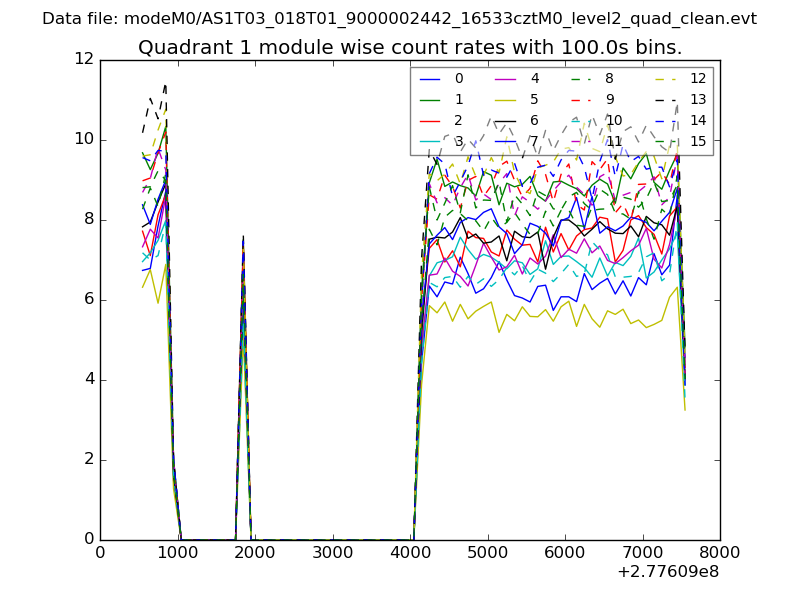
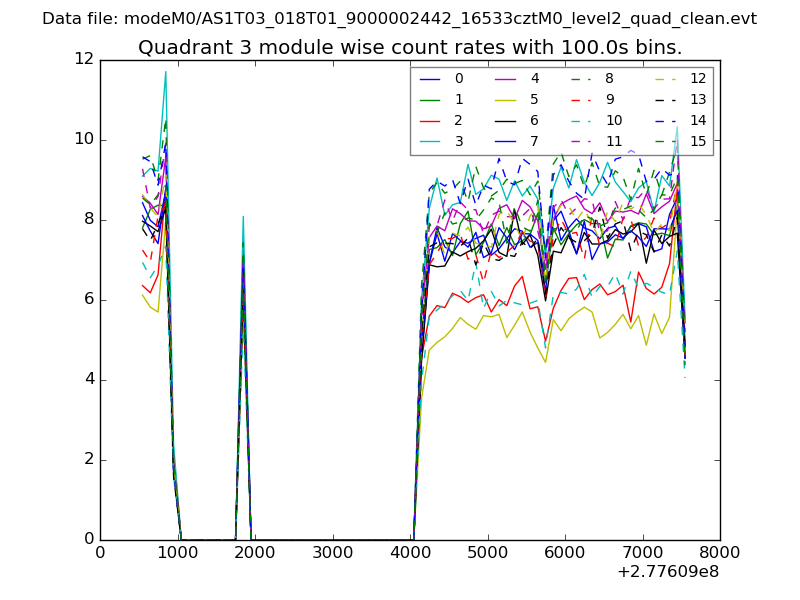
| Module-wise count rates for Quadrant A Data is divided into 100 sec bins |
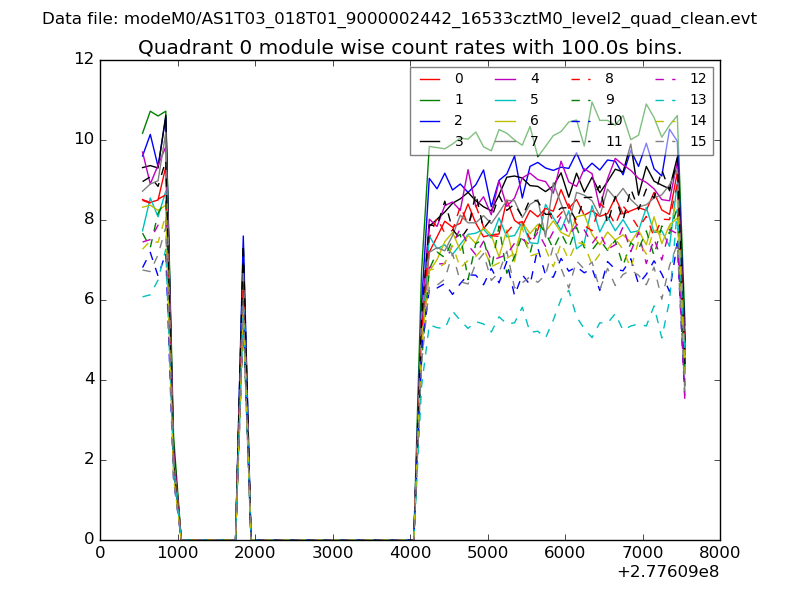 |
 |
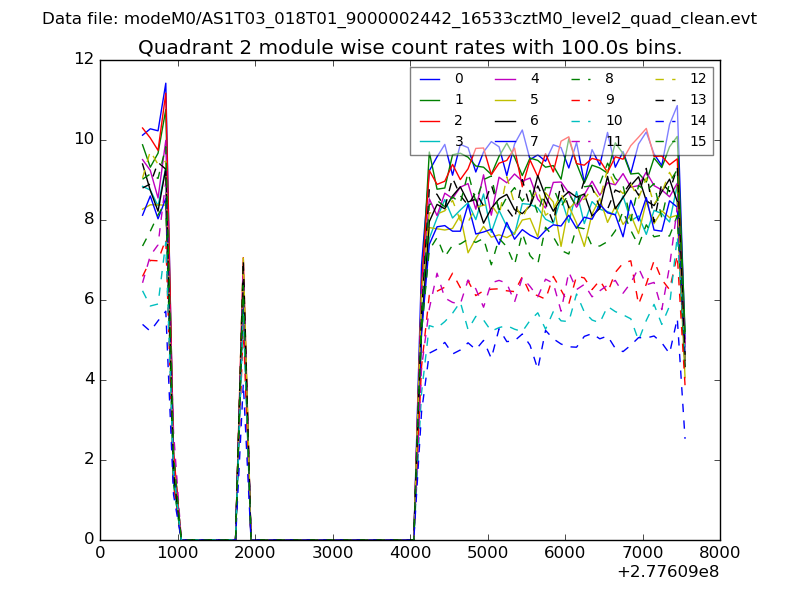
| Module-wise count rates for Quadrant B Data is divided into 100 sec bins |
 |
 |
| Module-wise count rates for Quadrant C Data is divided into 100 sec bins |
 |
 |
| Module-wise count rates for Quadrant D Data is divided into 100 sec bins |
 |
 |
| Parameter | Plot |
|---|---|
| CZT HV Monitor | 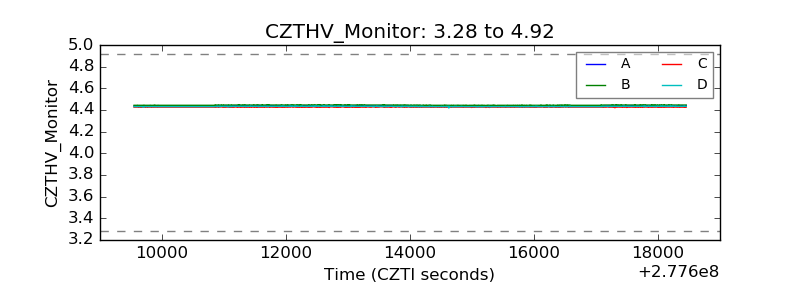 |
| D_VDD | 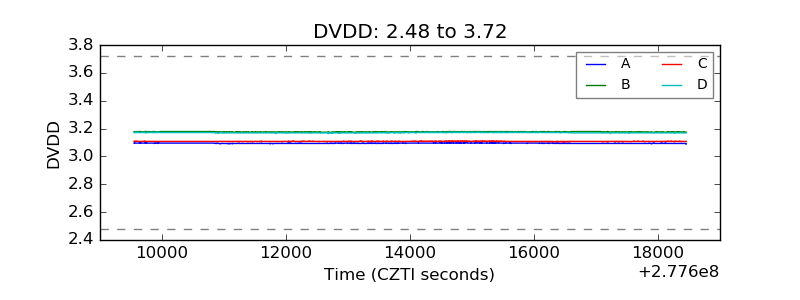 |
| Temperature 1 | 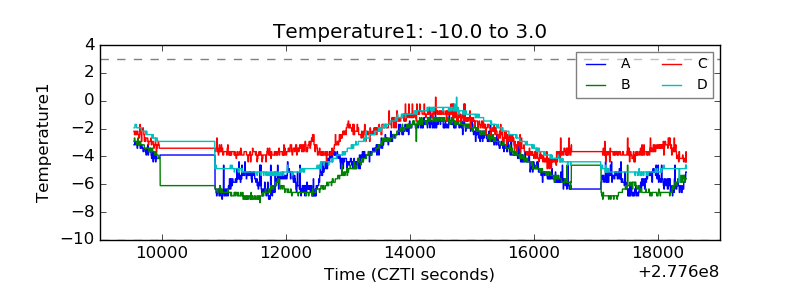 |
| Veto HV Monitor |  |
| Veto LLD | 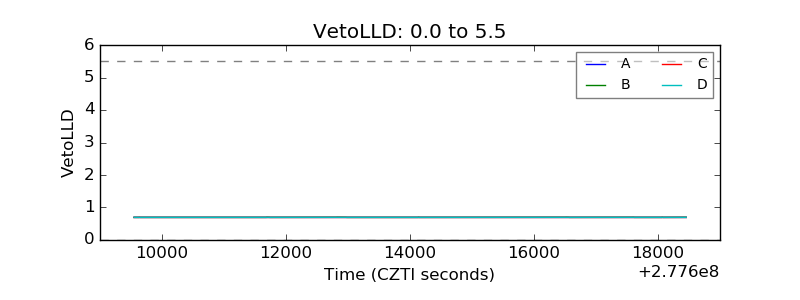 |
| Alpha Counter | 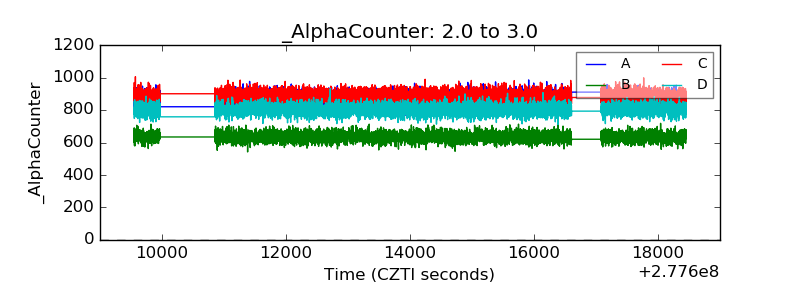 |
| _CPM_Rate | 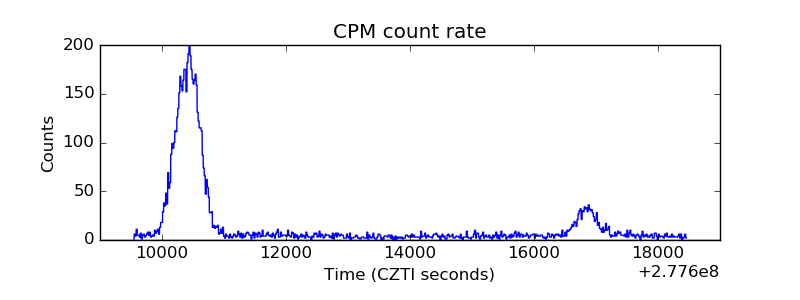 |
| CZT Counter | 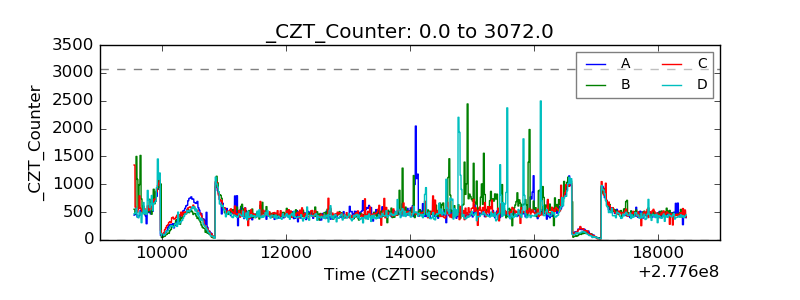 |
| +2.5 Volts monitor |  |
| +5 Volts monitor | 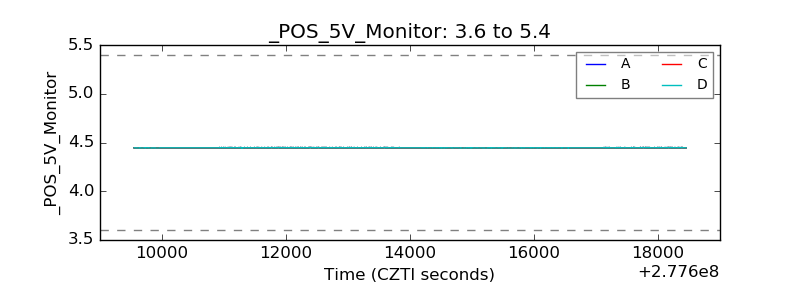 |
| _ROLL_ROT | 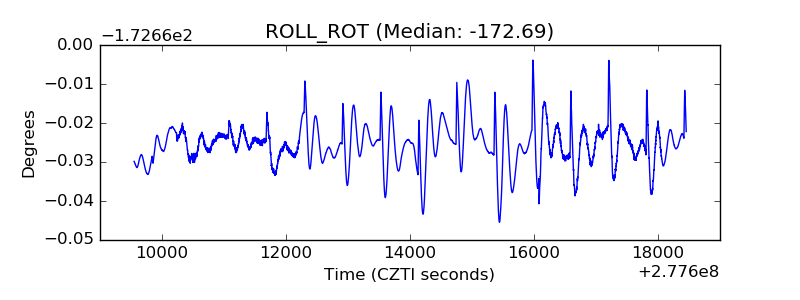 |
| _Roll_DEC | 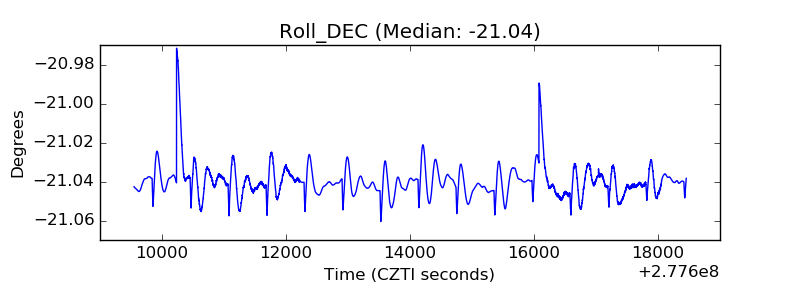 |
| _Roll_RA | 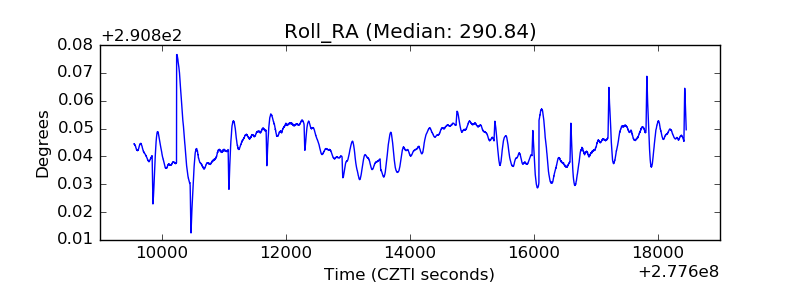 |
| Veto Counter | 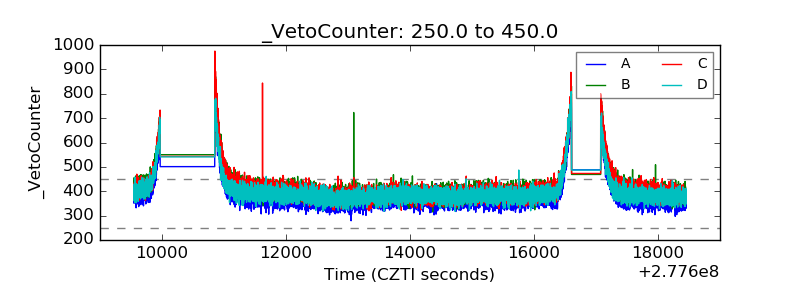 |