| Param | Original file | Final file |
|---|---|---|
| Filename | modeM0/AS1T03_018T01_9000002442_16534cztM0_level2.evt | modeM0/AS1T03_018T01_9000002442_16534cztM0_level2_quad_clean.evt |
| Size (bytes) | 586,512,000 | 89,596,800 |
| Size | 559.3 MB | 85.4 MB |
| Events in quadrant A | 4,181,817 | 530,933 |
| Events in quadrant B | 4,548,690 | 543,183 |
| Events in quadrant C | 4,388,753 | 533,478 |
| Events in quadrant D | 4,073,581 | 522,817 |
| Mode M0 | |||
|---|---|---|---|
| Quadrant | BADHDUFLAG | Total packets | Discarded packets |
| A | 0 | 17896 | 3 |
| B | 0 | 18775 | 2 |
| C | 0 | 18147 | 2 |
| D | 0 | 18006 | 2 |
| Mode M9 | |||
|---|---|---|---|
| Quadrant | BADHDUFLAG | Total packets | Discarded packets |
| A | 0 | 5 | 0 |
| B | 0 | 5 | 0 |
| C | 0 | 5 | 0 |
| D | 0 | 5 | 0 |
| Mode SS | |||
|---|---|---|---|
| Quadrant | BADHDUFLAG | Total packets | Discarded packets |
| A | 0 | 174 | 0 |
| B | 0 | 174 | 0 |
| C | 0 | 174 | 0 |
| D | 0 | 174 | 0 |
| Quadrant | Total seconds | Saturated seconds | Saturation percentage |
|---|---|---|---|
| A | 8382 | 349 | 4.163684% |
| B | 8382 | 401 | 4.784061% |
| C | 8382 | 389 | 4.640897% |
| D | 8382 | 290 | 3.459795% |
Noise dominated data is calculated using 1-second bins in cleaned event files. If a bin has >2000 counts, and if more than 50% of those come from <1% of pixels, then it is considered to be noise-dominated and hence unusable.
| Quadrant | # 1 sec bins | Bins with >0 counts | Bins with >2000 counts | High rate bins dominated by noise | Noise dominated (total time) | Noise dominated (detector-on time) | Marked lightcurve |
|---|---|---|---|---|---|---|---|
| A | 8988 | 8383 | 1 | 1 | 0.01% | 0.01% | 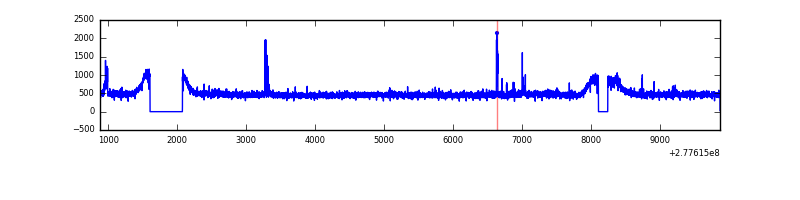 |
| B | 8988 | 8383 | 10 | 10 | 0.11% | 0.12% | 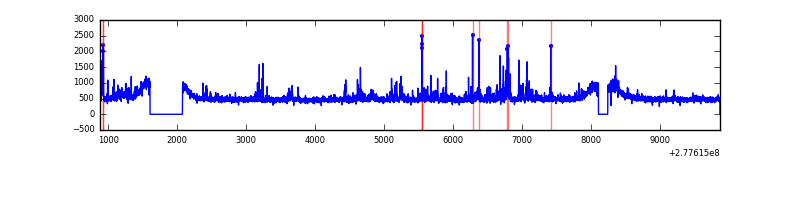 |
| C | 8988 | 8383 | 0 | 0 | 0.00% | 0.00% | 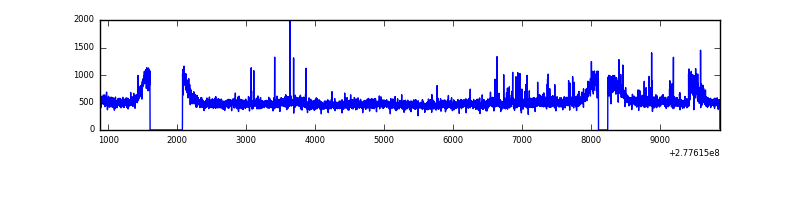 |
| D | 8988 | 8383 | 20 | 20 | 0.22% | 0.24% | 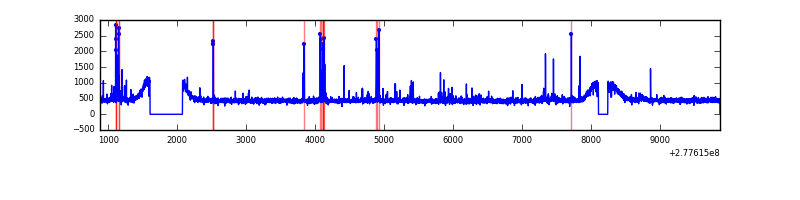 |
Top three noisy pixels from each quadrant. If the there are fewer than three noisy pixels in the level2.evt file, extra rows are filled as -1
| Pixel properties | Quadrant properties | ||||||
|---|---|---|---|---|---|---|---|
| Quadrant | DetID | PixID | Counts | Sigma | Mean | Median | Sigma |
| A | 15 | 174 | 94544 | 430.38 | 1051 | 1022 | 217.3 |
| A | 3 | 1 | 45954 | 206.77 | 1051 | 1022 | 217.3 |
| A | 0 | 226 | 9125 | 37.29 | 1051 | 1022 | 217.3 |
| B | 15 | 35 | 135288 | 653.17 | 1053 | 1024 | 205.6 |
| B | 3 | 209 | 47663 | 226.89 | 1053 | 1024 | 205.6 |
| B | 0 | 197 | 42208 | 200.35 | 1053 | 1024 | 205.6 |
| C | 3 | 233 | 240992 | 994.71 | 1013 | 1019 | 241.2 |
| C | 14 | 238 | 151538 | 623.91 | 1013 | 1019 | 241.2 |
| C | 7 | 247 | 40301 | 162.83 | 1013 | 1019 | 241.2 |
| D | 10 | 70 | 91147 | 329.73 | 1023 | 999 | 273.4 |
| D | 7 | 38 | 37096 | 132.03 | 1023 | 999 | 273.4 |
| D | 2 | 234 | 36297 | 129.11 | 1023 | 999 | 273.4 |
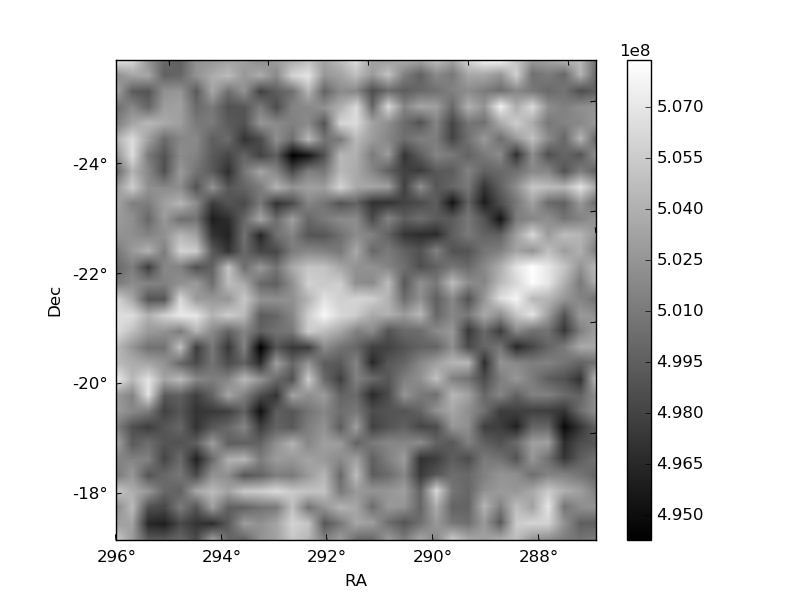
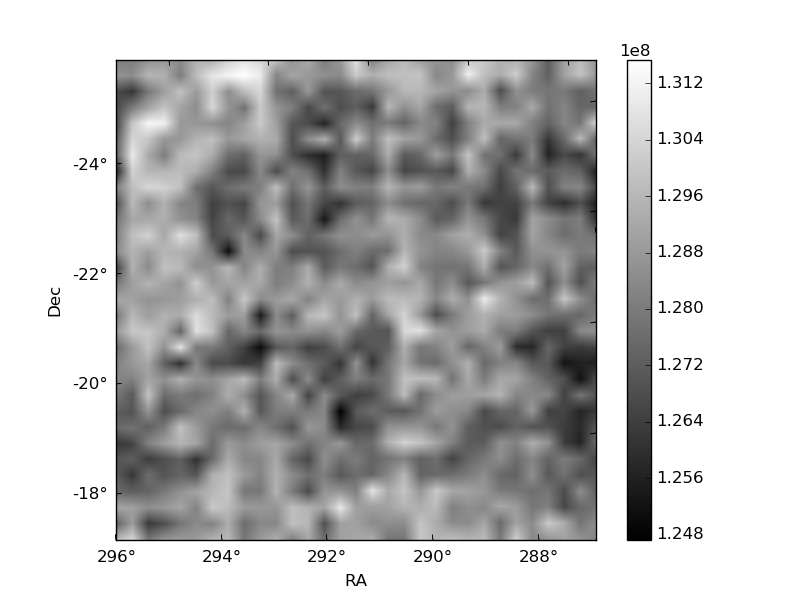
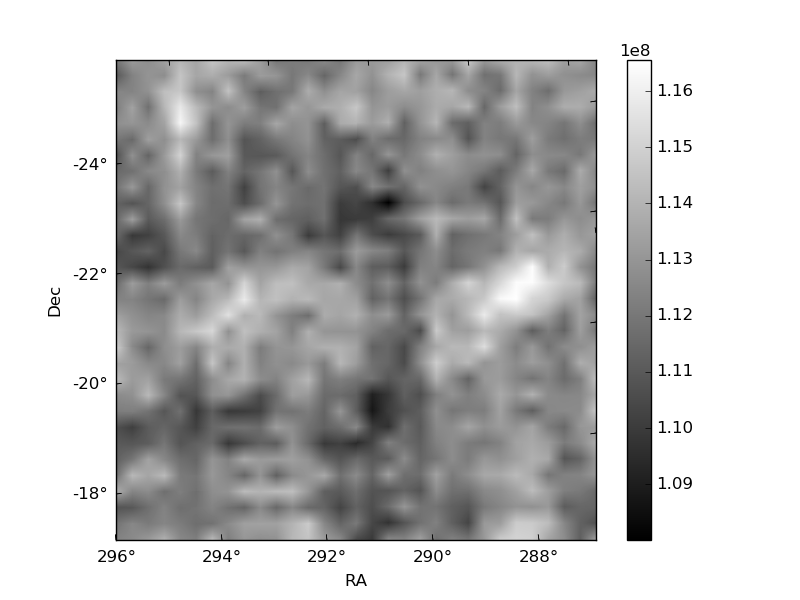
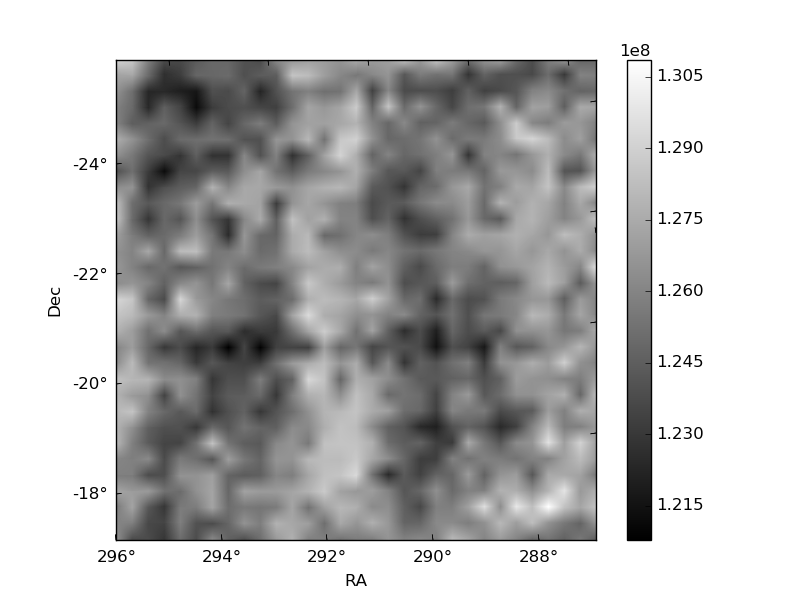
Histogram calculated using DETX and DETY for each event in the final _common_clean file
| Quadrant A | 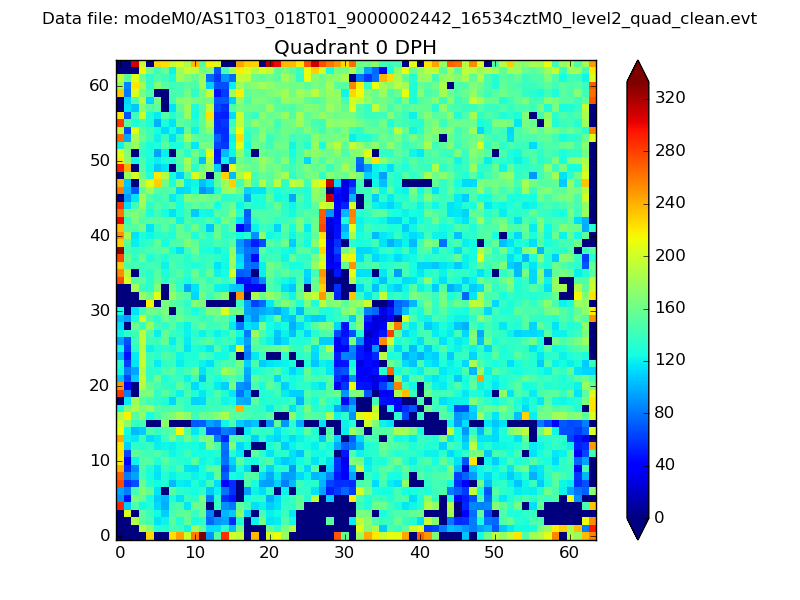 |
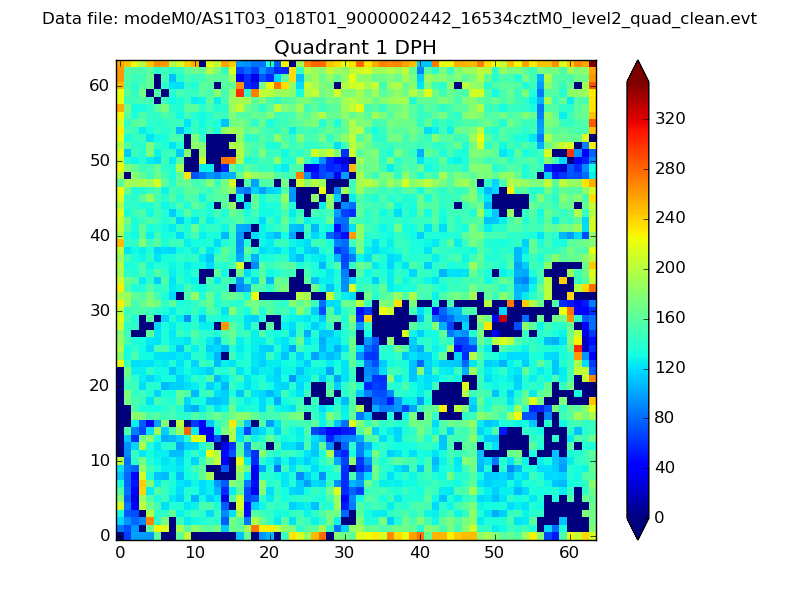 |
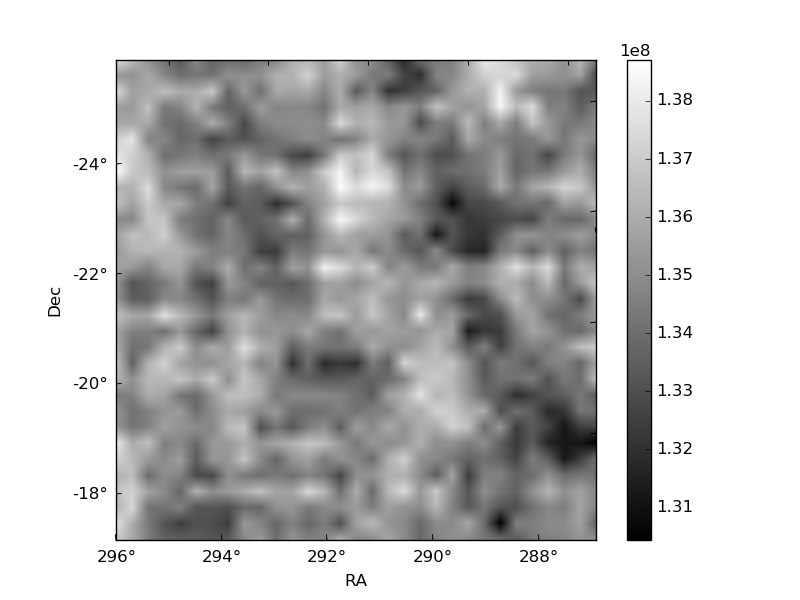
Quadrant B |
|---|---|---|---|
| Quadrant D | 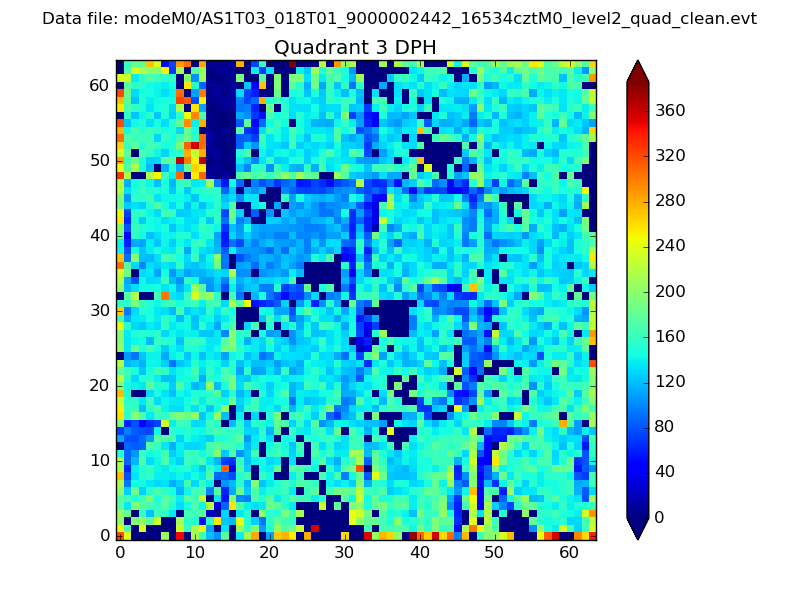 |
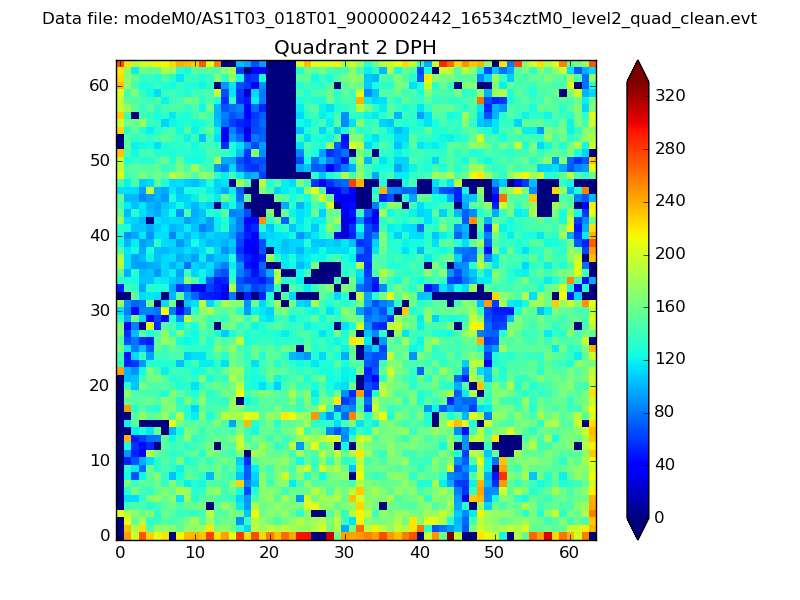 |
Quadrant C |
| Plot type | Count rate plots | Images |
|---|---|---|
| Comparison with Poisson distribution Blue bars denote a histogram of data divided into 1 sec bins. Red curve is a Poisson curve with rate = median count rate of data. |
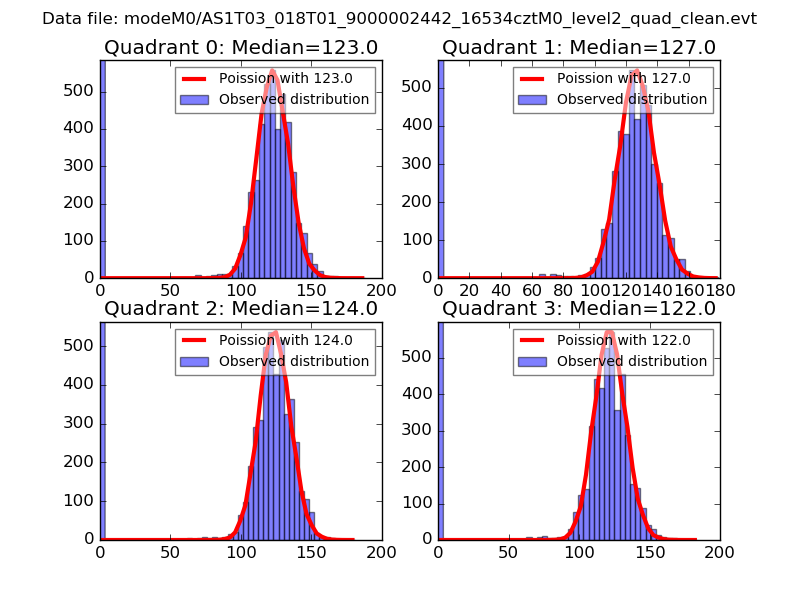 |
 |
| Quadrant-wise count rates Data is divided into 100 sec bins |
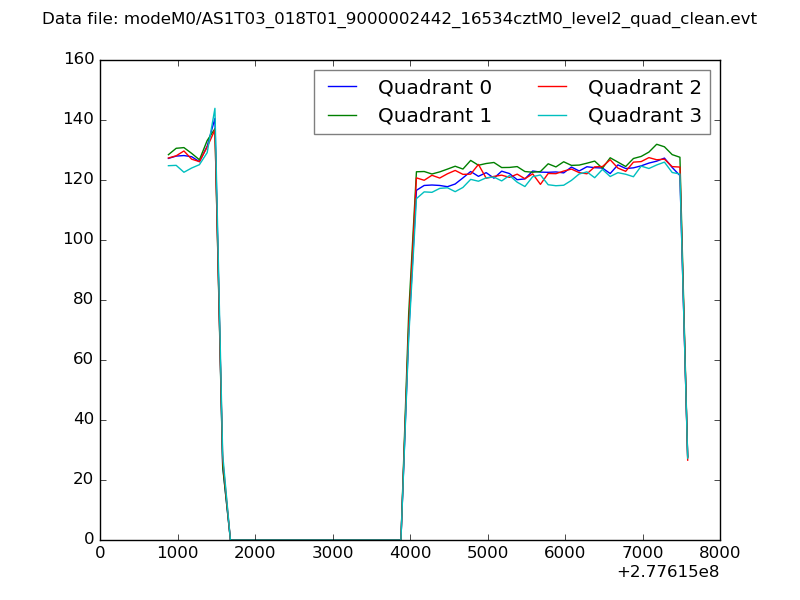 |
|
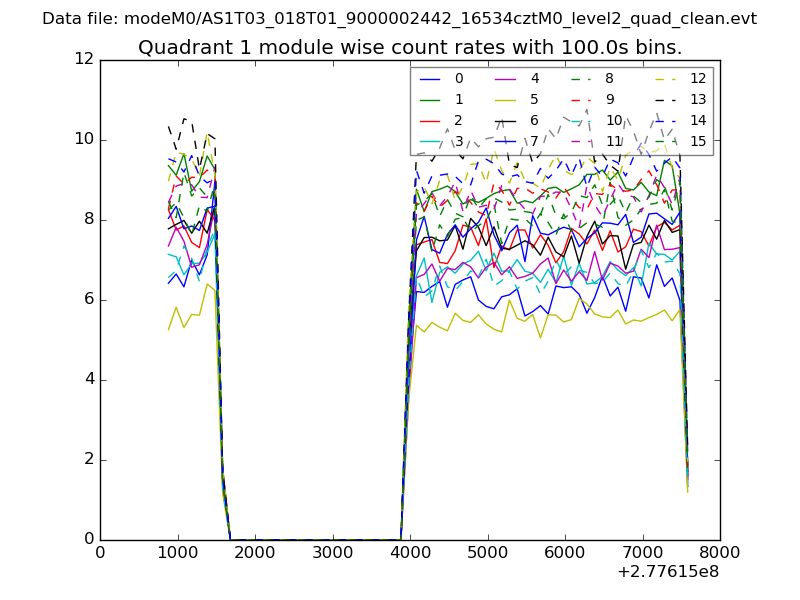
| Module-wise count rates for Quadrant A Data is divided into 100 sec bins |
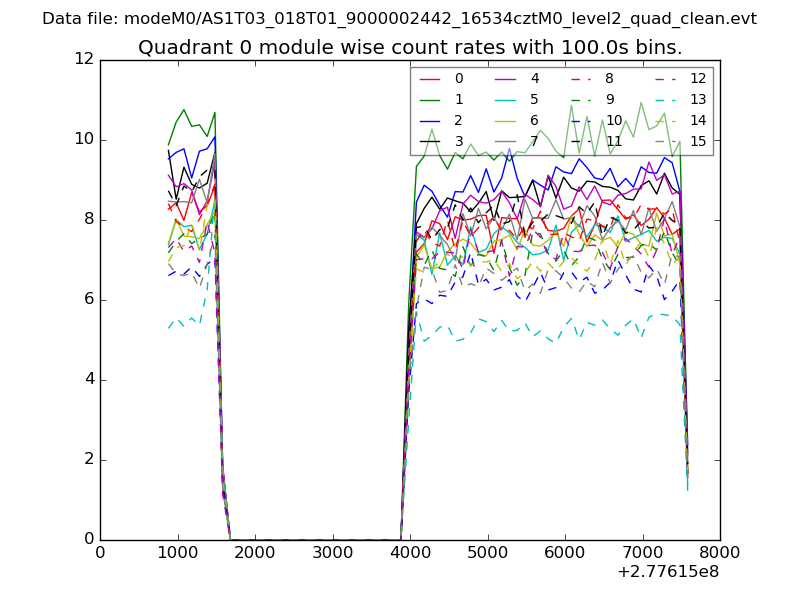 |
 |
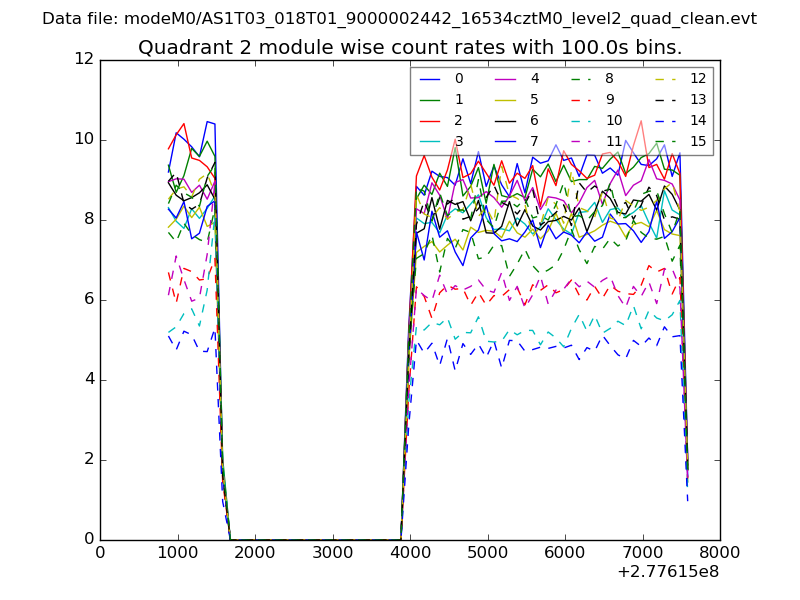
| Module-wise count rates for Quadrant B Data is divided into 100 sec bins |
 |
 |
| Module-wise count rates for Quadrant C Data is divided into 100 sec bins |
 |
 |
| Module-wise count rates for Quadrant D Data is divided into 100 sec bins |
 |
 |
| Parameter | Plot |
|---|---|
| CZT HV Monitor | 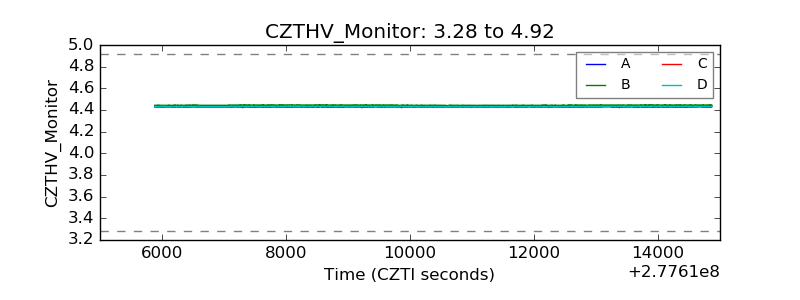 |
| D_VDD | 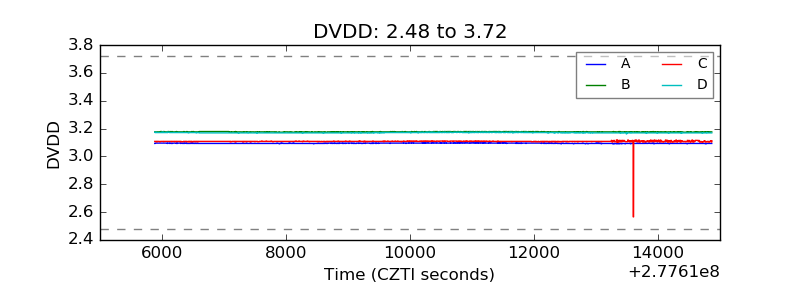 |
| Temperature 1 | 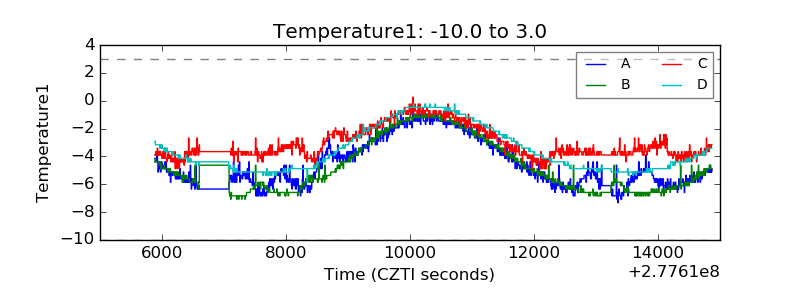 |
| Veto HV Monitor | 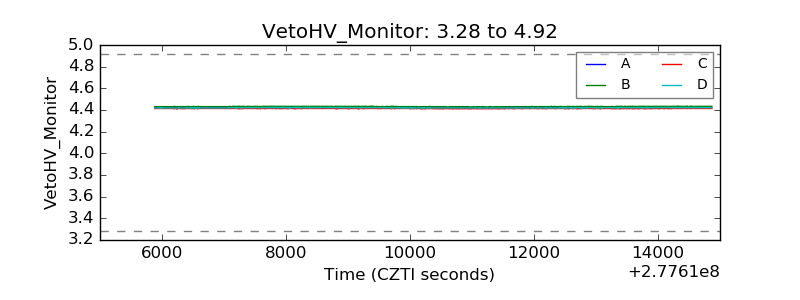 |
| Veto LLD | 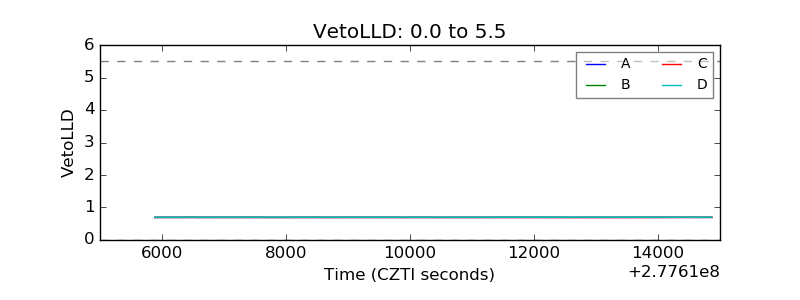 |
| Alpha Counter | 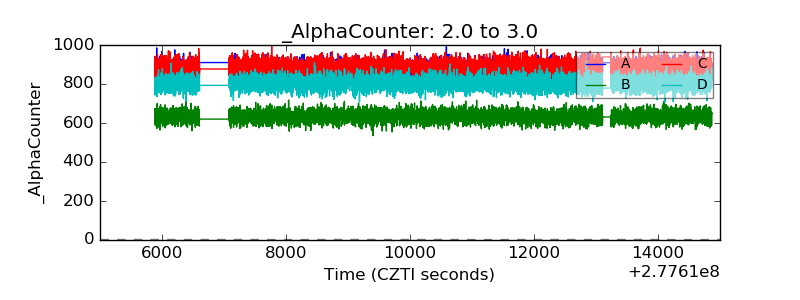 |
| _CPM_Rate | 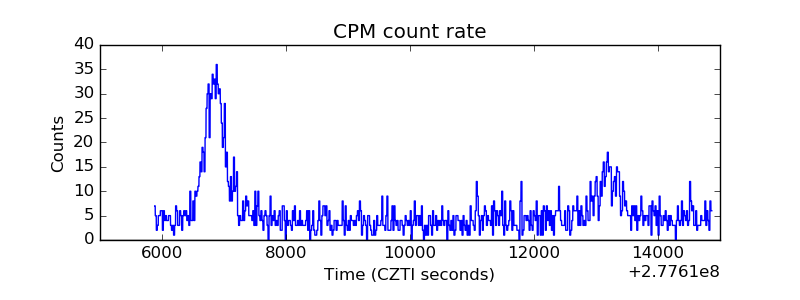 |
| CZT Counter | 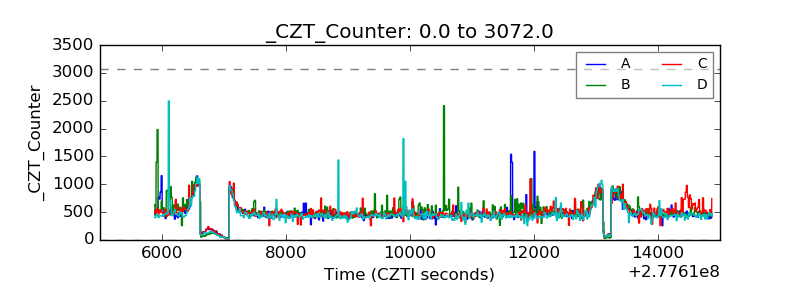 |
| +2.5 Volts monitor |  |
| +5 Volts monitor |  |
| _ROLL_ROT | 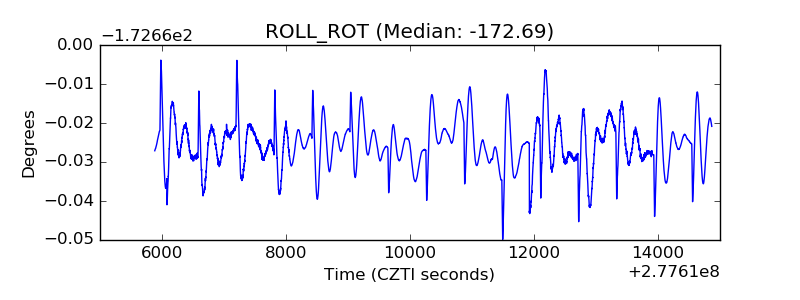 |
| _Roll_DEC |  |
| _Roll_RA | 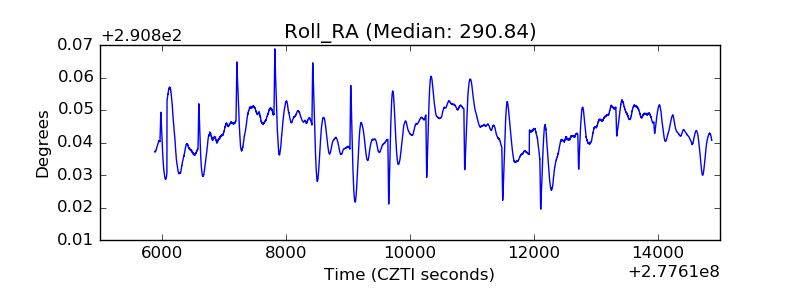 |
| Veto Counter |  |